Research
The $6,500 energy surcharge, next to the bill Americans already pay
A household forecast, on top of a per-person bill
A California think tank, Energy Innovation, said Friday that households in the contiguous United States will pay an average $6,500 more for energy, cumulatively through 2040, because of federal policy changes since President Donald Trump returned to office. In five states — Oregon, Mississippi, South Dakota, Virginia and Wyoming — the extra cost is about $9,000, according to the same modeling, reported by the Associated Press. Oregon’s annual extra bill was projected at $840 in 2035 and $1,200 in 2040. The White House called the group partisan and said Trump is fixing a “grid crisis.”
That $6,500 figure is a household increment, spread over 15 years, and it is a model, not a receipt. It is also a different unit from the official spending books. The Bureau of Economic Analysis publishes personal consumption expenditures by state in current dollars. Divided by resident population, those books say Americans already spent $2,228 per person in 2024 on four energy categories combined: household electricity, household natural gas, household fuel oil and other fuels, and motor-vehicle fuels, lubricants and fluids. That is not a household average. It is not a forecast. It is last year’s bill, before diesel set a U.S. record this autumn and before the G7 agreed to tap 100 million barrels of oil.
The comparison is still useful, if you keep the units straight. A $6,500 extra household cost through 2040 is a long, slow add-on. Two thousand two hundred dollars per person in a single year is the floor that add-on would sit on. In 2024 that energy bundle was 3.8 percent of total per-person consumption, which itself was $58,499. Energy is not the grocery bill. It is large enough that a few hundred extra dollars a year is not a rounding error — and small enough that motor fuel, not the light switch, still does most of the damage.
Americans already spent more than $2,200 a person on energy in 2024

View exact chart values
| year | electricity_per_person | natural_gas_per_person | fuel_oil_per_person | motor_fuels_per_person | home_energy_per_person | total_energy_per_person | gasoline_energy_goods_pcap | total_pce_pcap |
|---|---|---|---|---|---|---|---|---|
| 2010 | 539 | 176.6 | 79.4 | 1008.9 | 795.1 | 1804 | 1088 | 33164 |
| 2011 | 534.5 | 167.3 | 86.6 | 1240.3 | 788.5 | 2028.8 | 1327 | 34309 |
| 2012 | 519.3 | 141.2 | 76.8 | 1265.5 | 737.2 | 2002.8 | 1342 | 35145 |
| 2013 | 533.9 | 160.2 | 81.9 | 1249.2 | 776 | 2025.3 | 1331 | 35956 |
| 2014 | 551.7 | 175.4 | 87.1 | 1200 | 814.2 | 2014.2 | 1287 | 37194 |
| 2015 | 551.8 | 149.2 | 66.5 | 924.1 | 767.5 | 1691.6 | 991 | 38213 |
| 2016 | 545.8 | 135 | 56.7 | 828.2 | 737.5 | 1565.7 | 885 | 39238 |
| 2017 | 544 | 147.7 | 65.8 | 926.2 | 757.4 | 1683.6 | 992 | 40693 |
| 2018 | 580.4 | 166.4 | 76 | 1040.1 | 822.9 | 1863 | 1116 | 42415 |
| 2019 | 567.2 | 163.8 | 72.1 | 995.4 | 803.1 | 1798.5 | 1067 | 43720 |
| 2020 | 577.9 | 152.2 | 60.5 | 719 | 790.6 | 1509.6 | 779 | 42920 |
| 2021 | 604.4 | 179 | 74.2 | 1087.3 | 857.6 | 1945 | 1162 | 48539 |
| 2022 | 697.3 | 235.9 | 98.5 | 1442.2 | 1031.7 | 2473.9 | 1541 | 52961 |
| 2023 | 703 | 197.7 | 83.1 | 1297.4 | 983.8 | 2281.2 | 1380 | 55917 |
| 2024 | 745.4 | 187.1 | 77.2 | 1218.4 | 1009.7 | 2228.1 | 1295 | 58499 |
The pump still outspends the meter
Of that $2,228, motor-vehicle fuels took $1,218, or 54.7 percent. Electricity took $745, or 33.5 percent. Natural gas took $187, or 8.4 percent. Household fuel oil and other fuels took $77, or 3.5 percent. If you are picturing the Energy Innovation story as a fight over power plants and electric cars, notice what households actually paid for: more than half the energy bill left the driveway.
The mix has not been stable. Per-person motor-fuel spending jumped to $1,442 in 2022, the year after the last oil spike, then eased to $1,218 in 2024. Electricity did not ease. It rose from $567 in 2019 to $745 in 2024, a 31.4 percent increase in current dollars, and it was still climbing after the pump bill came off its peak. The combined energy total peaked at $2,474 per person in 2022 and was still $2,228 in 2024, 24 percent above 2019. The Iran war and this year’s diesel record are not in these annual books. They will show up, if they show up, in 2025 and 2026.
That is why a G7 oil release and a household electricity forecast can be the same political argument wearing different hats. Voters feel the gallon first. The think tank’s extra $6,500 is mostly a later electricity-and-gasoline story. The official books say the later story is already in motion: electricity has been the part of the bill that did not come back down.
Motor fuel still takes more than half of the energy bill

View exact chart values
| category | dollars_per_person | share_pct |
|---|---|---|
| Motor vehicle fuels | 1218.4 | 54.7 |
| Electricity | 745.4 | 33.5 |
| Natural gas | 187.1 | 8.4 |
| Fuel oil and other fuels | 77.2 | 3.5 |
The five named states are not a single energy country
Energy Innovation’s five high-cost states do not start from the same place. In 2024, combining electricity, natural gas and motor fuels per person, South Dakota spent $1,853 and Oregon $1,910 — both below the U.S. combined figure of $2,228. Virginia spent $2,064, still below average. Mississippi spent $2,342 and Wyoming $2,468, both above it. If the extra $9,000 through 2040 lands evenly, it lands on two states that already pay more than the country and three that pay less.
The mix inside those totals is the real split. Wyoming’s extra is not the light bill. Wyoming spent $619 per person on electricity, the lowest of the five and below the U.S. $745, but $1,556 on motor fuels and $294 on natural gas. Mississippi’s extra is the meter: $823 on electricity, the highest of this group, plus $1,339 on motor fuels. Oregon, the state the model says will see the largest extra annual cost by 2040, spent $649 on electricity and $1,117 on motor fuels — below the U.S. average on both. South Dakota looks like a smaller Oregon with more natural gas. Virginia sits close to the national mix.
None of that proves the forecast is wrong. A state with cheap hydropower can still get more expensive if federal policy takes cheap options off the table. It does mean “Oregon will pay the most extra” is not the same sentence as “Oregon already pays the most.” The books through 2024 say it does not.
Two of the five “highest extra cost” states already spend above the U.S. average

View exact chart values
| state | total_energy_per_person |
|---|---|
| South Dakota | 1853 |
| Oregon | 1910.2 |
| Virginia | 2064.3 |
| United States | 2228.1 |
| Mississippi | 2342.1 |
| Wyoming | 2467.8 |
Wyoming’s extra bill is already at the pump, not the light switch

View exact chart values
| state | electricity | natural_gas | motor_fuels |
|---|---|---|---|
| Oregon | 648.9 | 144 | 1117.3 |
| Mississippi | 822.8 | 180.4 | 1338.9 |
| South Dakota | 646.1 | 205.5 | 1001.4 |
| Virginia | 720 | 167.6 | 1176.8 |
| Wyoming | 618.5 | 293.7 | 1555.6 |
| United States | 745.4 | 187.1 | 1218.4 |
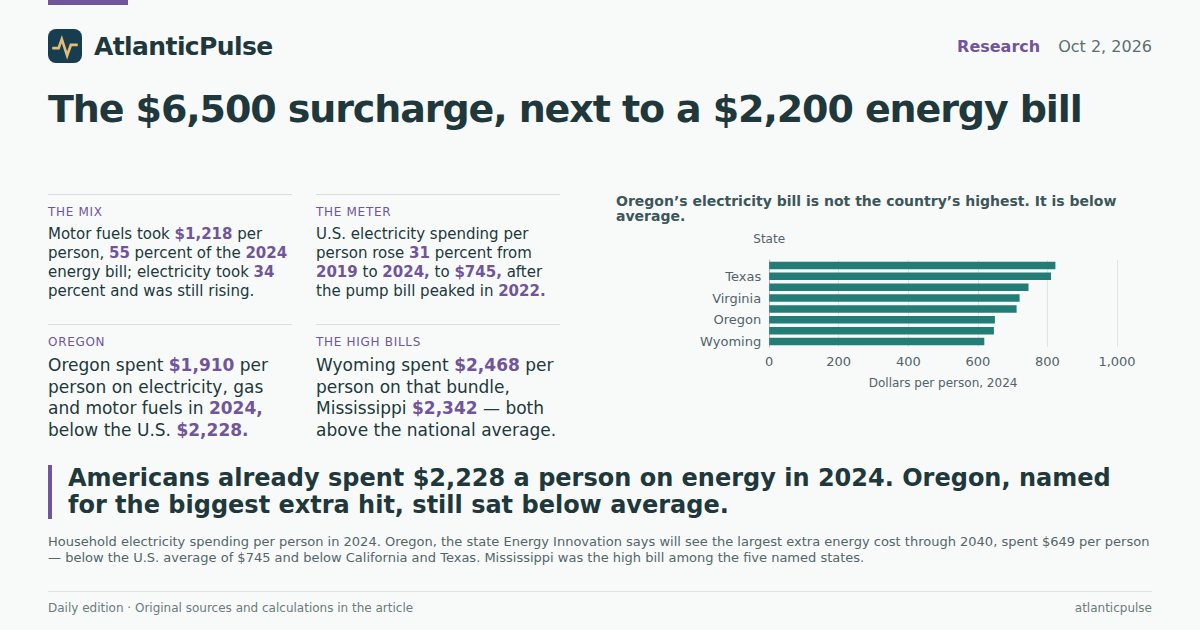
Oregon’s electricity bill is below average. Mississippi’s is not.
Put electricity alone on a bar and the named-state story gets more awkward. Wyoming, South Dakota and Oregon all spent less per person on household electricity in 2024 than the United States. Virginia was a shade below average at $720. Mississippi was above it at $823. California, which Energy Innovation’s critics in the White House like to cite as a renewable-power cautionary tale, spent $711 per person — below the national average, and below Texas at $810. These are spending figures, not cents per kilowatt-hour. A cheap rate in a hot state can still produce a fat bill. A high rate in a mild, hydro-heavy state can still produce a thin one.
Oregon’s electricity spending is not frozen. It rose from $493 per person in 2019 to $649 in 2024, a 32 percent increase, almost identical to the national 31 percent rise. Mississippi’s electricity spending rose from $671 to $823. Wyoming’s rose from $509 to $619. The five states are not unique in having a rising electricity bill. They are unique, in the think tank’s telling, in how much extra they are modeled to pay from here. The last official year cannot confirm that. It can only show that Oregon started the extra-cost era as a below-average electricity state whose motor-fuel bill was also below average.
A broader gasoline-and-other-energy-goods series, which folds household fuel oil into the pump bill, makes the same point with a warning label. In 2024 that combined category was $1,190 per person in Oregon and $1,676 in Wyoming, against a U.S. $1,295. Maine, a heating-oil state, was $1,879 in the selected comparison group. Hawaii was $712. That is not a complete state ranking. It is enough to say Wyoming already lives with a fat fuel bill and Oregon does not, and that fuel oil can impersonate a gasoline problem if you let the category names blur.
Oregon’s electricity bill is not the country’s highest. It is below average.

View exact chart values
| state | electricity_per_person |
|---|---|
| Wyoming | 618.5 |
| South Dakota | 646.1 |
| Oregon | 648.9 |
| California | 711.3 |
| Virginia | 720 |
| United States | 745.4 |
| Texas | 810.3 |
| Mississippi | 822.8 |
What the $6,500 does not buy you
Keep the caveats in one pile. These are current-dollar spending figures, so inflation is inside them. They are per person, so a household of three already spent something like three times $2,228 on these categories in 2024 if it spent like the average person — and BEA does not publish that household number here. Motor fuels in the PCE accounts are household purchases of gasoline, diesel and related fluids, not the trucking industry’s freight bill. Data-center power shows up in the electricity system, and then in rates, more than as a line item on a family’s statement. The last year in the table is 2024. Diesel’s $6.52 record on Sept. 22, 2026, and the G7’s 100-million-barrel release are later news.
Energy Innovation’s $6,500 is a modeled extra cost from a specific set of federal changes: tax-credit cuts, power-plant and fuel-economy rollbacks, and halted wind, solar and hydrogen projects. This article does not re-run that model and does not treat the 2019–2024 rise as proof of those policies. Trump took office again in 2025. Most of the climb in these tables happened earlier, through the pandemic rebound and the 2022 fuel spike. What the tables do say is simpler. Americans already devote more than two thousand dollars a person to keeping the lights on and the tank from empty. Motor fuel is still the bigger slice. Electricity is the slice that has not retreated. And the five states picked out for the largest extra hit are not five copies of the same bill.
Sources and methods
Spending figures are BEA personal consumption expenditures by state in millions of current dollars, converted to dollars per person with BEA resident population (civilian and military) for the same calendar year. Per-person amounts are not household averages and are not equivalent to Energy Innovation’s per-household cumulative projection through 2040.
The four energy categories used for the combined bill are household electricity; household natural gas; household fuel oil and other fuels; and motor-vehicle fuels, lubricants and fluids. They are not double-counted. A separate BEA series, “gasoline and other energy goods,” includes motor fuels plus fuel oils and is labeled as such when used.
All dollar figures are current dollars, so price change is inside the totals. The latest overlapping year for spending and population in these extracts is 2024. Observation years are calendar years, not release dates. The PCE snapshot is BEA SAPCE release bea-sapce-2025-09-26. Population is from BEA state annual personal income, release bea-regional-state-annual-2026-04-09.
State comparisons for electricity include California and Texas as large-state context, not a complete 50-state ranking. Gasoline-and-other-energy-goods bars are a selected group of states, not a claim about every state. Missing values were not treated as zero. No causal effect is inferred from the 2019–2024 rise, which mostly predates the 2025 policy changes in the Energy Innovation model.
Research completed 2026-10-03, for the October 2, 2026 news edition. The available source data may cover earlier periods; see the observation periods and source vintages above.