Research
The 5% construction drop was real. It was also about 200 jobs.
The 5 percent that made the news
Today’s reporting from the Rio Grande Valley is blunt: ICE community arrests by the Harlingen office jumped from about 400 in 2024 to more than 9,000 in 2026, construction jobs in the Brownsville-Harlingen metro fell 5 percent from a year earlier, and builders say projects are stalling because the workers who used to fill those jobs are gone or afraid to show up. That is a local labor-market story with a statewide punchline. If South Texas construction is already shrinking on the official books, readers should be able to see it. If the 5 percent figure is a rounding error on a tiny series, they should be able to see that too.
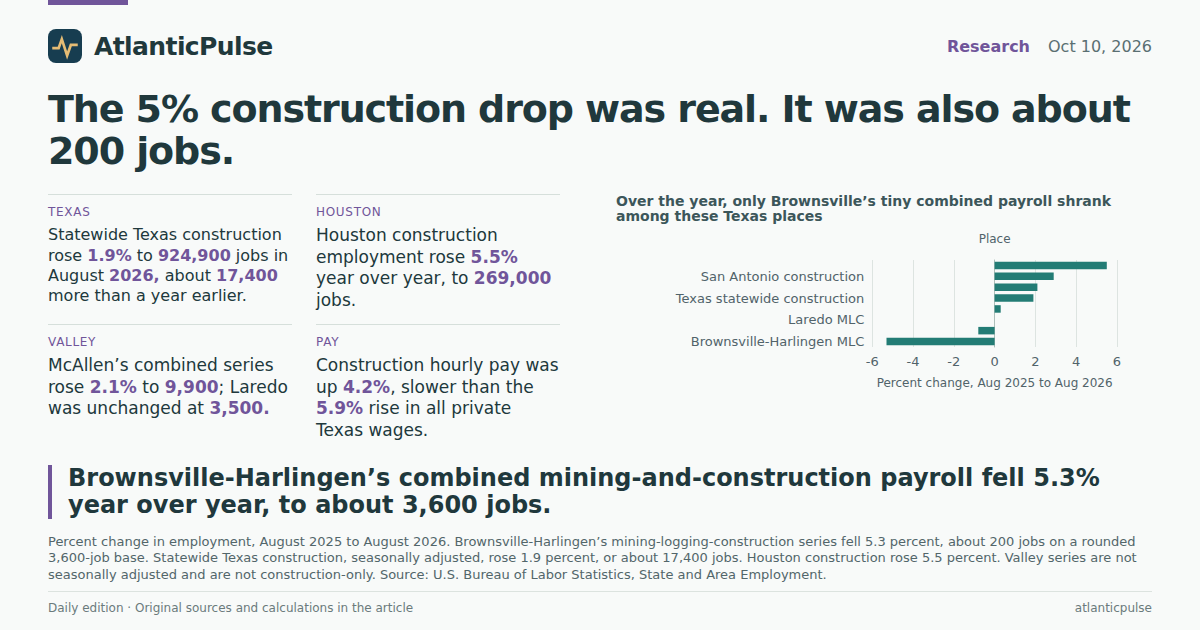
The Bureau of Labor Statistics does not publish a construction-only payroll for Brownsville-Harlingen. What it does publish is a combined mining, logging and construction series, not seasonally adjusted, rounded to the nearest 100 jobs. In August 2026 that series stood at 3,600 jobs, down from 3,800 in August 2025 — a 5.3 percent decline, or about 200 jobs. That is the same direction and roughly the same magnitude as the figure in the reporting. It is also a series that peaked at 4,300 in March 2024 and has been drifting down since. Next door, McAllen-Edinburg-Mission’s same combined series rose 2.1 percent over the year, to 9,900. Laredo was unchanged at 3,500. The Valley did not move as one market.
Those Valley totals are small enough to lose in a Houston traffic jam. They are also the right place to start, because that is the geography the reporting named. Treat the Brownsville number as a local combined payroll, not as Texas construction, and not as proof that immigration enforcement caused the drop. The official books can tell you whether the jobs were already missing. They cannot tell you who left.
Brownsville’s combined mining-and-construction payroll slipped. McAllen’s did not.

View exact chart values
| month | brownsville | mcallen | laredo |
|---|---|---|---|
| 2019-01 | 2.9 | 7.7 | 3.3 |
| 2019-02 | 3 | 7.8 | 3.3 |
| 2019-03 | 3 | 7.9 | 3.4 |
| 2019-04 | 3 | 7.8 | 3.3 |
| 2019-05 | 3 | 7.8 | 3.4 |
| 2019-06 | 3.1 | 7.9 | 3.4 |
| 2019-07 | 3.2 | 8 | 3.4 |
| 2019-08 | 3.2 | 8 | 3.3 |
| 2019-09 | 3.2 | 7.9 | 3.2 |
| 2019-10 | 3.3 | 8 | 3.2 |
| 2019-11 | 3.4 | 7.9 | 3.2 |
| 2019-12 | 3.4 | 7.8 | 3.2 |
| 2020-01 | 3.4 | 7.8 | 3.4 |
| 2020-02 | 3.4 | 7.8 | 3.3 |
| 2020-03 | 3.4 | 7.8 | 3.2 |
| 2020-04 | 3.2 | 7.3 | 3 |
| 2020-05 | 3.4 | 7.5 | 3 |
| 2020-06 | 3.4 | 7.6 | 2.9 |
| 2020-07 | 3.3 | 7.5 | 2.8 |
| 2020-08 | 3.4 | 7.4 | 2.8 |
| 2020-09 | 3.5 | 7.4 | 2.8 |
| 2020-10 | 3.5 | 7.7 | 2.8 |
| 2020-11 | 3.6 | 8 | 2.8 |
| 2020-12 | 3.6 | 8 | 2.8 |
| 2021-01 | 3.5 | 8 | 2.8 |
| 2021-02 | 3.5 | 8 | 2.8 |
| 2021-03 | 3.5 | 8.2 | 2.9 |
| 2021-04 | 3.4 | 8 | 2.8 |
| 2021-05 | 3.4 | 8 | 2.8 |
| 2021-06 | 3.5 | 8.1 | 2.9 |
| 2021-07 | 3.5 | 8.2 | 3 |
| 2021-08 | 3.5 | 8.3 | 3 |
| 2021-09 | 3.5 | 8.4 | 3 |
| 2021-10 | 3.5 | 8.2 | 2.8 |
| 2021-11 | 3.5 | 8.3 | 2.8 |
| 2021-12 | 3.5 | 8.3 | 2.9 |
| 2022-01 | 3.4 | 8.2 | 3 |
| 2022-02 | 3.5 | 8.3 | 3 |
| 2022-03 | 3.5 | 8.4 | 3 |
| 2022-04 | 3.5 | 8.5 | 3 |
| 2022-05 | 3.5 | 8.6 | 3.1 |
| 2022-06 | 3.5 | 8.7 | 3.2 |
| 2022-07 | 3.6 | 8.7 | 3.2 |
| 2022-08 | 3.5 | 8.8 | 3.2 |
| 2022-09 | 3.6 | 8.9 | 3.3 |
| 2022-10 | 3.7 | 9 | 3.2 |
| 2022-11 | 3.7 | 9 | 3.1 |
| 2022-12 | 3.7 | 9 | 3.2 |
| 2023-01 | 3.8 | 8.9 | 3.1 |
| 2023-02 | 3.8 | 8.9 | 3.1 |
| 2023-03 | 3.8 | 8.9 | 3.2 |
| 2023-04 | 3.8 | 9 | 3.1 |
| 2023-05 | 3.8 | 9 | 3.1 |
| 2023-06 | 4 | 9.2 | 3.1 |
| 2023-07 | 4 | 9 | 3.1 |
| 2023-08 | 4 | 9 | 3.1 |
| 2023-09 | 4 | 9.1 | 3.1 |
| 2023-10 | 4.1 | 9.1 | 3.1 |
| 2023-11 | 4.1 | 9.1 | 3.1 |
| 2023-12 | 4.2 | 9.1 | 3.1 |
| 2024-01 | 4 | 9.2 | 3.1 |
| 2024-02 | 4.1 | 9.2 | 3.1 |
| 2024-03 | 4.3 | 9.2 | 3.1 |
| 2024-04 | 4.2 | 9.3 | 3.2 |
| 2024-05 | 4.2 | 9.3 | 3.2 |
| 2024-06 | 4.2 | 9.3 | 3.3 |
| 2024-07 | 4.1 | 9.3 | 3.3 |
| 2024-08 | 4 | 9.4 | 3.3 |
| 2024-09 | 4 | 9.4 | 3.3 |
| 2024-10 | 4 | 9.6 | 3.3 |
| 2024-11 | 3.9 | 9.7 | 3.3 |
| 2024-12 | 3.8 | 9.7 | 3.4 |
| 2025-01 | 3.9 | 9.6 | 3.3 |
| 2025-02 | 3.8 | 9.6 | 3.4 |
| 2025-03 | 3.8 | 9.6 | 3.4 |
| 2025-04 | 3.8 | 9.6 | 3.5 |
| 2025-05 | 3.8 | 9.6 | 3.6 |
| 2025-06 | 3.9 | 9.6 | 3.5 |
| 2025-07 | 3.8 | 9.7 | 3.5 |
| 2025-08 | 3.8 | 9.7 | 3.5 |
| 2025-09 | 3.7 | 9.6 | 3.5 |
| 2025-10 | 3.7 | 9.7 | 3.5 |
| 2025-11 | 3.6 | 9.7 | 3.5 |
| 2025-12 | 3.6 | 9.6 | 3.5 |
| 2026-01 | 3.6 | 9.7 | 3.5 |
| 2026-02 | 3.6 | 9.7 | 3.5 |
| 2026-03 | 3.6 | 9.7 | 3.5 |
| 2026-04 | 3.6 | 9.7 | 3.5 |
| 2026-05 | 3.6 | 9.8 | 3.5 |
| 2026-06 | 3.6 | 9.9 | 3.5 |
| 2026-07 | 3.6 | 9.9 | 3.5 |
| 2026-08 | 3.6 | 9.9 | 3.5 |
The rest of Texas did not follow Brownsville down
Statewide, seasonally adjusted construction employment in Texas was 924,900 in August 2026, according to the State and Area Employment files. That was up 1.9 percent from 907,500 a year earlier — about 17,400 jobs — and up 4.5 percent from January 2025. Construction was 6.4 percent of Texas’s 14.5 million nonfarm jobs, a hair above its 6.3 percent share a year earlier. The state’s overall payroll rose 1.1 percent over the year, so construction was still adding jobs a bit faster than the rest of the Texas job market, not shrinking into it.
The metros that actually employ Texas construction workers tell the same story. Houston construction employment, not seasonally adjusted, rose 5.5 percent year over year, to 269,000 in August 2026. San Antonio-New Braunfels rose 2.9 percent, to 71,600. Put those next to Brownsville’s 3,600 combined jobs and the scale problem becomes obvious: Houston added about 14,100 construction jobs over the year, which is several times the entire Brownsville mining-logging-construction payroll. A 5 percent drop in Cameron County is real for the crews who lived it. It is not the Texas construction market.
California and Florida are useful only as a check on whether large Sun Belt construction payrolls were already rolling over. California’s seasonally adjusted construction employment fell 0.8 percent over the year, to 886,200. Florida rose 0.3 percent, to 656,700. Texas, at 924,900, now has the larger construction payroll of the three. That comparison is not a substitute for the Valley numbers. It is a reminder that a border-metro decline can coexist with a state that is still pouring slabs.
Over the year, only Brownsville’s tiny combined payroll shrank among these Texas places

View exact chart values
| place | aug2026_thousands | aug2025_thousands | yoy_pct | yoy_jobs | series_note |
|---|---|---|---|---|---|
| Brownsville-Harlingen MLC | 3.6 | 3.8 | -5.3 | -200 | NSA mining, logging and construction; rounded to 0.1 thousand |
| California construction | 886.2 | 893.1 | -0.8 | -6900 | SA construction |
| Laredo MLC | 3.5 | 3.5 | 0 | 0 | NSA mining, logging and construction |
| Florida construction | 656.7 | 654.6 | 0.3 | 2100 | SA construction |
| Texas statewide construction | 924.9 | 907.5 | 1.9 | 17400 | SA construction |
| McAllen-Edinburg-Mission MLC | 9.9 | 9.7 | 2.1 | 200 | NSA mining, logging and construction |
| San Antonio construction | 71.6 | 69.6 | 2.9 | 2000 | NSA construction |
| Houston construction | 269 | 254.9 | 5.5 | 14100 | NSA construction |
The Valley payrolls are small. Houston is where Texas construction actually sits.

View exact chart values
| place | yoy_pct | aug2026_thousands |
|---|---|---|
| Brownsville-Harlingen MLC | -5.3 | 3.6 |
| McAllen-Edinburg-Mission MLC | 2.1 | 9.9 |
| Laredo MLC | 0 | 3.5 |
| Houston construction | 5.5 | 269 |
| San Antonio construction | 2.9 | 71.6 |
| Texas statewide construction | 1.9 | 924.9 |
| California construction | -0.8 | 886.2 |
| Florida construction | 0.3 | 656.7 |
This is not a missing-workforce mystery on the statewide books
Index the three states to August 2019, before the pandemic scramble, and Texas construction looks like a boom that never fully gave the jobs back. By August 2026 the Texas series was 18.7 percent above that benchmark. Florida was 15.5 percent above. California was 0.8 percent below. Texas construction did sag in 2020, as every building trade did, then climbed through 2023, 2024 and into 2026. The latest reading, 924,900, is not a freeze-frame of a labor shortage so acute that the payroll shrank. It is a freeze-frame of a large industry that was still hiring, at least through August.
Brownsville’s broader job market was weaker than the state’s. Seasonally adjusted total nonfarm employment there fell 0.5 percent year over year in August 2026, to 159,700. McAllen’s total nonfarm payroll rose 1.0 percent, to 311,000. Even inside the Valley, then, the construction-adjacent series and the overall job count do not tell one story. McAllen kept adding both combined mining-and-construction jobs and total jobs. Brownsville lost a little of each. If the mechanism in the reporting is ICE intercepting workers on the way to job sites, it is not showing up as a uniform Valley collapse on the monthly payroll.
Texas construction payrolls kept climbing after 2019. California’s did not.

View exact chart values
| month | tx_thousands | ca_thousands | fl_thousands | tx_index | ca_index | fl_index |
|---|---|---|---|---|---|---|
| 2019-01 | 761.7 | 877.9 | 557.7 | 97.8 | 98.2 | 98 |
| 2019-02 | 765.6 | 870.1 | 557.9 | 98.3 | 97.4 | 98.1 |
| 2019-03 | 766.2 | 876.5 | 559.5 | 98.3 | 98.1 | 98.4 |
| 2019-04 | 769.8 | 879.6 | 560.3 | 98.8 | 98.4 | 98.5 |
| 2019-05 | 771 | 883.9 | 562.1 | 99 | 98.9 | 98.8 |
| 2019-06 | 773.6 | 888.6 | 564 | 99.3 | 99.4 | 99.2 |
| 2019-07 | 776.7 | 890.4 | 566.1 | 99.7 | 99.6 | 99.5 |
| 2019-08 | 779.1 | 893.6 | 568.8 | 100 | 100 | 100 |
| 2019-09 | 783.4 | 896.9 | 570.3 | 100.6 | 100.4 | 100.3 |
| 2019-10 | 782.1 | 893.6 | 570.9 | 100.4 | 100 | 100.4 |
| 2019-11 | 783.1 | 901.3 | 574.8 | 100.5 | 100.9 | 101.1 |
| 2019-12 | 781.5 | 896.2 | 573.3 | 100.3 | 100.3 | 100.8 |
| 2020-01 | 780.6 | 904.1 | 573.4 | 100.2 | 101.2 | 100.8 |
| 2020-02 | 779.4 | 909.8 | 574 | 100 | 101.8 | 100.9 |
| 2020-03 | 779.4 | 893.8 | 572.6 | 100 | 100 | 100.7 |
| 2020-04 | 722.1 | 744.2 | 536.7 | 92.7 | 83.3 | 94.4 |
| 2020-05 | 730.4 | 828.7 | 558.9 | 93.7 | 92.7 | 98.3 |
| 2020-06 | 730.4 | 851.1 | 566.8 | 93.7 | 95.2 | 99.6 |
| 2020-07 | 720.2 | 842.2 | 560.2 | 92.4 | 94.2 | 98.5 |
| 2020-08 | 720.9 | 849.5 | 564.9 | 92.5 | 95.1 | 99.3 |
| 2020-09 | 718.2 | 851.9 | 563.2 | 92.2 | 95.3 | 99 |
| 2020-10 | 719.9 | 865 | 564.4 | 92.4 | 96.8 | 99.2 |
| 2020-11 | 722.7 | 868 | 566.6 | 92.8 | 97.1 | 99.6 |
| 2020-12 | 722 | 873.6 | 568.9 | 92.7 | 97.8 | 100 |
| 2021-01 | 723.5 | 874.9 | 570.4 | 92.9 | 97.9 | 100.3 |
| 2021-02 | 712.9 | 877.9 | 571.3 | 91.5 | 98.2 | 100.4 |
| 2021-03 | 732.4 | 885.1 | 577.7 | 94 | 99 | 101.6 |
| 2021-04 | 733.1 | 886.3 | 573.8 | 94.1 | 99.2 | 100.9 |
| 2021-05 | 730.9 | 883.1 | 575.3 | 93.8 | 98.8 | 101.1 |
| 2021-06 | 732.4 | 878.4 | 575.6 | 94 | 98.3 | 101.2 |
| 2021-07 | 739.4 | 883.2 | 576.7 | 94.9 | 98.8 | 101.4 |
| 2021-08 | 739.2 | 881.8 | 577.8 | 94.9 | 98.7 | 101.6 |
| 2021-09 | 741.8 | 878.1 | 578.9 | 95.2 | 98.3 | 101.8 |
| 2021-10 | 751.2 | 888.9 | 582.8 | 96.4 | 99.5 | 102.5 |
| 2021-11 | 755 | 894.5 | 585.6 | 96.9 | 100.1 | 103 |
| 2021-12 | 759.7 | 894.1 | 585.7 | 97.5 | 100.1 | 103 |
| 2022-01 | 760.4 | 897.7 | 587.4 | 97.6 | 100.5 | 103.3 |
| 2022-02 | 764.3 | 912.2 | 590.5 | 98.1 | 102.1 | 103.8 |
| 2022-03 | 766.2 | 922.5 | 592.7 | 98.3 | 103.2 | 104.2 |
| 2022-04 | 773.4 | 914.8 | 595.1 | 99.3 | 102.4 | 104.6 |
| 2022-05 | 777.9 | 914.8 | 598.3 | 99.8 | 102.4 | 105.2 |
| 2022-06 | 781.7 | 916.4 | 601.3 | 100.3 | 102.6 | 105.7 |
| 2022-07 | 789.2 | 915.9 | 605.9 | 101.3 | 102.5 | 106.5 |
| 2022-08 | 791.7 | 915.3 | 606.8 | 101.6 | 102.4 | 106.7 |
| 2022-09 | 796.9 | 919.1 | 609.1 | 102.3 | 102.9 | 107.1 |
| 2022-10 | 796.9 | 912.5 | 610.7 | 102.3 | 102.1 | 107.4 |
| 2022-11 | 799.2 | 903.3 | 613.1 | 102.6 | 101.1 | 107.8 |
| 2022-12 | 802.5 | 909 | 616.6 | 103 | 101.7 | 108.4 |
| 2023-01 | 812.3 | 882.6 | 619.2 | 104.3 | 98.8 | 108.9 |
| 2023-02 | 809.9 | 910.1 | 620.6 | 104 | 101.8 | 109.1 |
| 2023-03 | 814.1 | 902.5 | 622.9 | 104.5 | 101 | 109.5 |
| 2023-04 | 814.4 | 904.9 | 625.8 | 104.5 | 101.3 | 110 |
| 2023-05 | 817.6 | 910.4 | 627.4 | 104.9 | 101.9 | 110.3 |
| 2023-06 | 824.4 | 916.1 | 629.4 | 105.8 | 102.5 | 110.7 |
| 2023-07 | 824.5 | 915 | 630.1 | 105.8 | 102.4 | 110.8 |
| 2023-08 | 826.2 | 919.7 | 633.2 | 106 | 102.9 | 111.3 |
| 2023-09 | 833.5 | 923.6 | 635.5 | 107 | 103.4 | 111.7 |
| 2023-10 | 832 | 920.7 | 639.7 | 106.8 | 103 | 112.5 |
| 2023-11 | 833.2 | 918.3 | 639.9 | 106.9 | 102.8 | 112.5 |
| 2023-12 | 838.5 | 923.2 | 641.7 | 107.6 | 103.3 | 112.8 |
| 2024-01 | 841.6 | 929.4 | 642.6 | 108 | 104 | 113 |
| 2024-02 | 845.4 | 912.7 | 644.5 | 108.5 | 102.1 | 113.3 |
| 2024-03 | 848 | 919.3 | 645.8 | 108.8 | 102.9 | 113.5 |
| 2024-04 | 846.8 | 914.4 | 648.2 | 108.7 | 102.3 | 114 |
| 2024-05 | 851.3 | 913.1 | 650.7 | 109.3 | 102.2 | 114.4 |
| 2024-06 | 854.1 | 913.7 | 652.7 | 109.6 | 102.2 | 114.8 |
| 2024-07 | 853.1 | 917.1 | 655.5 | 109.5 | 102.6 | 115.2 |
| 2024-08 | 865.6 | 913 | 656.8 | 111.1 | 102.2 | 115.5 |
| 2024-09 | 870.3 | 910.2 | 657.4 | 111.7 | 101.9 | 115.6 |
| 2024-10 | 875.6 | 910.9 | 642.5 | 112.4 | 101.9 | 113 |
| 2024-11 | 881.3 | 909 | 658 | 113.1 | 101.7 | 115.7 |
| 2024-12 | 882.6 | 904.4 | 657.4 | 113.3 | 101.2 | 115.6 |
| 2025-01 | 885.1 | 902.3 | 656.5 | 113.6 | 101 | 115.4 |
| 2025-02 | 888.9 | 894.8 | 657.9 | 114.1 | 100.1 | 115.7 |
| 2025-03 | 892.8 | 896 | 660.2 | 114.6 | 100.3 | 116.1 |
| 2025-04 | 898.3 | 901.7 | 659.1 | 115.3 | 100.9 | 115.9 |
| 2025-05 | 902 | 901 | 658.8 | 115.8 | 100.8 | 115.8 |
| 2025-06 | 902.5 | 896.6 | 658 | 115.8 | 100.3 | 115.7 |
| 2025-07 | 904.2 | 894.1 | 655.7 | 116.1 | 100.1 | 115.3 |
| 2025-08 | 907.5 | 893.1 | 654.6 | 116.5 | 99.9 | 115.1 |
| 2025-09 | 906.6 | 888.6 | 653.7 | 116.4 | 99.4 | 114.9 |
| 2025-10 | 903.6 | 880.8 | 650.3 | 116 | 98.6 | 114.3 |
| 2025-11 | 905.5 | 885.9 | 648.6 | 116.2 | 99.1 | 114 |
| 2025-12 | 903.4 | 880.8 | 647.2 | 116 | 98.6 | 113.8 |
| 2026-01 | 913.9 | 885.4 | 647.7 | 117.3 | 99.1 | 113.9 |
| 2026-02 | 912.8 | 884.6 | 648.9 | 117.2 | 99 | 114.1 |
| 2026-03 | 913.5 | 887.9 | 651.8 | 117.3 | 99.4 | 114.6 |
| 2026-04 | 917.1 | 888 | 656.9 | 117.7 | 99.4 | 115.5 |
| 2026-05 | 922.1 | 885.3 | 655.7 | 118.4 | 99.1 | 115.3 |
| 2026-06 | 925.1 | 884.5 | 655.5 | 118.7 | 99 | 115.2 |
| 2026-07 | 923.3 | 886.8 | 656.8 | 118.5 | 99.2 | 115.5 |
| 2026-08 | 924.9 | 886.2 | 656.7 | 118.7 | 99.2 | 115.5 |
A shortage that raised construction pay faster than everyone else is not what the averages show
If South Texas were so short of crews that projects sat idle, the textbook next sentence is that remaining workers got paid more. Statewide, Texas construction average hourly earnings, not seasonally adjusted, were $37.66 in August 2026, up 4.2 percent from $36.15 a year earlier. That is a raise. It is not a scare-premium. Over the same year, average hourly earnings for all private employees in Texas rose 5.9 percent, to $36.37. Construction still paid more than the private average, but the gap narrowed from $1.81 an hour in August 2025 to $1.29 in August 2026.
None of that measures what a framer in Harlingen actually took home, and none of it is adjusted for inflation. It does mean the statewide construction wage series is not screaming “nobody left to hire.” Pay rose. The rest of private Texas rose faster. The BLS does not publish a construction wage series for Brownsville-Harlingen, so the Valley’s 5 percent job drop cannot be paired with a local wage spike or the lack of one. The honest limit is the geography of the files: statewide pay, metro jobs, and a combined supersector on the border.
Texas construction pay rose. The rest of private Texas rose faster.

View exact chart values
| month | construction_ahe | private_ahe | premium |
|---|---|---|---|
| 2019-01 | 28.11 | 26.33 | 1.78 |
| 2019-02 | 28.21 | 26.29 | 1.92 |
| 2019-03 | 28.39 | 26.09 | 2.3 |
| 2019-04 | 28.23 | 26.07 | 2.16 |
| 2019-05 | 28.24 | 26.08 | 2.16 |
| 2019-06 | 27.8 | 26.07 | 1.73 |
| 2019-07 | 27.65 | 25.92 | 1.73 |
| 2019-08 | 27.87 | 25.96 | 1.91 |
| 2019-09 | 28.22 | 26.31 | 1.91 |
| 2019-10 | 28.44 | 26.21 | 2.23 |
| 2019-11 | 28.3 | 26.44 | 1.86 |
| 2019-12 | 28.66 | 26.82 | 1.84 |
| 2020-01 | 28.32 | 26.7 | 1.62 |
| 2020-02 | 28.37 | 26.94 | 1.43 |
| 2020-03 | 28.41 | 26.88 | 1.53 |
| 2020-04 | 28.36 | 27.44 | 0.92 |
| 2020-05 | 28.22 | 26.91 | 1.31 |
| 2020-06 | 28.18 | 26.62 | 1.56 |
| 2020-07 | 28.1 | 26.92 | 1.18 |
| 2020-08 | 28.15 | 27.16 | 0.99 |
| 2020-09 | 28.44 | 26.85 | 1.59 |
| 2020-10 | 27.86 | 27.05 | 0.81 |
| 2020-11 | 27.83 | 27.49 | 0.34 |
| 2020-12 | 27.77 | 27.38 | 0.39 |
| 2021-01 | 27.45 | 27.52 | -0.07 |
| 2021-02 | 27.79 | 28.03 | -0.24 |
| 2021-03 | 27.7 | 27.7 | 0 |
| 2021-04 | 27.88 | 27.94 | -0.06 |
| 2021-05 | 28.04 | 28.53 | -0.49 |
| 2021-06 | 27.97 | 28.29 | -0.32 |
| 2021-07 | 28.25 | 28.54 | -0.29 |
| 2021-08 | 27.85 | 29.22 | -1.37 |
| 2021-09 | 28.09 | 28.94 | -0.85 |
| 2021-10 | 28.18 | 29.2 | -1.02 |
| 2021-11 | 28.17 | 29.29 | -1.12 |
| 2021-12 | 28.37 | 29.15 | -0.78 |
| 2022-01 | 28.64 | 30.11 | -1.47 |
| 2022-02 | 28.44 | 29.36 | -0.92 |
| 2022-03 | 28.58 | 29.37 | -0.79 |
| 2022-04 | 29.06 | 29.7 | -0.64 |
| 2022-05 | 29.16 | 30.02 | -0.86 |
| 2022-06 | 29.34 | 29.59 | -0.25 |
| 2022-07 | 29.87 | 29.8 | 0.07 |
| 2022-08 | 29.52 | 30.01 | -0.49 |
| 2022-09 | 30.06 | 29.97 | 0.09 |
| 2022-10 | 30.95 | 30.56 | 0.39 |
| 2022-11 | 31.11 | 30.44 | 0.67 |
| 2022-12 | 30.96 | 30.53 | 0.43 |
| 2023-01 | 31.42 | 31.36 | 0.06 |
| 2023-02 | 31.75 | 31.19 | 0.56 |
| 2023-03 | 31.69 | 31.15 | 0.54 |
| 2023-04 | 32.03 | 31.26 | 0.77 |
| 2023-05 | 32.18 | 31.01 | 1.17 |
| 2023-06 | 32.22 | 31.06 | 1.16 |
| 2023-07 | 32.87 | 31.73 | 1.14 |
| 2023-08 | 32.89 | 31.61 | 1.28 |
| 2023-09 | 33.33 | 31.94 | 1.39 |
| 2023-10 | 33.64 | 32.1 | 1.54 |
| 2023-11 | 33.48 | 31.84 | 1.64 |
| 2023-12 | 33.86 | 32.23 | 1.63 |
| 2024-01 | 34.16 | 32.88 | 1.28 |
| 2024-02 | 33.84 | 32.64 | 1.2 |
| 2024-03 | 33.68 | 32.61 | 1.07 |
| 2024-04 | 34 | 32.67 | 1.33 |
| 2024-05 | 34.07 | 32.6 | 1.47 |
| 2024-06 | 34.04 | 32.85 | 1.19 |
| 2024-07 | 34.89 | 32.95 | 1.94 |
| 2024-08 | 34.27 | 33.26 | 1.01 |
| 2024-09 | 35.15 | 33.4 | 1.75 |
| 2024-10 | 34.87 | 33.38 | 1.49 |
| 2024-11 | 35.59 | 33.48 | 2.11 |
| 2024-12 | 35.99 | 34.16 | 1.83 |
| 2025-01 | 36.35 | 34.29 | 2.06 |
| 2025-02 | 36.95 | 34.62 | 2.33 |
| 2025-03 | 36.75 | 34.51 | 2.24 |
| 2025-04 | 36.63 | 34.22 | 2.41 |
| 2025-05 | 36.2 | 34.08 | 2.12 |
| 2025-06 | 36.64 | 34.59 | 2.05 |
| 2025-07 | 36.23 | 34.14 | 2.09 |
| 2025-08 | 36.15 | 34.34 | 1.81 |
| 2025-09 | 36.89 | 34.76 | 2.13 |
| 2025-10 | 36.91 | 34.77 | 2.14 |
| 2025-11 | 37.14 | 35.12 | 2.02 |
| 2025-12 | 36.99 | 35.27 | 1.72 |
| 2026-01 | 36.6 | 35.49 | 1.11 |
| 2026-02 | 37.29 | 35.31 | 1.98 |
| 2026-03 | 37.15 | 35.03 | 2.12 |
| 2026-04 | 37.11 | 35.19 | 1.92 |
| 2026-05 | 36.99 | 35.16 | 1.83 |
| 2026-06 | 37.07 | 35.6 | 1.47 |
| 2026-07 | 37.37 | 36.06 | 1.31 |
| 2026-08 | 37.66 | 36.37 | 1.29 |
What the official books can and cannot do
The reporting from South Texas is about raids, vans, and crews that do not come back. The payroll files are about monthly estimates, rounded to the nearest hundred in the smallest metros, with mining and logging glued onto construction because the samples are too thin to split. Those are different instruments. Used together, they say something useful and bounded: the 5 percent Brownsville decline is visible in the official combined series; it is on the order of 200 jobs; McAllen did not echo it; Houston construction grew; statewide Texas construction added about 17,400 jobs over the year and is still larger than it was in 2019; and construction pay did not outrun the rest of private Texas.
That is not a verdict on immigration policy, and it is not a claim that builders in the Valley are inventing their delays. A metro can lose a few hundred combined jobs and still have every remaining contractor short-handed. It is a warning against scaling a Cameron County percentage into a Texas construction crash. The crash, as of August 2026, is not in the statewide payroll. The 5 percent is.
Sources and methods
Payroll figures come from the U.S. Bureau of Labor Statistics State and Area Employment snapshot labeled bls-sm-snapshot-2026-08-24, with monthly observations through August 2026. These are not current-day counts; the files lag the mid-October news cycle, which is normal for this vintage.
Statewide Texas, California and Florida construction and Texas total nonfarm series are seasonally adjusted. Metro construction and Valley mining-logging-construction series are not seasonally adjusted. Year-over-year comparisons for those metros use August versus August to limit seasonal noise. Do not mix the two adjustments as if they were the same series.
Brownsville-Harlingen, McAllen-Edinburg-Mission and Laredo do not have construction-only employment series in this snapshot. The published supersector combines mining, logging and construction. Calling that series “construction jobs” overstates precision. Brownsville values are published to 0.1 thousand, about 100 jobs.
Average hourly earnings are for all employees, not seasonally adjusted, in current dollars. They are statewide means, not Valley construction wages, and they are not inflation-adjusted.
Null observations were not treated as zero. Duplicate annual twins of monthly series were skipped when a monthly extract returned no rows. No regression or other causal test of ICE activity is possible in these files; descriptive comparisons are not effects.
Research completed 2026-10-11, for the October 10, 2026 news edition. The available source data may cover earlier periods; see the observation periods and source vintages above.