Research
The $270 billion insurance bill behind 750,000 cancelled plans
A cancellation measured in hundreds of thousands
Vice President JD Vance and CMS Administrator Mehmet Oz said this week that roughly 750,000 Affordable Care Act enrollees had coverage cancelled, that many were “phantoms,” and that the cuts would save taxpayers $2.2 billion. They put another 419,000 people under review. Health-policy researchers, including KFF’s Cynthia Cox, noted that some of those people may simply not have answered the mail. The administration’s number is a count of cancelled plans, not a BEA consumption figure and not a headcount of insurance-company staff.
What the official books can answer is a different question, and it is the one that matters for scale. How large is the household health-insurance bill the United States already records, how has that bill moved since the ACA’s coverage expansion, and has the industry that writes the policies been hiring or shrinking as Washington now takes people off the rolls?
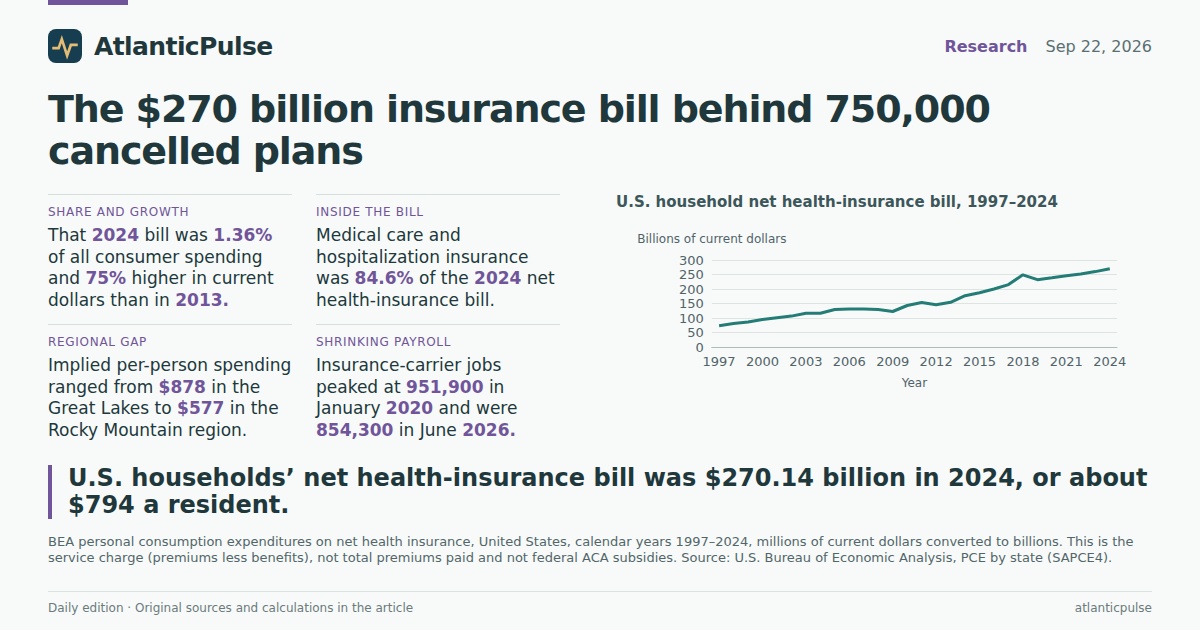
U.S. household net health-insurance bill, 1997–2024

View exact chart values
| year | insurance_billions | med_hosp_billions | pce_trillions | share_of_pce_pct | per_capita_dollars |
|---|---|---|---|---|---|
| 1997 | 73.54 | 56.16 | 5.537 | 1.33 | 270 |
| 1998 | 80.76 | 63.45 | 5.877 | 1.37 | 293 |
| 1999 | 85.73 | 68.61 | 6.284 | 1.36 | 307 |
| 2000 | 94.38 | 75.53 | 6.767 | 1.39 | 334 |
| 2001 | 101.09 | 80.7 | 7.074 | 1.43 | 355 |
| 2002 | 106.53 | 86.49 | 7.349 | 1.45 | 370 |
| 2003 | 116.65 | 97.74 | 7.741 | 1.51 | 402 |
| 2004 | 116.55 | 97.5 | 8.232 | 1.42 | 398 |
| 2005 | 129.36 | 106.89 | 8.769 | 1.48 | 438 |
| 2006 | 130.65 | 106.23 | 9.277 | 1.41 | 438 |
| 2007 | 131.26 | 105.04 | 9.747 | 1.35 | 436 |
| 2008 | 129.05 | 102.95 | 10.05 | 1.28 | 424 |
| 2009 | 122.44 | 98.69 | 9.891 | 1.24 | 399 |
| 2010 | 143.02 | 117.7 | 10.26 | 1.39 | 462 |
| 2011 | 153.3 | 127.24 | 10.699 | 1.43 | 492 |
| 2012 | 145.83 | 119.11 | 11.047 | 1.32 | 464 |
| 2013 | 154.09 | 125.42 | 11.388 | 1.35 | 487 |
| 2014 | 177.04 | 145.63 | 11.874 | 1.49 | 555 |
| 2015 | 187.12 | 151.67 | 12.297 | 1.52 | 581 |
| 2016 | 200.15 | 164.31 | 12.727 | 1.57 | 617 |
| 2017 | 215.19 | 176.5 | 13.291 | 1.62 | 659 |
| 2018 | 248.93 | 207.32 | 13.934 | 1.79 | 758 |
| 2019 | 231.99 | 189.15 | 14.438 | 1.61 | 703 |
| 2020 | 238.73 | 198.45 | 14.231 | 1.68 | 720 |
| 2021 | 245.59 | 215.88 | 16.12 | 1.52 | 740 |
| 2022 | 251.93 | 210.79 | 17.69 | 1.42 | 754 |
| 2023 | 259.91 | 216.36 | 18.833 | 1.38 | 772 |
| 2024 | 270.14 | 228.63 | 19.896 | 1.36 | 794 |
A $270 billion service charge, not a premium total
In 2024, the last full year in the Bureau of Economic Analysis state consumption accounts, U.S. households consumed $270.14 billion of net health insurance. That is 1.36 percent of a $19.90 trillion personal-consumption bill, or about $794 per U.S. resident if the insurance line is spread across the whole population in proportion to total spending. Those dollars are current, not inflation-adjusted, and they are not a survey of what any one household paid.
Net health insurance is a service charge: premiums less benefits. It is not total premiums, not federal ACA subsidies, and not the $2.2 billion Vance and Oz attached to this week’s cancellations. Those are different ledgers. The comparison that is fair is simpler. The last official household insurance bill is more than a hundred times larger than the savings figure the White House put on the 750,000 cancelled plans, and it is a different kind of number. Treating one as a rebuttal of the other would be a category error. Treating $270 billion as “the typical premium” would be another.
What sits inside that bill
Almost all of the 2024 net bill is medical care and hospitalization insurance: $228.63 billion, or 84.6 percent. Workers’ compensation accounts for $36.31 billion (13.4 percent). Income-loss insurance is $5.19 billion (1.9 percent). The three components sum to the parent line within $0.1 million — rounding, not a missing bucket.
That mix matters for this week’s story. The cancelled ACA plans sit in the medical-care slice, not in workers’ compensation. Even that slice, $229 billion in 2024, is a net service charge across every kind of medical insurance households consume, public and private, not a census of marketplace enrollments. The ACA is inside the line. It is not the whole line.
What was inside the 2024 net health-insurance bill

View exact chart values
| category | billions | share_of_net_pct |
|---|---|---|
| Medical care and hospitalization | 228.63 | 84.6 |
| Workers compensation | 36.31 | 13.4 |
| Income loss | 5.19 | 1.9 |
After 2013, the bill kept climbing
In 2013, the year before the ACA’s major coverage expansion, net health insurance was $154.09 billion. By 2024 it was 75 percent higher in current dollars. From 1997, when the series opens at $73.54 billion, the increase is 267 percent. Indexed to 2013, the bill reaches 175 in 2024. A spike in 2018 to $248.93 billion, then a step down in 2019, is in the annual file; the series does not explain it, and this article does not invent a cause.
Share of all consumer spending has not marched upward in a straight line. Net health insurance was 1.35 percent of PCE in 2013, peaked at 1.79 percent in 2018, and was 1.36 percent in 2024 — almost the same share as eleven years earlier, on a much larger spending base. Per-resident implied dollars rose from $487 in 2013 to $794 in 2024. Prices, enrollment, and the mix of plans all move that figure. The accounts do not separate them.
None of this reaches 2026. The BEA file ends with calendar 2024. This week’s cancellations, and whatever they do to 2026 premiums or federal outlays, are not in the table yet.
Net health insurance after the ACA era, indexed to 2013

View exact chart values
| year | index_2013 |
|---|---|
| 2013 | 100 |
| 2014 | 114.9 |
| 2015 | 121.4 |
| 2016 | 129.9 |
| 2017 | 139.7 |
| 2018 | 161.5 |
| 2019 | 150.6 |
| 2020 | 154.9 |
| 2021 | 159.4 |
| 2022 | 163.5 |
| 2023 | 168.7 |
| 2024 | 175.3 |
The bill is heavier in the Great Lakes than in the Rockies
Spread across BEA regions, the 2024 implied bill per resident is not uniform. The Great Lakes sit at $878, New England at $863, the Southeast at $842. The Rocky Mountain region is $577. The national implied figure is $794. As a share of regional consumer spending, the Great Lakes and Southeast are again at the top (1.59 and 1.54 percent); the Rocky Mountain region is 0.98 percent.
Those gaps are not proof that Midwesterners are overcharged or that mountain states have cheaper doctors. They mix prices, ages, coverage, and what else people buy. They do show that a national cancellation drive lands on regional insurance bills that already differ by several hundred dollars a person. The Southeast’s $75.18 billion regional total is the largest in raw dollars because the region is large, not because it is the most expensive per resident.
Implied per-person health-insurance bill by BEA region, 2024

View exact chart values
| region | insurance_billions | share_of_pce_pct | per_capita_dollars |
|---|---|---|---|
| Great Lakes | 41.83 | 1.59 | 878 |
| New England | 13.29 | 1.27 | 863 |
| Southeast | 75.18 | 1.54 | 842 |
| Far West | 46.32 | 1.24 | 811 |
| Southwest | 33.91 | 1.41 | 752 |
| Mideast | 36.94 | 1.15 | 732 |
| Plains | 15.07 | 1.26 | 686 |
| Rocky Mountain | 7.61 | 0.98 | 577 |
The carrier payroll peaked in 2020 and has been shrinking
The companies that write life, health and medical policies are not adding workers into this fight. The BLS payroll survey counts employees at direct life, health and medical insurance carriers. That series mixes life with health and medical; it is not a headcount of ACA marketplace staff. In January 1990 it stood at 712,100. It peaked at 951,900 in January 2020. By January 2025 it was 898,300. The last available month in this snapshot, June 2026, is 854,300 — 44,000 below January 2025 and 97,600 below the 2020 peak.
Hospital payrolls moved the other way. Private hospitals employed 5,770,400 people in July 2026, up from 5,586,500 in January 2025. The two series are not substitutes. One counts people who process coverage; the other counts people who deliver care. Together they underline a simple point. The 750,000 cancelled enrollments are a coverage story. They are not a hiring boom at insurers, and the official insurer payroll has been getting smaller for six years.
The payroll file is monthly and runs into mid-2026; the consumption file is annual and stops at 2024. The lag is ordinary, not a reconstruction. It does mean this article cannot say what the 2026 insurance bill will look like after the cancellations. It can say what the last complete official bill was, how it grew after 2013, and that the carrier workforce heading into the midterms is smaller than it was when the pandemic began.
Life, health and medical insurance-carrier jobs, 1990–2026

View exact chart values
| period | insurance_thousands |
|---|---|
| 1990-01 | 712.1 |
| 1991-01 | 759.6 |
| 1992-01 | 752.1 |
| 1993-01 | 773.6 |
| 1994-01 | 810.7 |
| 1995-01 | 815.4 |
| 1996-01 | 793 |
| 1997-01 | 791.6 |
| 1998-01 | 814.4 |
| 1999-01 | 818.8 |
| 2000-01 | 816.5 |
| 2001-01 | 812.4 |
| 2002-01 | 802.1 |
| 2003-01 | 792.9 |
| 2004-01 | 773.2 |
| 2005-01 | 757 |
| 2006-01 | 787.1 |
| 2007-01 | 783.6 |
| 2008-01 | 796.6 |
| 2009-01 | 798.6 |
| 2010-01 | 815.8 |
| 2011-01 | 782.2 |
| 2012-01 | 808.4 |
| 2013-01 | 808.2 |
| 2014-01 | 823.4 |
| 2015-01 | 836.6 |
| 2016-01 | 812.5 |
| 2017-01 | 839.8 |
| 2018-01 | 860.4 |
| 2019-01 | 911.3 |
| 2020-01 | 951.9 |
| 2021-01 | 925.6 |
| 2022-01 | 896.9 |
| 2023-01 | 908.4 |
| 2024-01 | 905.6 |
| 2025-01 | 898.3 |
| 2026-01 | 873.7 |
| 2026-06 | 854.3 |
Sources and methods
BEA personal consumption expenditures by state (SAPCE), release bea-sapce-2025-09-26, annual calendar years 1997–2024, current dollars. Net health insurance is function line 112 (premiums less benefits). Medical care and hospitalization, income loss, and workers’ compensation are its components and are not added to the parent. Per-person figures are implied: (net health insurance / total PCE) × per capita PCE. That is not a household premium and not an average paid by the insured.
BLS Current Employment Statistics, snapshot bls-ce-snapshot-2026-08-24. Insurance-carrier employment is CES5552411001, seasonally adjusted, thousands, direct life, health and medical insurance carriers; last observation in this extract is June 2026. Hospital employment is CES6562200001, seasonally adjusted; last observation July 2026. The insurance series mixes life with health and medical carriers.
Duplicate period keys: none observed; first observation would have been kept. Nulls were not treated as zero. The administration’s 750,000 cancelled enrollments and $2.2 billion savings figure are from 22 September 2026 reporting, not from BEA or BLS. They are not the same concept as net PCE. Observation periods are not release dates and are not current-day counts. Provider/refresh lag is normal.
Research completed 2026-09-23, for the September 22, 2026 news edition. The available source data may cover earlier periods; see the observation periods and source vintages above.