Research
The 22% airfare, next to a $194 billion flying bill
The last print, and the bill it lands on
The Labor Department’s September consumer-price report, the last major inflation print before November’s midterms, put two travel costs in the same sentence. Gasoline jumped 9.1% from August to September. Air fares were up 22% from a year earlier, and hotel prices rose too, according to the Associated Press. That is a very visible kind of inflation: it shows up at the pump on the way to the airport. It is not, however, a new bill. It is a surcharge on a bill that was already large.
The official household books run a year behind the CPI. In calendar 2025, the latest full year in the Bureau of Economic Analysis’s state personal-consumption accounts, Americans spent $20.87 trillion on goods and services. Of that, $419 billion went to gasoline and other energy goods — motor fuels plus fuel oils — and $194 billion went to air transportation. Hotels and other accommodations added another $202 billion. Flying was 0.93% of the household budget; gasoline and other energy goods were 2.01%. Combined, air travel and hotels were $396 billion, close to the energy-goods line. Those are current-dollar totals, not ticket prices, and they stop at 2025. They still tell you where a 22% airfare increase actually lands.
The airfare bill kept rising after the gasoline bill peaked

View exact chart values
| year | air_billions | gasoline_billions | hotels_billions |
|---|---|---|---|
| 2015 | 89.99 | 318.8 | 137.65 |
| 2016 | 89.63 | 287.01 | 141.53 |
| 2017 | 94.75 | 323.98 | 149.68 |
| 2018 | 104.26 | 366.68 | 156.81 |
| 2019 | 116.54 | 352.51 | 161.69 |
| 2020 | 48.53 | 258.46 | 87.93 |
| 2021 | 101.04 | 385.74 | 124.72 |
| 2022 | 153.03 | 514.6 | 173.15 |
| 2023 | 168.54 | 464.9 | 192.85 |
| 2024 | 189.13 | 441.62 | 197.53 |
| 2025 | 193.97 | 418.81 | 201.84 |
Flying grew. Gasoline’s share shrank.
Set 2019 to 100, before the pandemic emptied the planes. By 2025, household air-travel spending was at 166. Gasoline and other energy goods were at 119. Hotels were at 125. All household spending was at 145. In other words, Americans’ flying bill grew faster than their overall budget, and much faster than their gasoline bill, even though 2022 was a brutal year at the pump. Gasoline spending peaked at $515 billion that year and then fell for three straight years, to $419 billion in 2025. Air travel did the opposite: it collapsed to $49 billion in 2020, then kept climbing through 2025.
The mix of the household budget moved with those paths. Gasoline and other energy goods were 2.44% of spending in 2019 and 2.01% in 2025. Air travel went the other way, from 0.81% to 0.93%. From 2024 to 2025, the air-travel bill was still rising, by 2.6%, while the gasoline-and-energy-goods bill fell 5.2%. None of that means September 2026 gasoline is cheap. It means that when prices jump at the pump, they are jumping on a category that had been shrinking as a share of the budget, while air fares are jumping on a category that had already been taking more room.
Air-travel spending has outrun gasoline since 2019

View exact chart values
| year | air | gasoline | hotels | all_spending |
|---|---|---|---|---|
| 2015 | 77.2 | 90.4 | 85.1 | 85.2 |
| 2016 | 76.9 | 81.4 | 87.5 | 88.2 |
| 2017 | 81.3 | 91.9 | 92.6 | 92.1 |
| 2018 | 89.5 | 104 | 97 | 96.5 |
| 2019 | 100 | 100 | 100 | 100 |
| 2020 | 41.6 | 73.3 | 54.4 | 98.6 |
| 2021 | 86.7 | 109.4 | 77.1 | 111.6 |
| 2022 | 131.3 | 146 | 107.1 | 122.4 |
| 2023 | 144.6 | 131.9 | 119.3 | 130 |
| 2024 | 162.3 | 125.3 | 122.2 | 137.3 |
| 2025 | 166.4 | 118.8 | 124.8 | 144.6 |
Where the airfare hike actually hits
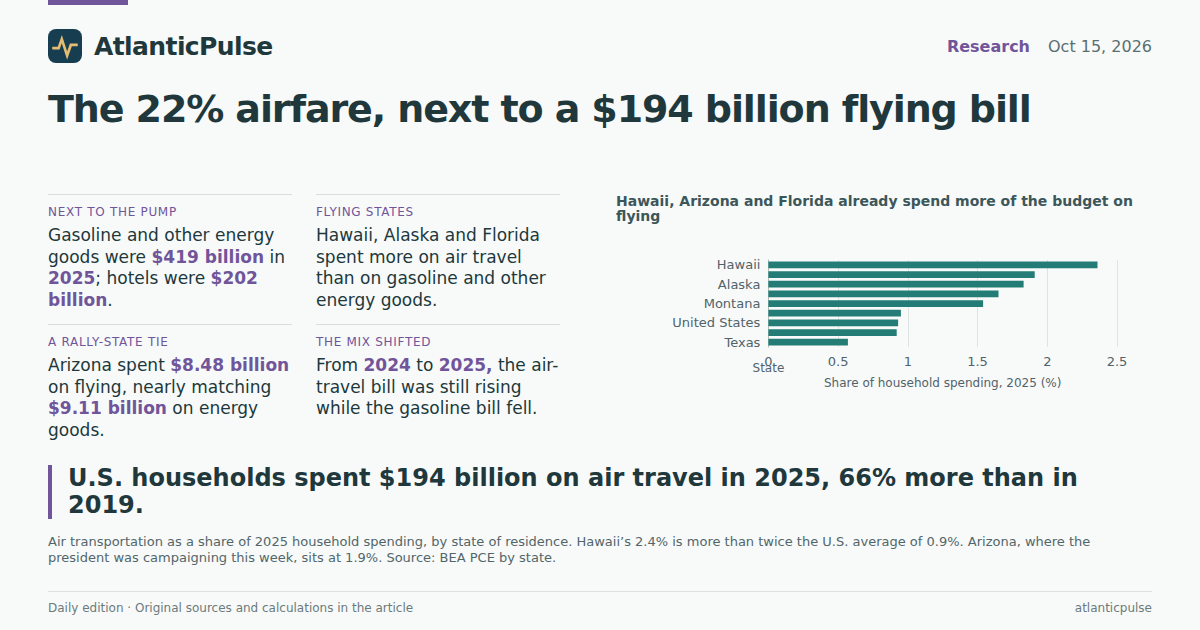
The national average hides the geography of flying. BEA records spending by state of residence, not by where the plane takes off. In 2025, air transportation was 2.36% of household spending in Hawaii, 1.91% in Arizona, 1.83% in Alaska, 1.65% in Florida and 1.54% in Montana. California and New York sat near the U.S. average of 0.93%. Texas, a driving state with enormous gasoline outlays, spent only 0.57% of its household budget on air travel.
In three of those states, flying had already overtaken the pump. Hawaii households spent $2.15 billion on air travel in 2025 and $0.98 billion on gasoline and other energy goods. Alaska spent $0.95 billion on flying and $0.70 billion on energy goods. Florida, which is not a small island, spent $25.6 billion on air travel and $24.5 billion on gasoline and other energy goods. Arizona, where the president was campaigning this week as gasoline prices dominated the political argument, was nearly tied: $8.48 billion on flying and $9.11 billion on energy goods. Montana still looks like a gasoline state — 2.52% of spending on energy goods versus 1.54% on air — but its air-travel bill more than doubled from 2019.
Every state in this set saw air-travel spending outrun overall household spending between 2019 and 2025. Alaska’s flying bill was up 164%, Montana’s 121%, Florida’s 103%. Even California’s 45% rise in air-travel spending slightly outpaced its 42% rise in total spending. These are nominal dollars: some of the increase is more flying, some of it is more expensive seats. The CPI print does not split those. The household books do show that a 22% airfare increase is not a rounding error in the states that already fly a lot, including two the White House was working this week.
Hawaii, Arizona and Florida already spend more of the budget on flying

View exact chart values
| state | air_b | total_b | air_share_pct |
|---|---|---|---|
| Hawaii | 2.15 | 91.3 | 2.36 |
| Arizona | 8.48 | 444.9 | 1.91 |
| Alaska | 0.95 | 51.8 | 1.83 |
| Florida | 25.6 | 1550 | 1.65 |
| Montana | 1.08 | 70.2 | 1.54 |
| California | 26.16 | 2757.9 | 0.95 |
| United States | 193.97 | 20870.2 | 0.93 |
| New York | 12.78 | 1393.3 | 0.92 |
| Texas | 10.06 | 1771.8 | 0.57 |
In Hawaii, Alaska and Florida, flying already rivals the pump

View exact chart values
| state | air_share_pct | gas_share_pct | air_b | gas_b | air_over_gas_pct |
|---|---|---|---|---|---|
| Hawaii | 2.36 | 1.07 | 2.15 | 0.98 | 219.2 |
| Arizona | 1.91 | 2.05 | 8.48 | 9.11 | 93.1 |
| Alaska | 1.83 | 1.36 | 0.95 | 0.7 | 134.5 |
| Florida | 1.65 | 1.58 | 25.6 | 24.51 | 104.4 |
| Montana | 1.54 | 2.52 | 1.08 | 1.77 | 61.3 |
| California | 0.95 | 1.63 | 26.16 | 44.83 | 58.3 |
| United States | 0.93 | 2.01 | 193.97 | 418.81 | 46.3 |
| New York | 0.92 | 1.13 | 12.78 | 15.72 | 81.3 |
| Texas | 0.57 | 2.26 | 10.06 | 40.1 | 25.1 |
Air-travel bills grew faster than overall spending in every state shown

View exact chart values
| state | air_2019_b | air_2025_b | air_chg_pct | pce_chg_pct | air_share_2019 | air_share_2025 |
|---|---|---|---|---|---|---|
| Hawaii | 1.16 | 2.15 | 85.4 | 36.5 | 1.73 | 2.36 |
| Arizona | 4.74 | 8.48 | 79.2 | 55.2 | 1.65 | 1.91 |
| Alaska | 0.36 | 0.95 | 164.1 | 40.4 | 0.97 | 1.83 |
| Florida | 12.62 | 25.6 | 102.9 | 60.1 | 1.3 | 1.65 |
| Montana | 0.49 | 1.08 | 121 | 53.2 | 1.07 | 1.54 |
| California | 18.03 | 26.16 | 45.1 | 42.1 | 0.93 | 0.95 |
| United States | 116.54 | 193.97 | 66.4 | 44.6 | 0.81 | 0.93 |
| New York | 8.93 | 12.78 | 43 | 38.5 | 0.89 | 0.92 |
| Texas | 5.26 | 10.06 | 91.4 | 51.4 | 0.45 | 0.57 |
What 2025 cannot tell you about September 2026
Two caveats belong next to those numbers, not in a footnote. First, “gasoline and other energy goods” is broader than the pump: it includes fuel oils and lubricants, so it is a high-side label for motor fuel. Air transportation is household spending on air travel, not the airline industry’s output, and it is assigned to the traveler’s home state. Second, the annual accounts end in 2025. They cannot measure September 2026’s 9.1% monthly gasoline jump or the 22% airfare increase in the CPI. They can tell you the size of the bills those price changes hit. A gasoline spike lands on a $419 billion energy-goods line that had been shrinking. An airfare spike lands on a $194 billion flying line that had been growing, and on state budgets — Hawaii, Arizona, Florida — where flying is no longer a small slice of the month.
Sources and methods
This analysis uses the U.S. Bureau of Economic Analysis annual Personal Consumption Expenditures by state (SAPCE), release bea-sapce-2026-09-30, from a snapshot created 2026-10-07. Figures are millions of current dollars, converted here to billions, for calendar years 2015–2025. They are not inflation-adjusted and are not September 2026 prices.
Air transportation is household spending on air travel (SAPCE3). Gasoline and other energy goods includes motor vehicle fuels, lubricants and fluids plus fuel oils and other fuels (SAPCE1). Accommodations is the hotels-and-lodging line in food services and accommodations. Totals are all household PCE. Spending is by state of residence.
State comparisons cover Hawaii, Alaska, Arizona, Montana, California, New York, Texas, Florida and the United States. Dictionary presence of other states is not treated as proof of published observations. Missing values were not filled as zero. Nominal growth mixes prices and quantities. No causal claim is made that the Iran war or any fare rule caused the 2019–2025 path.
The September 2026 CPI details cited in the article come from stored news evidence, not from this BEA extract. The two sources are not spliced into a single time series.
Research completed 2026-10-16, for the October 15, 2026 news edition. The available source data may cover earlier periods; see the observation periods and source vintages above.