Research
The $200 Check and the Power Bill
Why the check
Albany is about to stuff a lot of envelopes. New York says it will begin mailing energy rebate checks worth up to $200 to 8.2 million households starting Sept. 21, bankrolled with $1 billion from the state budget, as Gov. Kathy Hochul looks to offset the rising cost of power and heat (WHEC). The gesture lands at an awkward moment for household budgets everywhere: the national average gasoline price hit $4.25 a gallon this month, up $1.14 from a year earlier, and diesel climbed to $6.18 (GasBuddy via Vermont Business Magazine). The question lurking behind the press release is simple arithmetic: what does $200 — or even the full $1 billion — actually buy against the electricity bill? The official state consumer-spending accounts give a concrete answer, and it is smaller than the headline suggests.
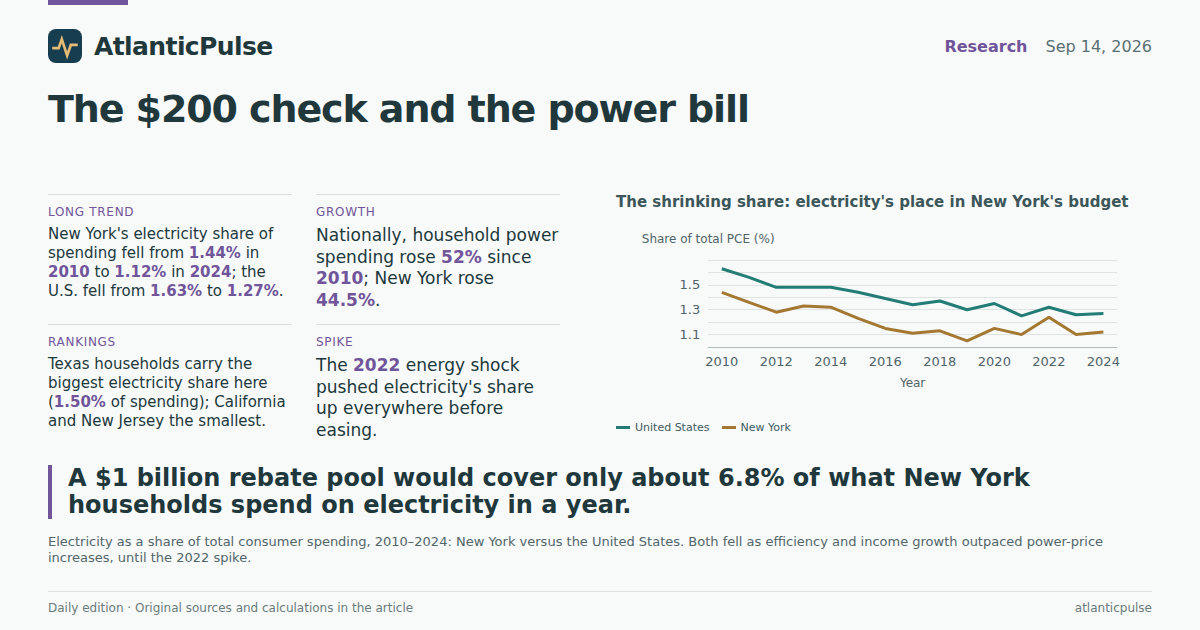
The Bureau of Economic Analysis tallies what households in each state actually spend on electricity each year within personal consumption expenditures (PCE). New York's number for 2024: $14.8 billion (BEA state PCE). That is up 44.5% from $10.2 billion in 2010 in nominal dollars — a slower climb than the national 52% rise — but it remains an enormous pool. The entire rebate program, $1 billion, equals about 6.8% of one year of New York household electricity spending. Spread evenly across all 8.2 million households, the pool would cover roughly a month of electricity for someone paying an average bill — not nothing, but not the relief the mailer might suggest.
Electricity's long climb: household power spending by state, 2010–2024

View exact chart values
| year | US | NY | CA | TX | PA | FL | MI | NJ |
|---|---|---|---|---|---|---|---|---|
| 2010 | 100 | 100 | 100 | 100 | 100 | 100 | 100 | 100 |
| 2011 | 100 | 99.3 | 99.4 | 98.6 | 104 | 95.9 | 104.1 | 96.9 |
| 2012 | 97.9 | 96.3 | 103.2 | 93 | 100.4 | 90.7 | 108.1 | 92.9 |
| 2013 | 101.4 | 103.7 | 108.8 | 94 | 103.3 | 89.7 | 114.4 | 97.7 |
| 2014 | 105.6 | 107.9 | 108.5 | 102.3 | 106.3 | 95 | 115.5 | 95.3 |
| 2015 | 106.5 | 103.5 | 111.5 | 102.1 | 109.9 | 97.1 | 114.1 | 94.1 |
| 2016 | 106.2 | 99.7 | 116.9 | 97.9 | 107.7 | 97.8 | 117.8 | 92.3 |
| 2017 | 106.5 | 100.1 | 124.8 | 95.8 | 107.6 | 97.3 | 118.9 | 90.7 |
| 2018 | 114.3 | 106.7 | 127.6 | 105.9 | 116.2 | 102 | 128.2 | 94.8 |
| 2019 | 112.3 | 103.5 | 127.9 | 107.8 | 111.3 | 102.3 | 122.4 | 93.4 |
| 2020 | 114.9 | 108 | 142.6 | 108.1 | 111.2 | 106 | 129.6 | 96.5 |
| 2021 | 120.4 | 114.6 | 156.4 | 114.4 | 112.3 | 110.2 | 137.7 | 103.1 |
| 2022 | 139.7 | 140.5 | 180.2 | 136.9 | 136.5 | 131.2 | 153.2 | 114.7 |
| 2023 | 142 | 134.5 | 186.3 | 143 | 141.8 | 139.5 | 150.1 | 111.5 |
| 2024 | 152 | 144.5 | 202.6 | 156.3 | 153.5 | 152.3 | 157 | 116.6 |
The burden, measured
The more revealing number is what electricity takes out of every dollar of consumer spending. By that measure, New York is actually a relatively light user. In 2024, electricity was 1.12% of total PCE in New York, below the national average of 1.27% and well below Texas (1.50%), Florida (1.36%), Michigan (1.31%) and Pennsylvania (1.30%). New Jersey was the lightest of the states examined, at 1.03%, and California, for all its famous rates, came in at 1.05% — the lesson being that a hot climate, dispersed population and heavy air-conditioning load can make the power bill a bigger share of the budget than any single state's electricity price.
The long trend helps put the 2020s in perspective. Electricity's share of spending has been shrinking for years in New York — from 1.44% in 2010 to 1.12% in 2024 — and nationally from 1.63% to 1.27%. Efficiency gains and rising incomes quietly did what rebates can only gesture at. Then came 2022, when winter weather, tight natural gas markets and a global energy squeeze shoved electricity's share back up everywhere. New York's share jumped from 1.10% in 2021 to 1.24% in 2022 before easing again. That spike is the recent memory the rebate program is answering: an energy shock that arrived as a line item, not a headline.
Where the power bill takes the biggest bite

View exact chart values
| label | share2010 | share2024 | elec2024 | totpce2024 | delta_pp |
|---|---|---|---|---|---|
| TX | 2.1 | 1.5 | 25377 | 1691583.7 | -0.6 |
| FL | 2.03 | 1.36 | 19912.3 | 1463514.5 | -0.67 |
| MI | 1.49 | 1.31 | 7187.3 | 549582.5 | -0.18 |
| PA | 1.45 | 1.3 | 10094.6 | 775048.3 | -0.15 |
| US | 1.63 | 1.27 | 253432.5 | 19896009.2 | -0.35 |
| NY | 1.44 | 1.12 | 14800.6 | 1319699.9 | -0.31 |
| CA | 1.06 | 1.05 | 27998.2 | 2664167.6 | -0.01 |
| NJ | 1.57 | 1.03 | 6460.9 | 625846.8 | -0.54 |
The shrinking share: electricity's place in New York's budget

View exact chart values
| year | US | NY | CA | TX | PA | FL |
|---|---|---|---|---|---|---|
| 2010 | 1.63 | 1.44 | 1.06 | 2.1 | 1.45 | 2.03 |
| 2011 | 1.56 | 1.36 | 1.01 | 1.96 | 1.45 | 1.86 |
| 2012 | 1.48 | 1.28 | 1.01 | 1.76 | 1.37 | 1.7 |
| 2013 | 1.48 | 1.33 | 1.03 | 1.71 | 1.38 | 1.62 |
| 2014 | 1.48 | 1.32 | 0.99 | 1.75 | 1.38 | 1.63 |
| 2015 | 1.44 | 1.23 | 0.97 | 1.68 | 1.39 | 1.58 |
| 2016 | 1.39 | 1.15 | 0.97 | 1.55 | 1.34 | 1.53 |
| 2017 | 1.34 | 1.11 | 0.98 | 1.45 | 1.29 | 1.45 |
| 2018 | 1.37 | 1.13 | 0.95 | 1.53 | 1.33 | 1.43 |
| 2019 | 1.3 | 1.05 | 0.91 | 1.5 | 1.24 | 1.38 |
| 2020 | 1.35 | 1.15 | 1.04 | 1.49 | 1.27 | 1.43 |
| 2021 | 1.25 | 1.1 | 1 | 1.38 | 1.16 | 1.29 |
| 2022 | 1.32 | 1.24 | 1.05 | 1.49 | 1.28 | 1.36 |
| 2023 | 1.26 | 1.1 | 1.02 | 1.46 | 1.26 | 1.33 |
| 2024 | 1.27 | 1.12 | 1.05 | 1.5 | 1.3 | 1.36 |
The pump versus the plug
New Yorkers feel the energy squeeze differently from Texans or Californians. On a per-capita basis, spending on gasoline and other energy goods — motor fuel, lubricants, fuel oil — was just $816 in New York in 2024, against $1,295 for the country, $1,367 in Texas and $1,217 in California (BEA state PCE). Dense, transit-oriented New York simply buys less gasoline per person, which is why a $4.25 national pump shock bites harder elsewhere than it does on the Hudson. The New York energy story is the plug, not the pump: electricity is two-thirds of the state's household fuel-and-utilities spending, at $14.8 billion in 2024, with natural gas ($4.8 billion) and fuel oil and other fuels ($2.4 billion) making up the rest.
That composition matters for policy. California's household electricity spending has risen 103% since 2010 in nominal terms — the fastest of the large states in this comparison — yet electricity is a smaller share of California spending than it was in 2010, because incomes and other spending grew still faster. New York's electricity spending rose 45% but its share also fell. The states where the bill still bites hardest are the hot-weather and sprawling ones: Texas and Florida top the 2024 share rankings. If a future rebate program is really about burdens, it is worth asking why the checks are going to the state where electricity takes the smallest bite relative to spending, rather than the states where it takes the biggest.
Who pays at the pump: per-capita gasoline and energy goods

View exact chart values
| label | v2010 | v2024 |
|---|---|---|
| US | 1088 | 1295 |
| NY | 709 | 816 |
| CA | 867 | 1217 |
| TX | 1149 | 1367 |
What heats and powers New York households

View exact chart values
| label | value |
|---|---|
| Electricity | 14800.6 |
| Natural gas | 4811.7 |
| Fuel oil and other fuels | 2403 |
What the numbers don't say
Two honest caveats. First, the $14.8 billion figure is nominal — it reflects growth in both prices and usage — and BEA's latest annual data run to 2024, before this month's fuel-price surge. The real-time gas price shock will show up in the 2025 and 2026 accounts, and diesel at records will push freight and heating costs into next year's bills. Second, aggregate spending does not tell you about any single family: a small apartment in Buffalo and a heated house in Westchester are very different consumers of electricity. What the state books can say is that the $1 billion pool is real help to a specific household — $200 is a fifth of a typical annual electricity bill in some markets — but as a share of what New Yorkers collectively spend on power, it is slightly less than one month's entire bill.
The practical takeaway for the reader watching the mailbox: cash the check, but keep the receipt close. The rebate is best understood as a partial refund on one line of the budget — the one that grew 45% in fifteen years without anyone noticing it inflate. The states that run the numbers will notice, though. Electricity may be a small share of every spending dollar, but it is a fixed share of every month, and that is exactly the kind of bill that hurts most when prices spike. New York's $200 says the state knows it; the $14.8 billion says where the real money lives.
Sources and methods
A
l
l
d
o
l
l
a
r
f
i
g
u
r
e
s
c
o
m
e
f
r
o
m
t
h
e
B
u
r
e
a
u
o
f
E
c
o
n
o
m
i
c
A
n
a
l
y
s
i
s
p
e
r
s
o
n
a
l
c
o
n
s
u
m
p
t
i
o
n
e
x
p
e
n
d
i
t
u
r
e
s
b
y
s
t
a
t
e
(
S
A
P
C
E
)
r
e
l
e
a
s
e
o
f
S
e
p
t
.
2
6
,
2
0
2
5
,
a
n
n
u
a
l
o
b
s
e
r
v
a
t
i
o
n
s
t
h
r
o
u
g
h
2
0
2
4
,
n
o
m
i
n
a
l
c
u
r
r
e
n
t
d
o
l
l
a
r
s
;
t
h
e
p
i
n
n
e
d
c
a
t
a
l
o
g
u
e
s
n
a
p
s
h
o
t
w
a
s
b
u
i
l
t
A
u
g
.
3
1
,
2
0
2
6
,
s
o
d
a
t
a
r
e
f
l
e
c
t
t
h
e
s
t
a
n
d
a
r
d
p
u
b
l
i
c
a
t
i
o
n
v
i
n
t
a
g
e
a
v
a
i
l
a
b
l
e
b
e
f
o
r
e
t
h
i
s
e
d
i
t
i
o
n
—
n
o
t
c
u
r
r
e
n
t
-
d
a
y
r
e
a
d
i
n
g
s
.
C
o
n
n
e
c
t
i
o
n
s
b
e
t
w
e
e
n
e
x
t
r
a
c
t
s
p
r
e
s
e
r
v
e
B
E
A
d
e
f
i
n
i
t
i
o
n
s
:
e
l
e
c
t
r
i
c
i
t
y
a
n
d
f
u
e
l
c
a
t
e
g
o
r
i
e
s
s
i
t
w
i
t
h
i
n
h
o
u
s
e
h
o
l
d
c
o
n
s
u
m
p
t
i
o
n
e
x
p
e
n
d
i
t
u
r
e
s
;
s
h
a
r
e
s
a
r
e
c
o
m
p
u
t
e
d
a
s
c
a
t
e
g
o
r
y
d
i
v
i
d
e
d
b
y
t
o
t
a
l
P
C
E
p
e
r
s
t
a
t
e
-
y
e
a
r
;
i
n
d
e
x
v
a
l
u
e
s
u
s
e
2
0
1
0
a
s
b
a
s
e
.
T
h
e
$
1
b
i
l
l
i
o
n
r
e
b
a
t
e
p
o
o
l
,
8
.
2
m
i
l
l
i
o
n
h
o
u
s
e
h
o
l
d
s
a
n
d
S
e
p
t
.
2
1
m
a
i
l
i
n
g
d
a
t
e
a
r
e
t
a
k
e
n
f
r
o
m
r
e
p
o
r
t
i
n
g
b
y
W
H
E
C
(
S
e
p
t
.
1
4
,
2
0
2
6
)
a
n
d
a
r
e
n
o
t
B
E
A
d
a
t
a
.
A
g
g
r
e
g
a
t
e
s
p
e
n
d
i
n
g
i
s
n
o
t
a
n
a
v
e
r
a
g
e
h
o
u
s
e
h
o
l
d
b
i
l
l
;
n
o
c
a
u
s
a
l
c
l
a
i
m
s
a
r
e
m
a
d
e
.
C
h
a
r
t
v
a
l
u
e
s
a
r
e
d
e
r
i
v
e
d
s
o
l
e
l
y
f
r
o
m
t
h
e
s
a
v
e
d
c
a
l
c
u
l
a
t
i
o
n
t
a
b
l
e
s
.
Research completed 2026-09-15, for the September 14, 2026 news edition. The available source data may cover earlier periods; see the observation periods and source vintages above.