Research
The 10-million-ton coal promise, next to the grids already built
A coal souvenir and a cheaper-car promise
The White House came out of Xi Jinping’s three-day visit with a commodity trophy: China would import at least 10 million metric tons of American coal in 2027 and another 10 million in 2028, alongside tariff tweaks on toys, logs and farm goods. (Trump, Xi strike tariff deal as China agrees to buy U.S. coal) A day later, President Donald Trump signed off on new fuel-economy rules that drop the 2031 fleetwide target to 34.5 miles per gallon from 50.4, calling the old standards an “EV mandate.” Former Transportation Secretary Pete Buttigieg’s retort was that Washington is “handing the clean tech future to China” while charging Americans more at the pump. (Trump declares end to ‘EV mandate’)
Those are political sentences. They are not a scoreboard. The International Renewable Energy Agency keeps one, in on-grid megawatts and in terawatt-hours, and it does not wait for a midterm. The question this week actually raises is simpler than a 10-million-ton press release: how large are the U.S. and Chinese coal, solar and wind fleets already? The answer, on IRENA’s country capacity and generation tables, is that China is not waiting to be handed a clean-tech future. It has been building both a much larger coal fleet and a much larger solar and wind fleet, at the same time. Capacity is not the same as electricity generated, and 2025 nameplates in an August 2026 snapshot can include estimates. Even with those caveats, the gap is not a rounding error.
China’s coal fleet is in a different league. So is its solar fleet.
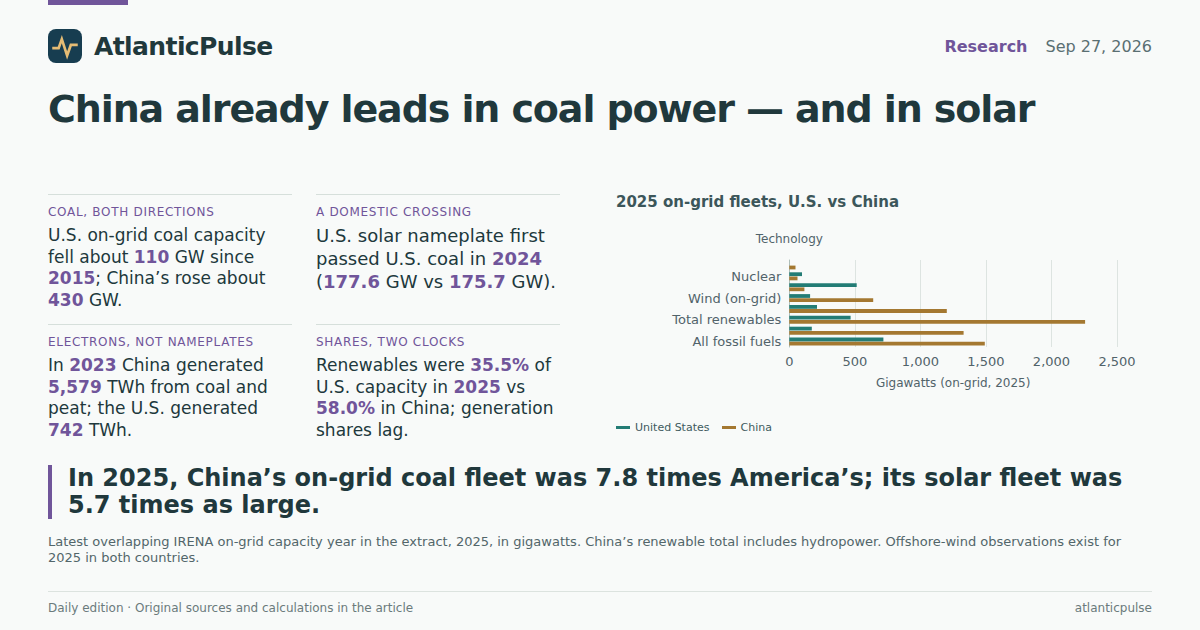
In 2025, the latest overlapping year in IRENA’s on-grid capacity extract, the United States had 171.3 gigawatts of coal plants. China had 1,330.1 gigawatts — 7.8 times as much. That is the fleet sitting behind any conversation about selling Beijing a few million tons of Appalachian or Powder River coal. America’s coal nameplate has been shrinking: it was 281.5 GW in 2015, a drop of 110 GW in a decade. China’s coal nameplate rose by 430 GW over the same stretch. A U.S. coal sale can be real money for mines. It does not make the two power systems look alike.
The clean-tech half of the argument is not a U.S. lead that policy is about to squander. In 2025 China had 1,201.7 GW of on-grid solar, 5.7 times the U.S. 211.6 GW, and 640 GW of on-grid wind against 158.8 GW. Add hydropower and other renewables and China’s total renewable nameplate was 2,257 GW, nearly five times America’s 467.9 GW. China’s renewable fleet alone was larger than the entire U.S. fossil-fuel fleet (717.7 GW). The United States still leads in natural-gas capacity, 513.9 GW to 115.3 GW, and remains ahead in nuclear, 96.9 GW to 62.5 GW. Those are the parts of the American grid that actually dwarf China’s. They are not the parts the EV-mandate fight is about.
On-grid power capacity: U.S. vs China, 2000–2025

View exact chart values
| year | us_coal_gw | cn_coal_gw | us_solar_gw | cn_solar_gw | us_wind_gw | cn_wind_gw | us_re_gw | cn_re_gw | us_gas_gw | cn_gas_gw | us_nuc_gw | cn_nuc_gw | us_fos_gw | cn_fos_gw |
|---|---|---|---|---|---|---|---|---|---|---|---|---|---|---|
| 2000 | 321.1 | 218.6 | 0.6 | 0 | 2.4 | 0.3 | 96.3 | 75.8 | 243.2 | 8.8 | 97.9 | 2.3 | 599.9 | 236.9 |
| 2001 | 315.9 | 232.4 | 0.5 | 0 | 3.9 | 0.4 | 96.7 | 79.2 | 253.2 | 9.3 | 98.2 | 2.3 | 635.2 | 251.9 |
| 2002 | 317.4 | 244.3 | 0.5 | 0 | 4.4 | 0.4 | 98.2 | 83.2 | 312.5 | 9.8 | 98.7 | 4.9 | 689.5 | 264.3 |
| 2003 | 315 | 266.4 | 0.7 | 0 | 6 | 0.5 | 99.3 | 92.3 | 355.4 | 10.7 | 99.2 | 5.6 | 731.2 | 288.1 |
| 2004 | 315.3 | 302.2 | 0.8 | 0 | 6.5 | 0.8 | 99.2 | 102.9 | 371 | 12.1 | 99.6 | 6.3 | 745.4 | 327.1 |
| 2005 | 315.4 | 359.2 | 0.9 | 0.1 | 8.7 | 1.1 | 101.7 | 114.9 | 383.1 | 14.4 | 100 | 7 | 757.1 | 389 |
| 2006 | 315.2 | 444.6 | 1.1 | 0.1 | 11.3 | 2.1 | 105.1 | 128.8 | 388.3 | 17.8 | 100.3 | 7 | 761.6 | 481.5 |
| 2007 | 315.1 | 509.8 | 1.4 | 0.1 | 16.5 | 4.2 | 111.3 | 146.6 | 392.9 | 20.5 | 100.3 | 9.1 | 764 | 552 |
| 2008 | 315.3 | 552 | 1.6 | 0.1 | 24.7 | 8.4 | 120.1 | 174.2 | 397.5 | 22.1 | 100.8 | 9.1 | 770.2 | 597.7 |
| 2009 | 316.2 | 598.9 | 2.1 | 0.3 | 34.3 | 17.6 | 131.1 | 205.1 | 401.3 | 24 | 101 | 9.1 | 774.3 | 647.4 |
| 2010 | 319 | 655 | 3.4 | 0.9 | 39.1 | 29.6 | 137.7 | 233 | 407 | 26.4 | 101.2 | 10.8 | 781.6 | 702.4 |
| 2011 | 319.9 | 709.3 | 5.6 | 2.9 | 45.7 | 46.2 | 146.6 | 267.6 | 415.2 | 34.1 | 101.4 | 12.6 | 786.8 | 763.4 |
| 2012 | 311.5 | 754.9 | 8.6 | 6.5 | 59.1 | 61.4 | 163.9 | 301.7 | 422.4 | 37.7 | 101.9 | 12.6 | 780.7 | 813.9 |
| 2013 | 304.7 | 795.8 | 13 | 17.5 | 60 | 76.5 | 170.8 | 359 | 425.4 | 42.8 | 99.2 | 14.7 | 773.3 | 862.3 |
| 2014 | 300.3 | 841 | 17.7 | 28.1 | 64.2 | 96.6 | 180.2 | 414.1 | 432.2 | 57 | 98.6 | 20.1 | 773.3 | 909.6 |
| 2015 | 281.5 | 900.1 | 23.4 | 43.2 | 72.6 | 130.8 | 194.9 | 478.4 | 439.4 | 66 | 98.7 | 27.2 | 757.4 | 979.9 |
| 2016 | 269.1 | 946.2 | 34.7 | 77.5 | 81.3 | 148.2 | 215.1 | 540.3 | 447.2 | 70.1 | 99.6 | 33.6 | 750.6 | 1029.6 |
| 2017 | 258.9 | 985.6 | 43.1 | 130.5 | 87.6 | 164 | 229.7 | 620.1 | 456.4 | 75.8 | 99.6 | 35.8 | 748.7 | 1072.8 |
| 2018 | 245 | 1008.4 | 51.6 | 174.9 | 94.5 | 184.3 | 244.9 | 694.7 | 472.3 | 83.8 | 99.4 | 44.7 | 753.2 | 1126.3 |
| 2019 | 230.9 | 1040.6 | 60.8 | 204.6 | 103.7 | 209.2 | 262.7 | 758 | 479.4 | 90.2 | 98.1 | 48.7 | 745.3 | 1167 |
| 2020 | 217.5 | 1084.3 | 75.8 | 253.5 | 118.5 | 281.5 | 292.5 | 895.5 | 488.3 | 94 | 96.5 | 49.9 | 737 | 1216 |
| 2021 | 211.4 | 1123.3 | 94.8 | 306.6 | 132.9 | 328.5 | 325.8 | 1016.9 | 494.4 | 97.4 | 95.5 | 53.3 | 737.6 | 1259.7 |
| 2022 | 191.5 | 1155.3 | 112.8 | 392.6 | 141.5 | 365.4 | 352.5 | 1155.2 | 503.9 | 100.2 | 94.7 | 55.5 | 729.8 | 1295.7 |
| 2023 | 180.2 | 1200.4 | 139.9 | 609.5 | 147.5 | 441.3 | 385.3 | 1452.7 | 509.6 | 104.1 | 95.7 | 56.9 | 723.1 | 1346.2 |
| 2024 | 175.7 | 1247 | 177.6 | 886.7 | 152.7 | 520.7 | 427.9 | 1816.9 | 508.2 | 108.1 | 96.8 | 60.8 | 717 | 1398.5 |
| 2025 | 171.3 | 1330.1 | 211.6 | 1201.7 | 158.8 | 640 | 467.9 | 2257 | 513.9 | 115.3 | 96.9 | 62.5 | 717.7 | 1491.7 |
2025 on-grid fleets, U.S. vs China

View exact chart values
| tech | usa_gw | china_gw | china_to_usa |
|---|---|---|---|
| All fossil fuels | 717.7 | 1491.7 | 2.08 |
| Coal | 171.3 | 1330.1 | 7.77 |
| Total renewables | 467.9 | 2257 | 4.82 |
| Solar (on-grid) | 211.6 | 1201.7 | 5.68 |
| Wind (on-grid) | 158.8 | 640 | 4.03 |
| Natural gas | 513.9 | 115.3 | 0.22 |
| Nuclear | 96.9 | 62.5 | 0.64 |
| Offshore wind | 0.2 | 47.4 | 276.65 |
2015 was not that long ago
Index the same series at 2015 and the last decade looks even less like a photo finish. U.S. on-grid solar capacity in 2025 was about nine times its 2015 level; China’s was about 28 times. U.S. wind a little more than doubled; China’s rose nearly fivefold. U.S. coal capacity fell to 61 percent of its 2015 level; China’s rose to 148 percent. The United States did build. China built faster, on a larger base, in both the fuel Washington is trying to export and the technologies Washington is arguing about in auto rules.
One crossing is easy to miss if you only listen to Detroit. In 2024, U.S. on-grid solar capacity (177.6 GW) edged past U.S. coal (175.7 GW) for the first time in this extract. In 2025 the gap widened: 211.6 GW of solar against 171.3 GW of coal. That is a U.S. story about the domestic mix, not a claim that American solar now rivals China’s. It does mean the plant America is retiring and the plant America is adding have already swapped places on the nameplate. Fuel-economy rules change what new cars sip. They do not reverse a decade of coal retirements already on IRENA’s books.
Since 2015, China’s solar and wind scaled faster; U.S. coal shrank

View exact chart values
| year | us_solar_idx | cn_solar_idx | us_wind_idx | cn_wind_idx | us_re_idx | cn_re_idx | us_coal_idx | cn_coal_idx |
|---|---|---|---|---|---|---|---|---|
| 2010 | 14.4 | 2 | 53.9 | 22.6 | 70.7 | 48.7 | 113.3 | 72.8 |
| 2011 | 24.1 | 6.8 | 62.9 | 35.4 | 75.2 | 55.9 | 113.7 | 78.8 |
| 2012 | 36.7 | 15.1 | 81.4 | 47 | 84.1 | 63.1 | 110.7 | 83.9 |
| 2013 | 55.6 | 40.4 | 82.6 | 58.5 | 87.6 | 75 | 108.2 | 88.4 |
| 2014 | 75.3 | 65 | 88.5 | 73.9 | 92.5 | 86.5 | 106.7 | 93.4 |
| 2015 | 100 | 100 | 100 | 100 | 100 | 100 | 100 | 100 |
| 2016 | 148.1 | 179.3 | 112 | 113.3 | 110.4 | 112.9 | 95.6 | 105.1 |
| 2017 | 183.9 | 302 | 120.7 | 125.4 | 117.8 | 129.6 | 92 | 109.5 |
| 2018 | 220 | 404.9 | 130.2 | 140.9 | 125.6 | 145.2 | 87.1 | 112 |
| 2019 | 259.5 | 473.7 | 142.8 | 160 | 134.8 | 158.4 | 82 | 115.6 |
| 2020 | 323.3 | 586.8 | 163.3 | 215.3 | 150.1 | 187.2 | 77.3 | 120.5 |
| 2021 | 404.3 | 709.8 | 183.1 | 251.2 | 167.2 | 212.6 | 75.1 | 124.8 |
| 2022 | 481.4 | 909 | 195 | 279.5 | 180.9 | 241.4 | 68 | 128.4 |
| 2023 | 596.9 | 1411.2 | 203.3 | 337.5 | 197.7 | 303.6 | 64 | 133.4 |
| 2024 | 757.6 | 2052.9 | 210.3 | 398.2 | 219.5 | 379.8 | 62.4 | 138.5 |
| 2025 | 902.7 | 2782.4 | 218.9 | 489.5 | 240.1 | 471.7 | 60.9 | 147.8 |
The electrons still tell a slower story
Nameplates overstate how much solar and wind work. IRENA’s generation series stop in 2023, two years behind the capacity file, and they split technologies slightly differently (solar photovoltaic; onshore wind). Even so, they keep the boast honest. In 2023 China generated 5,579 terawatt-hours from coal and peat, 7.5 times the U.S. 742 TWh. U.S. coal generation had already fallen from more than 2,100 TWh in the early 2000s. China’s coal generation was still rising. American households should not confuse a shrinking coal fleet with a world that has stopped burning the stuff.
Renewables are catching capacity faster than they catch kilowatt-hours. In 2023 the United States generated 962 TWh from all renewables, including hydro; China generated 2,843 TWh, about three times as much. U.S. solar PV produced 214 TWh, Chinese solar PV 584 TWh. Onshore wind: 425 TWh in the United States, 812 TWh in China. The American workhorse was still gas, at 1,865 TWh — seven times China’s 268 TWh. IRENA’s renewable share of generation in 2023 was 21.6 percent in the United States and 30.1 percent in China. The capacity shares in 2025 were higher, 35.5 percent and 58.0 percent, because wind and solar do not run around the clock. Anyone treating a gigawatt of solar as a gigawatt of coal is doing advertising, not arithmetic.
Electricity actually generated: coal vs renewables

View exact chart values
| year | us_coal_twh | cn_coal_twh | us_solar_twh | cn_solar_twh | us_wind_twh | cn_wind_twh | us_re_twh | cn_re_twh | us_gas_twh | cn_gas_twh |
|---|---|---|---|---|---|---|---|---|---|---|
| 2000 | 2129.5 | 1070.8 | 0.2 | 0 | 5.7 | 0.6 | 330.4 | 223 | 634.3 | 19.5 |
| 2001 | 1982.1 | 1137.3 | 0.2 | 0 | 6.8 | 0.7 | 260.4 | 278.1 | 659.9 | 20.7 |
| 2002 | 2039.7 | 1286 | 0.3 | 0.1 | 10.5 | 0.9 | 347.3 | 288.8 | 712.4 | 23.4 |
| 2003 | 2083.3 | 1518.8 | 0.3 | 0.1 | 11.3 | 1 | 360.4 | 284.7 | 670.2 | 27.6 |
| 2004 | 2090.5 | 1725.6 | 0.4 | 0.1 | 14.3 | 1.3 | 358 | 354.9 | 731.6 | 31.4 |
| 2005 | 2154 | 1967.6 | 0.5 | 0.1 | 17.9 | 1.6 | 366.2 | 401.1 | 782.8 | 35.8 |
| 2006 | 2127.8 | 2277.3 | 0.7 | 0.2 | 26.7 | 2.8 | 395.2 | 442.6 | 842.8 | 41.4 |
| 2007 | 2118.5 | 2616.8 | 1 | 0.2 | 34.6 | 5.7 | 361.8 | 496.3 | 915.2 | 47.6 |
| 2008 | 2132.6 | 2681.4 | 1.2 | 0.2 | 55.7 | 11.4 | 391 | 606.3 | 910.2 | 48.8 |
| 2009 | 1892.7 | 2866.5 | 1.7 | 0.3 | 74.2 | 24.9 | 428.7 | 654.5 | 949.8 | 52.2 |
| 2010 | 1994.2 | 3252.4 | 3.1 | 0.7 | 95.1 | 48.9 | 440.7 | 780 | 1017.9 | 47.7 |
| 2011 | 1875.4 | 3696.1 | 5.3 | 2 | 120.9 | 71.3 | 529 | 783 | 1045.3 | 108.8 |
| 2012 | 1643.4 | 3713.1 | 9.2 | 4.4 | 141.9 | 102.5 | 512.8 | 994.4 | 1264.6 | 110.3 |
| 2013 | 1712.4 | 3980.5 | 14.9 | 8.8 | 169.7 | 137.8 | 541.8 | 1086 | 1158.5 | 116.4 |
| 2014 | 1712.6 | 4026.6 | 23.1 | 23.8 | 183.9 | 159.5 | 560.7 | 1269.9 | 1161.3 | 133.3 |
| 2015 | 1471 | 3897.7 | 32.1 | 40 | 193 | 185.2 | 568.4 | 1381.4 | 1372.6 | 166.9 |
| 2016 | 1354 | 3945.7 | 46.6 | 67.9 | 229.4 | 240 | 637.1 | 1522.4 | 1418.1 | 188.3 |
| 2017 | 1321.4 | 4149.8 | 67.4 | 118.3 | 257.1 | 299.8 | 718.2 | 1648.5 | 1337.7 | 202.8 |
| 2018 | 1272.2 | 4482.9 | 81.2 | 178.1 | 275.7 | 357.3 | 743.2 | 1810.9 | 1519.2 | 215.5 |
| 2019 | 1069.5 | 4553.8 | 93.9 | 224.5 | 298.1 | 395 | 767 | 1986 | 1639.8 | 232.5 |
| 2020 | 855.8 | 4589.6 | 115.9 | 261.6 | 341.7 | 452.1 | 827.4 | 2149 | 1680.1 | 242.3 |
| 2021 | 991.6 | 5035.2 | 148.2 | 327.5 | 382.7 | 604 | 866.3 | 2402.8 | 1634.1 | 251 |
| 2022 | 913.3 | 5220.7 | 183.8 | 428.1 | 439.1 | 699.8 | 959.2 | 2625.3 | 1740.4 | 258.2 |
| 2023 | 742 | 5579.3 | 214.4 | 583.9 | 425.3 | 811.7 | 962.1 | 2842.8 | 1865.3 | 268.3 |
Renewables’ share of the grid, capacity vs generation

View exact chart values
| year | us_re_share_capacity_pct | cn_re_share_capacity_pct | us_re_share_generation_pct | cn_re_share_generation_pct |
|---|---|---|---|---|
| 2000 | 11.86 | 23.7 | 8.15 | 16.45 |
| 2001 | 11.4 | 23.42 | 6.74 | 18.78 |
| 2002 | 10.85 | 23.29 | 8.57 | 17.46 |
| 2003 | 10.46 | 23.62 | 8.83 | 14.9 |
| 2004 | 10.3 | 23.34 | 8.57 | 16.1 |
| 2005 | 10.39 | 22.27 | 8.53 | 16.04 |
| 2006 | 10.65 | 20.66 | 9.19 | 15.44 |
| 2007 | 11.18 | 20.47 | 8.32 | 15.12 |
| 2008 | 11.87 | 22.03 | 8.95 | 17.49 |
| 2009 | 12.77 | 23.44 | 10.24 | 17.62 |
| 2010 | 13.23 | 24.18 | 10.06 | 18.54 |
| 2011 | 13.89 | 25.19 | 12.16 | 16.61 |
| 2012 | 15.35 | 26.27 | 11.95 | 19.94 |
| 2013 | 16.03 | 28.54 | 12.58 | 19.99 |
| 2014 | 16.77 | 30.3 | 12.92 | 22.47 |
| 2015 | 18.17 | 31.7 | 13.17 | 23.75 |
| 2016 | 19.79 | 33.11 | 14.74 | 24.78 |
| 2017 | 20.87 | 35.23 | 16.75 | 24.96 |
| 2018 | 21.88 | 36.58 | 16.68 | 25.27 |
| 2019 | 23.3 | 37.74 | 17.47 | 26.46 |
| 2020 | 25.49 | 40.72 | 19.42 | 27.62 |
| 2021 | 27.6 | 42.81 | 19.8 | 28.15 |
| 2022 | 29.42 | 45.07 | 21.34 | 29.66 |
| 2023 | 31.05 | 49.77 | 21.61 | 30.06 |
| 2024 | 33.47 | 54.27 | — | — |
| 2025 | 35.47 | 58.01 | — | — |
What the summit did not buy
A 10-million-ton coal commitment is a shipping schedule, not a power plant. IRENA does not convert those tons into megawatts, and this article does not invent that conversion. What the agency does show is that China’s coal-power system is already an order of magnitude larger than America’s, and that China’s solar and wind systems are several times larger too. Rolling back U.S. fuel-economy rules may change the cars on American lots. It does not, by itself, shrink a 1,202-gigawatt Chinese solar fleet or a 1,330-gigawatt Chinese coal fleet.
The offshore-wind line is a footnote with a punch. In 2025 IRENA records 171 megawatts of U.S. offshore wind — 0.2 GW — against 47.4 GW in China, more than 270 times as much. That is not an argument about any one lease sale. It is a reminder that “clean tech” is a construction business, and construction shows up as capacity years before it shows up as campaign copy. The United States still has the gas turbines, the nuclear plants, and a solar fleet that has finally passed domestic coal on the nameplate. China has the bigger coal pile and the bigger solar and wind pile. The summit sold coal. The grids were not waiting for the communiqué.
Sources and methods
IRENA Renewable Energy Statistics from the pinned catalogue snapshot created 24 August 2026 (not live 27 September 2026 observations). On-grid electricity capacity is annual, 2000–2025, stored in megawatts and converted to gigawatts by dividing by 1,000. Electricity generation is annual through 2023, stored in gigawatt-hours and converted to terawatt-hours the same way. Renewable-energy shares are IRENA percentages, not calculated from the capacity and generation series.
U.S. capacity series use geography id USA; U.S. generation and renewable-share series use United States of America (the), the identifiers that actually contain observations. China uses geo id China throughout. Dictionary rows for United States of America (the) on capacity series were empty and were not treated as zero.
Capacity technologies are IRENA on-grid coal, solar energy, wind energy, natural gas, nuclear, total renewable energy, fossil fuels, and offshore wind. Generation technologies are coal and peat (all grids), solar photovoltaic, onshore wind, natural gas, and total renewable. Those lists are not identical; solar thermal, offshore generation, and off-grid capacity are excluded. Total renewables include hydropower.
2025 capacity values may include IRENA estimates; generation stops in 2023. Missing years are not zeros. Capacity is a nameplate, not a running hour. No tons of coal, no EV sales, and no causal effect of the summit or the fuel-economy rule are inferred. Ratios are China divided by the United States from the same year.
Research completed 2026-09-28, for the September 27, 2026 news edition. The available source data may cover earlier periods; see the observation periods and source vintages above.
- IRENA Renewable Energy Statistics: Source 1