Research
Texas cities grew. Their workforces did not keep up.
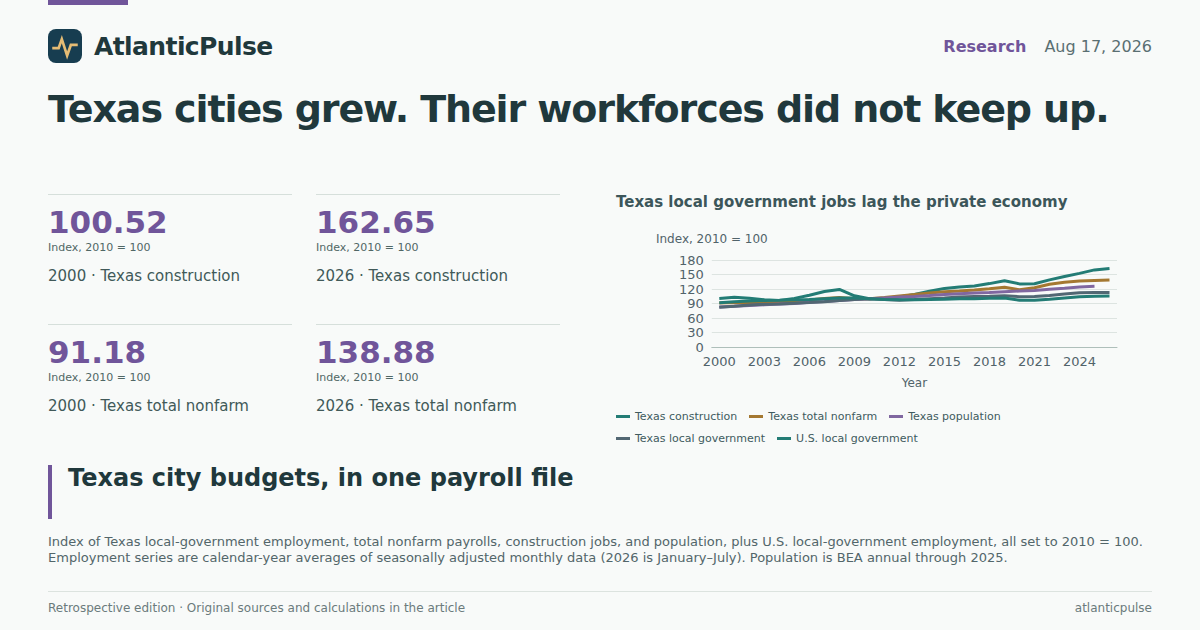
The noose, measured in payrolls
Texas’s biggest cities spent this week sounding like they had run out of money in a state that keeps adding people. Dallas faces a $51 million gap and plans more than 100 layoffs. Fort Worth is looking at $94 million. San Antonio is staring at $158 million over two years and its first property-tax increase in more than three decades. Austin already raised its rate to the legal maximum without another vote. The Texas Tribune’s reporting traces the squeeze to slower sales-tax collections, falling or flattening appraisals, public-safety pay, and a state cap that limits how much extra property-tax revenue cities can collect without going to voters — 3.5 percent a year.
That cap is a political argument. The payrolls are not. Bureau of Labor Statistics state employment files show Texas local government — cities, counties, and local school districts — employed 1.43 million people in July 2026, seasonally adjusted. That is 5.8 percent more than in July 2019. Over the same seven years, Texas total nonfarm payrolls rose 12.7 percent, and construction jobs rose 18.7 percent. BEA population estimates put the state’s resident count at 31.7 million in 2025, 9.9 percent above 2019. The public workforce that runs libraries, police departments, water systems, and classrooms added about 78,000 jobs. The rest of the Texas job market added about 1.63 million.
None of that proves the revenue cap caused the gaps Dallas and San Antonio are now briefing. It does show a long, measurable mismatch: the private economy and the population grew; the local public payroll did not keep pace. Rice University’s John Diamond told the Tribune he could not see an “out.” The employment file is less theatrical. It just keeps counting.
Texas local government jobs lag the private economy

View exact chart values
| year | tx_local_gov_index | tx_total_nonfarm_index | tx_construction_index | us_local_gov_index | tx_population_index | tx_local_gov_thousands | tx_total_nonfarm_thousands | tx_construction_thousands | note |
|---|---|---|---|---|---|---|---|---|---|
| 2000 | 82.36 | 91.18 | 100.52 | 91.38 | 82.99 | 1047.8 | 9461.6 | 567.3 | calendar-year average of seasonally adjusted monthly employment |
| 2001 | 84.41 | 91.98 | 102.87 | 93.56 | 84.47 | 1073.9 | 9544.5 | 580.6 | calendar-year average of seasonally adjusted monthly employment |
| 2002 | 86.85 | 91.04 | 100.67 | 95.39 | 85.94 | 1104.9 | 9446.7 | 568.2 | calendar-year average of seasonally adjusted monthly employment |
| 2003 | 88.37 | 90.6 | 97.75 | 96.12 | 87.29 | 1124.3 | 9401.1 | 551.7 | calendar-year average of seasonally adjusted monthly employment |
| 2004 | 89.14 | 91.81 | 96.45 | 96.73 | 88.73 | 1134.1 | 9526.8 | 544.4 | calendar-year average of seasonally adjusted monthly employment |
| 2005 | 90.59 | 94.18 | 100.45 | 97.67 | 90.25 | 1152.6 | 9772 | 567 | calendar-year average of seasonally adjusted monthly employment |
| 2006 | 91.76 | 97.32 | 107.21 | 98.55 | 92.56 | 1167.4 | 10098.5 | 605.1 | calendar-year average of seasonally adjusted monthly employment |
| 2007 | 93.51 | 100.51 | 114.73 | 99.9 | 94.43 | 1189.6 | 10429.4 | 647.6 | calendar-year average of seasonally adjusted monthly employment |
| 2008 | 96.13 | 102.58 | 119.25 | 101.32 | 96.32 | 1222.9 | 10643.5 | 673.1 | calendar-year average of seasonally adjusted monthly employment |
| 2009 | 98.41 | 99.67 | 105.92 | 101.23 | 98.27 | 1252 | 10342.1 | 597.8 | calendar-year average of seasonally adjusted monthly employment |
| 2010 | 100 | 100 | 100 | 100 | 100 | 1272.2 | 10376.3 | 564.4 | calendar-year average of seasonally adjusted monthly employment |
| 2011 | 98.47 | 102.23 | 99.94 | 98.45 | 101.54 | 1252.8 | 10607.4 | 564.1 | calendar-year average of seasonally adjusted monthly employment |
| 2012 | 96.92 | 105.21 | 103.52 | 97.68 | 103.23 | 1233.1 | 10916.8 | 584.3 | calendar-year average of seasonally adjusted monthly employment |
| 2013 | 98.14 | 108.36 | 108.64 | 97.6 | 104.74 | 1248.6 | 11243.6 | 613.2 | calendar-year average of seasonally adjusted monthly employment |
| 2014 | 99.87 | 111.75 | 115.48 | 98.03 | 106.6 | 1270.6 | 11595.2 | 651.8 | calendar-year average of seasonally adjusted monthly employment |
| 2015 | 101.64 | 114.37 | 121.13 | 98.73 | 108.54 | 1293.1 | 11867.1 | 683.6 | calendar-year average of seasonally adjusted monthly employment |
| 2016 | 103.6 | 115.8 | 124.1 | 99.63 | 110.25 | 1318 | 12016.1 | 700.4 | calendar-year average of seasonally adjusted monthly employment |
| 2017 | 104.55 | 117.88 | 126.2 | 100.02 | 111.69 | 1330.2 | 12231.4 | 712.3 | calendar-year average of seasonally adjusted monthly employment |
| 2018 | 105.16 | 120.68 | 131.1 | 100.73 | 112.96 | 1337.9 | 12522.2 | 739.9 | calendar-year average of seasonally adjusted monthly employment |
| 2019 | 106.03 | 123.49 | 137.22 | 101.41 | 114.34 | 1348.9 | 12813.3 | 774.5 | calendar-year average of seasonally adjusted monthly employment |
| 2020 | 104.09 | 118.27 | 130.61 | 96.81 | 115.85 | 1324.2 | 12271.9 | 737.2 | calendar-year average of seasonally adjusted monthly employment |
| 2021 | 104.43 | 122.66 | 130.69 | 96.85 | 117.17 | 1328.6 | 12727.9 | 737.6 | calendar-year average of seasonally adjusted monthly employment |
| 2022 | 106.69 | 129.86 | 138.79 | 98.91 | 119.33 | 1357.4 | 13474.8 | 783.4 | calendar-year average of seasonally adjusted monthly employment |
| 2023 | 109.64 | 134.15 | 145.88 | 101.4 | 121.72 | 1394.9 | 13919.6 | 823.4 | calendar-year average of seasonally adjusted monthly employment |
| 2024 | 112.22 | 136.38 | 152.31 | 103.78 | 124.09 | 1427.7 | 14150.9 | 859.6 | calendar-year average of seasonally adjusted monthly employment |
| 2025 | 112.92 | 137.83 | 159.46 | 105.06 | 125.64 | 1436.6 | 14301.8 | 900 | calendar-year average of seasonally adjusted monthly employment |
| 2026 | 112.99 | 138.88 | 162.65 | 105.49 | — | 1437.5 | 14410.8 | 918 | 2026 Jan-Jul average of seasonally adjusted monthly employment |
A thinner public layer on a thicker state
Scale the jobs by population and the squeeze is clearer. In 2010, Texas had 50.4 local-government jobs for every 1,000 residents. By 2019 that was 46.8. In 2025 it was 45.3. The United States, using the same method on national payrolls and BEA population, sat at 44.2 local-government jobs per 1,000 people in both 2019 and 2025. Texas still staffs a bit more heavily than the country. The extra layer has been sanded down.
Local government’s share of Texas nonfarm jobs slipped from 12.3 percent in 2010 to 10.5 percent in 2019 and 10.0 percent in 2025. That is not a collapse. It is a slow leak while the state added 6.5 million people after 2010. U.S. local-government employment rose only 3.9 percent from July 2019 to July 2026, so Texas is not uniquely stingy by national standards. It is uniquely busy. A state that grew almost 10 percent in six years cannot run 2010-sized city halls at 2010 staffing ratios and expect the same libraries to stay open.
The BLS local-government total is an awkward instrument for a mayor. School districts dominate it. A Dallas library-hour cut and an Austin ISD classroom hire live in the same number. That is a feature as well as a bug. When Texas cities complain they are being asked to police, pave, and educate a larger state on a capped tax base, the combined local public payroll is the workforce that actually does those things.
Fewer local-government workers for each Texas resident

View exact chart values
| year | texas_local_gov_jobs_per_1000_residents | us_local_gov_jobs_per_1000_residents | texas_local_gov_share_of_nonfarm_pct |
|---|---|---|---|
| 2000 | 50.03 | 46.56 | 11.07 |
| 2001 | 50.37 | 47.2 | 11.25 |
| 2002 | 50.94 | 47.68 | 11.7 |
| 2003 | 51.03 | 47.64 | 11.96 |
| 2004 | 50.64 | 47.49 | 11.9 |
| 2005 | 50.6 | 47.51 | 11.79 |
| 2006 | 49.98 | 47.48 | 11.56 |
| 2007 | 49.92 | 47.68 | 11.41 |
| 2008 | 50.31 | 47.9 | 11.49 |
| 2009 | 50.48 | 47.44 | 12.11 |
| 2010 | 50.41 | 46.47 | 12.26 |
| 2011 | 48.88 | 45.39 | 11.81 |
| 2012 | 47.33 | 44.68 | 11.3 |
| 2013 | 47.24 | 44.3 | 11.11 |
| 2014 | 47.23 | 44.15 | 10.96 |
| 2015 | 47.2 | 44.1 | 10.9 |
| 2016 | 47.37 | 44.16 | 10.97 |
| 2017 | 47.19 | 44.03 | 10.88 |
| 2018 | 46.93 | 44.08 | 10.68 |
| 2019 | 46.75 | 44.15 | 10.53 |
| 2020 | 45.29 | 41.97 | 10.79 |
| 2021 | 44.93 | 41.93 | 10.44 |
| 2022 | 45.07 | 42.57 | 10.07 |
| 2023 | 45.41 | 43.29 | 10.02 |
| 2024 | 45.59 | 43.88 | 10.09 |
| 2025 | 45.3 | 44.19 | 10.04 |
Austin sprinted. City staffing jogged.
The mismatch is not evenly spread. Using 12-month averages to smooth the school-year swing in unadjusted metro data, Austin-Round Rock-San Marcos added total nonfarm jobs at a 28.2 percent clip from the year ending July 2019 to the year ending July 2026. Local-government jobs there rose 14.4 percent. Dallas-Fort Worth-Arlington grew 16.4 percent overall and 8.8 percent in local government. Houston-Pasadena-The Woodlands: 11.2 percent versus 9.5 percent. San Antonio-New Braunfels is the exception that proves the pattern — 11.2 percent overall, 11.3 percent in local government. It matched. The others did not.
Plot those four metros and Austin sits farthest from a one-for-one line. That is the same city whose voters rejected a tax increase, then watched the council take the rate to the cap anyway, adding $195 a year for a typical home. San Antonio, considering a $2.95-a-month bump and $90 million in cuts, at least grew its local public payroll in line with the metro. Dallas, planning layoffs and shorter library hours while hiring toward 700 more officers, is the large metro where private payrolls lapped city and school staffing by the widest gap after Austin.
Metro totals still mix suburbs, counties, and independent school districts. They are not the City of Dallas budget. They are the labor market those budgets hire from. When city managers say public safety is eating everything else, the employment file is consistent with a workforce that grew, just not as fast as the tax base they were told would grow forever.
Austin and Dallas grew much faster than their city workforces

View exact chart values
| metro | local_government_pct | total_nonfarm_pct |
|---|---|---|
| Austin-Round Rock-San Marcos | 14.4 | 28.2 |
| Dallas-Fort Worth-Arlington | 8.8 | 16.4 |
| Houston-Pasadena-The Woodlands | 9.5 | 11.2 |
| San Antonio-New Braunfels | 11.3 | 11.2 |
Where private payrolls boomed, city staffing lagged furthest

View exact chart values
| metro | total_nonfarm_pct | local_government_pct |
|---|---|---|
| Dallas-Fort Worth-Arlington | 16.4 | 8.8 |
| Houston-Pasadena-The Woodlands | 11.2 | 9.5 |
| Austin-Round Rock-San Marcos | 28.2 | 14.4 |
| San Antonio-New Braunfels | 11.2 | 11.3 |
Pay went up. Housing went up faster.
The people who do work for Texas local government are not cheaper. BEA compensation paid by local government rose from $87.2 billion in 2019 to $109.1 billion in 2024, about $76,400 per worker, up from $64,700. That 18 percent jump in pay per job is why a modest headcount increase can still blow a hole in a budget that is not allowed to collect 18 percent more property tax. The Tribune noted police and firefighter raises and overtime as a major driver. The compensation line of the income accounts agrees, without naming a union.
Households on the other side of the counter had their own problem. Nominal per capita personal income in Texas rose 35.8 percent from 2019 to 2025, to $72,364, a hair slower than the national 37.5 percent. After regional prices, real per capita income (2017 dollars) was up 11.2 percent from 2019 to 2024. Per-person spending on housing and utilities, including the imputed rent on owner-occupied homes, rose 41.5 percent over those five years, to $9,999. Housing’s share of per capita income went from 13.3 percent to 14.3 percent. The country saw a similar lift in the housing bill, 36.6 percent, but Texas closed part of a long discount: the state’s housing regional price parity rose from 88.0 in 2008 to 95.8 in 2019 and 96.5 in 2024, still below the U.S. average of 100.
That combination — a housing cost that outran real income, and a local public payroll whose pay outran its headcount — is the household version of the briefing in Dallas City Hall. An Austin homeowner paying $195 more to the city is also paying more for the house itself. Diamond’s warning that inflation and a slower economy will not let up soon is not visible as a recession in the job count. It is visible as a cost structure. Construction employment, the industry that is supposed to grow the tax base the Tribune’s housing experts want, is 62.6 percent above July 2010. Local government is 12.2 percent above. The buildings arrived. The staff to serve them did not, not in matching numbers.
Housing bills outran real Texas incomes after 2019

View exact chart values
| year | housing_pce_per_capita_index | nominal_pcpi_index | real_pcpi_index |
|---|---|---|---|
| 2008 | 77.27 | 74.79 | 88.01 |
| 2009 | 77.39 | 69.9 | 82.82 |
| 2010 | 80.08 | 73.04 | 84.21 |
| 2011 | 81.16 | 78.73 | 89.15 |
| 2012 | 80.68 | 82.35 | 90.85 |
| 2013 | 83.37 | 83.35 | 90.37 |
| 2014 | 86.48 | 87.75 | 93.53 |
| 2015 | 88.51 | 87.79 | 93.58 |
| 2016 | 90.87 | 86.1 | 91.1 |
| 2017 | 92.45 | 91.09 | 95.37 |
| 2018 | 95.91 | 96.39 | 98.49 |
| 2019 | 100 | 100 | 100 |
| 2020 | 104.86 | 102.92 | 101.6 |
| 2021 | 111.21 | 113.38 | 107.83 |
| 2022 | 123.33 | 119.69 | 107.85 |
| 2023 | 132.62 | 126.75 | 110.25 |
| 2024 | 141.55 | 130.96 | 111.23 |
| 2025 | — | 135.84 | — |
What the cap cannot explain
Two honest limits. First, these figures cannot say the 3.5 percent revenue cap caused the gaps. Texas local-government jobs per 1,000 residents were already falling in the 2010s, before the current cap. The post-2019 period continued a slide rather than inventing one. Second, city property-tax collections are not in this catalogue. BEA “personal current taxes” paid to local governments are a different concept — they omit the property taxes that NIPA treats as taxes on production — and were not used. What is measured is the workforce cities and school districts employ, the population they serve, the pay they offer, and the housing costs their residents carry.
The payoff for readers of this week’s budget fights is modest and useful. Texas did not stop hiring local public workers. It hired them more slowly than it hired everyone else, and more slowly than it added residents, while paying those workers more and while housing took a larger share of income. Dallas cutting library hours to protect police overtime is not a paradox in that file. It is what a 5.8 percent public headcount increase looks like next to a 12.7 percent private one, on a tax instrument the Legislature has deliberately blunted. If the next session tightens the cap further, as Gov. Greg Abbott wants, the employment series will not need a press release to record the sequel. It will just print a smaller number next July.
Sources and methods
This is retrospective enrichment using pinned catalogue snapshots, not a reconstruction of what was knowable on the 17 August 2026 edition date. Later revisions may be present.
Research date of the extracts: 11 September 2026. Historical edition date: 17 August 2026.
Employment: BLS State and Area Employment (SAE) and Current Employment Statistics (CES), snapshot 24 August 2026 (release id bls-sm-snapshot-2026-08-24 / bls-ce-snapshot-2026-08-24). Statewide Texas local government, total nonfarm, and construction, and U.S. local government, are seasonally adjusted monthly series, January 2000–July 2026. Metro local-government series are not seasonally adjusted; 12-month averages ending July 2019 and July 2026 are used so school-year summer drops do not dominate. Metro total nonfarm series are seasonally adjusted and averaged over the same windows. Local government includes cities, counties, and local school districts. Missing values were skipped, not treated as zero. Duplicate annual/monthly SAE encodings of the same source series were not mixed.
Population, nominal per capita personal income, and local-government compensation: BEA SAINC annual state accounts, release bea-regional-state-annual-2026-04-09, years 2000–2025 where published. Compensation ends in 2024. Units preserved (persons; dollars; thousands of dollars). Compensation per worker divides annual compensation by the calendar-year average of seasonally adjusted local-government employment.
Real per capita personal income (constant 2017 dollars) and housing regional price parities: BEA SARPI/SARPP, release bea-rpp-2026-02-19, years 2008–2024. Housing RPP is an index with United States = 100.
Housing and utilities personal consumption expenditures per capita: BEA SAPCE, release bea-sapce-2025-09-26, years 2000–2024. The series includes tenant rent, imputed rent on owner-occupied dwellings, farm and group housing, and household utilities. It is not a property-tax bill.
BEA personal current taxes paid to local governments were inspected and not used; they are not a measure of city property-tax collections.
No causal claim is made about the 3.5 percent revenue cap, appraisal protests, or any single ordinance. Comparisons are descriptive. Aggregate payrolls are not household averages. Metro areas are not city corporate limits.
Research completed 2026-09-11, for the August 17, 2026 news edition. This is retrospective analysis, not a reconstruction of information available that day.
- U.S. Bureau of Labor Statistics, State and Area Employment: Source 1, Source 2
- U.S. Bureau of Labor Statistics, Current Employment Statistics: Source 1, Source 2
- U.S. Bureau of Economic Analysis, annual state personal income and population: Source 1, Source 2
- U.S. Bureau of Economic Analysis, regional price parities and real personal income: Source 1, Source 2
- U.S. Bureau of Economic Analysis, personal consumption expenditures by state: Source 1, Source 2