Research
Puerto Rico already has more jobs than Wyoming. It still has not got its peak back.
A mid-small payroll, not a rounding error
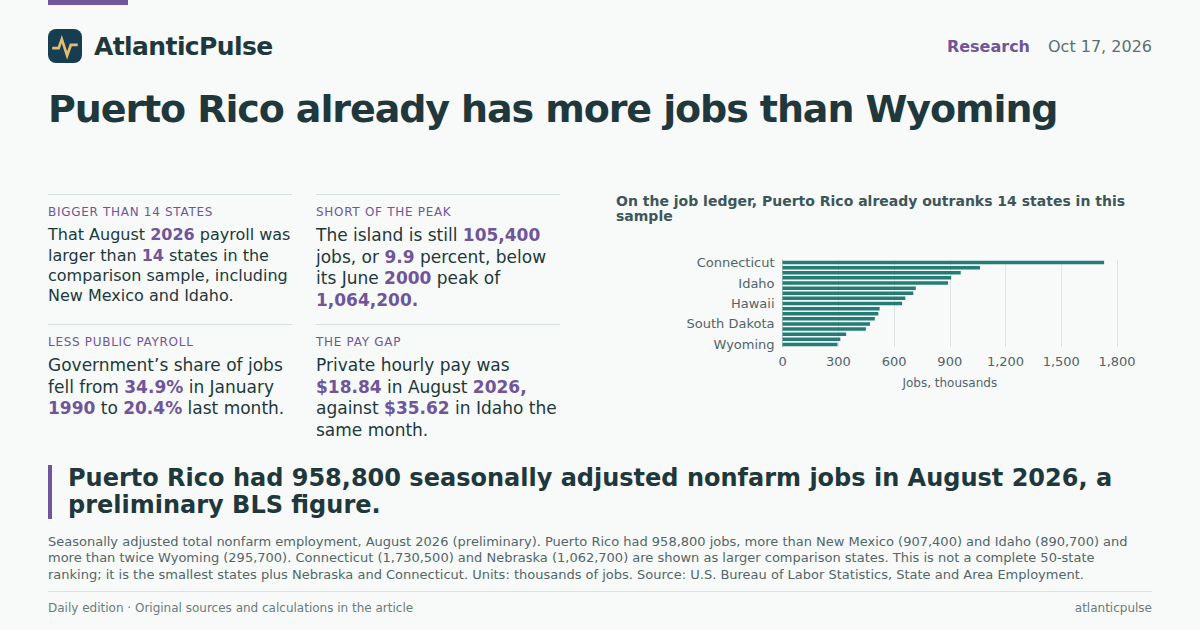
On Friday, Governor Jenniffer González signed House Joint Resolution 391, an official request that President Trump and Congress admit Puerto Rico as a state. The politics of that ask are old. The job count is more specific. In August 2026, the Bureau of Labor Statistics counted 958,800 seasonally adjusted nonfarm jobs on the island, a preliminary figure. That is not a territory-sized footnote. It is more jobs than New Mexico (907,400) or Idaho (890,700), more than twice Wyoming (295,700), and more than Vermont, Alaska, both Dakotas, Delaware, Rhode Island, Montana, Hawaii, Maine, New Hampshire and West Virginia in the same month.
The comparison is a sample of small states plus Nebraska and Connecticut, not a full 50-state ranking, and it says nothing about output, income or voting power. It does answer the size question the application raises. If Congress treated Puerto Rico as a state tomorrow, it would not be adding the smallest job market in the union. It would be adding one that already sits between New Mexico and Nebraska on the official payroll — a mid-small labor market, not a rounding error. Connecticut, at 1,730,500 jobs, remains in another league. The island is not asking to join as a peer of Texas. It is asking to join as something closer to Idaho with a Caribbean commute.
On the job ledger, Puerto Rico already outranks 14 states in this sample

View exact chart values
| place | jobs_thousands | is_pr | status |
|---|---|---|---|
| Connecticut | 1730.5 | 0 | footnote:P |
| Nebraska | 1062.7 | 0 | footnote:P |
| Puerto Rico | 958.8 | 1 | footnote:P |
| New Mexico | 907.4 | 0 | footnote:P |
| Idaho | 890.7 | 0 | footnote:P |
| West Virginia | 717.1 | 0 | footnote:P |
| New Hampshire | 703.3 | 0 | footnote:P |
| Maine | 660.2 | 0 | footnote:P |
| Hawaii | 643 | 0 | footnote:P |
| Montana | 522.1 | 0 | footnote:P |
| Rhode Island | 515.1 | 0 | footnote:P |
| Delaware | 496.4 | 0 | footnote:P |
| South Dakota | 470.2 | 0 | footnote:P |
| North Dakota | 448.3 | 0 | footnote:P |
| Alaska | 341.8 | 0 | footnote:P |
| Vermont | 310.6 | 0 | footnote:P |
| Wyoming | 295.7 | 0 | footnote:P |
The missing 105,000 jobs
Size is not the same as recovery. Puerto Rico’s seasonally adjusted payroll peaked at 1,064,200 in June 2000. August 2026 was still 105,400 jobs, or 9.9 percent, below that high. January snapshots make the long slide easier to see: 1,055,400 jobs in January 2006, 941,300 in January 2010, 889,100 on the eve of 2017, then a climb that has only recently pushed the island back above 950,000. The private payroll did more of the recent lifting. Private jobs were 548,700 in January 1990 and 763,000 in August 2026. Government jobs went the other way, from 294,200 to 195,800.
That mix shift is the quiet story inside the headline. Government was 34.9 percent of the island’s jobs in January 1990 and 20.4 percent last month. Among the comparison states, that share now looks ordinary: Hawaii 19.6 percent, New Mexico 21.5 percent, Alaska 22.8 percent, Wyoming 24.1 percent. Connecticut, the large-state check, is 13.6 percent. Puerto Rico is no longer the public-payroll outlier it was a generation ago. It is a place where the government shrank and the factories shrank faster.
Puerto Rico’s payroll never fully recaptured its 2000s peak

View exact chart values
| year | total_thousands | private_thousands | government_thousands | manufacturing_thousands | gov_share_pct |
|---|---|---|---|---|---|
| 1990 | 842.9 | 548.7 | 294.2 | 159.5 | 34.9 |
| 1991 | 835.1 | 547.7 | 287.4 | 154.7 | 34.4 |
| 1992 | 848.7 | 555.5 | 293.2 | 154.2 | 34.5 |
| 1993 | 867.3 | 574.4 | 292.9 | 155.5 | 33.8 |
| 1994 | 884.1 | 588.8 | 295.3 | 154.8 | 33.4 |
| 1995 | 918.6 | 616.2 | 302.4 | 159.8 | 32.9 |
| 1996 | 952.9 | 646.1 | 306.8 | 161.1 | 32.2 |
| 1997 | 987.5 | 675.5 | 312 | 155.4 | 31.6 |
| 1998 | 993.6 | 684.8 | 308.8 | 150.6 | 31.1 |
| 1999 | 1003.4 | 703.1 | 300.3 | 145.6 | 29.9 |
| 2000 | 1009.2 | 730.1 | 279.1 | 143.8 | 27.7 |
| 2001 | 1014.6 | 731.9 | 282.7 | 138.9 | 27.9 |
| 2002 | 1003.8 | 711.6 | 292.2 | 123.2 | 29.1 |
| 2003 | 1011.8 | 715.8 | 296 | 117.6 | 29.3 |
| 2004 | 1038.7 | 735.1 | 303.6 | 119 | 29.2 |
| 2005 | 1052.1 | 746.2 | 305.9 | 118.2 | 29.1 |
| 2006 | 1055.4 | 751.1 | 304.3 | 112.5 | 28.8 |
| 2007 | 1037 | 737.6 | 299.4 | 107.9 | 28.9 |
| 2008 | 1020.9 | 725.5 | 295.4 | 103.5 | 28.9 |
| 2009 | 990.5 | 693.2 | 297.3 | 96.7 | 30 |
| 2010 | 941.3 | 667.4 | 273.9 | 88.6 | 29.1 |
| 2011 | 922.2 | 662.7 | 259.5 | 85.8 | 28.1 |
| 2012 | 934.3 | 674.4 | 259.9 | 84.9 | 27.8 |
| 2013 | 936.9 | 683.5 | 253.4 | 78 | 27 |
| 2014 | 915.8 | 679.9 | 235.9 | 75.6 | 25.8 |
| 2015 | 906.9 | 673.3 | 233.6 | 74.9 | 25.8 |
| 2016 | 896.4 | 668.1 | 228.3 | 74.3 | 25.5 |
| 2017 | 889.1 | 667 | 222.1 | 73 | 25 |
| 2018 | 849.4 | 637.8 | 211.6 | 70.4 | 24.9 |
| 2019 | 875.1 | 672.3 | 202.8 | 74.2 | 23.2 |
| 2020 | 880.1 | 682.1 | 198 | 75.3 | 22.5 |
| 2021 | 851.3 | 655.3 | 196 | 75.8 | 23 |
| 2022 | 912.9 | 719.8 | 193.1 | 81.3 | 21.2 |
| 2023 | 933.2 | 735 | 198.2 | 82.1 | 21.2 |
| 2024 | 951.9 | 751.5 | 200.4 | 84.5 | 21.1 |
| 2025 | 953 | 756.4 | 196.6 | 81.5 | 20.6 |
| 2026 | 949.9 | 757.4 | 192.5 | 80.4 | 20.3 |
Puerto Rico’s government share is no longer an outlier among small states

View exact chart values
| place | gov_share_pct | gov_thousands | total_thousands |
|---|---|---|---|
| Connecticut | 13.6 | 234.8 | 1730.5 |
| Hawaii | 19.6 | 126.1 | 643 |
| Puerto Rico | 20.4 | 195.8 | 958.8 |
| New Mexico | 21.5 | 195.3 | 907.4 |
| Alaska | 22.8 | 77.9 | 341.8 |
| Wyoming | 24.1 | 71.4 | 295.7 |
Trade and government still do the hiring. Manufacturing does not.
August’s industry split is blunt. Government accounted for 195,800 jobs, 20.4 percent of the total, and 123,500 of those were territorial (state) government — 63.1 percent of the public payroll — with 52,300 in local government and 20,000 federal. Trade, transportation and utilities were almost as large, at 192,700 jobs (20.1 percent). Private education and health contributed 128,600 (13.4 percent) and leisure and hospitality 104,600 (10.9 percent). Manufacturing, once a pillar, was 81,400 jobs, 8.5 percent. Construction was 39,100, 4.1 percent.
The factory loss is not a rounding error either. Manufacturing employment was 159,500 in January 1990. It is about half that now, a 49 percent decline. A residual “other private” slice of 216,600 jobs — total private minus the named supersectors above — covers professional services, finance, information and the rest; it is not a published BLS category, so it should not be read as a single industry. The published pieces are enough. The island that would become a state still leans on shops, government offices, hospitals and hotels. The plants that used to fill the other column have not come back.
Trade and government still dominate Puerto Rico’s job mix

View exact chart values
| industry | jobs_thousands | share_pct |
|---|---|---|
| Other private | 216.6 | 22.6 |
| Government | 195.8 | 20.4 |
| Trade, transportation and utilities | 192.7 | 20.1 |
| Private education and health | 128.6 | 13.4 |
| Leisure and hospitality | 104.6 | 10.9 |
| Manufacturing | 81.4 | 8.5 |
| Construction | 39.1 | 4.1 |
Two shocks, one long climb
The monthly series from 2016 onward is a disaster timeline with a stubborn upslope. Seasonally adjusted jobs were 874,300 in August 2017 and 826,400 in October 2017, after Hurricane Maria. They were 883,000 in February 2020 and 767,500 in April 2020, when the pandemic hit. Those are calendar coincidences, not a causal model: BLS does not stamp “Maria” or “COVID” on the observations. They are, however, the two deepest cuts of the past decade, and both have been more than reversed in the job count. August 2026’s 958,800 is above the pre-Maria and pre-pandemic levels in this series.
Reversal of the shocks is not the same as reversal of the 2000s. The island has climbed out of two holes and is still looking up at a peak from when manufacturing had not yet halved. Private average hourly earnings, not seasonally adjusted, were $18.84 in August 2026, up from $13.50 in January 2015. Idaho, a state with a slightly smaller payroll, paid $35.62 an hour the same month. That is a different kind of gap than the headcount. Statehood would add senators and a House seat. It would not, by itself, close a pay gap in which Puerto Rico’s private hourly wage is about 53 percent of Idaho’s. The BLS files do not say whether that is productivity, industry mix, or the unfinished business of two decades of lost factories. They do say the job market Congress is being asked to admit is real, mid-sized among small states, less government-heavy than it used to be — and still short of the payroll it had when the last century ended.
Maria and COVID cut deep. The payroll has climbed back past both.

View exact chart values
| period | year | month | total_thousands |
|---|---|---|---|
| 2016-01 | 2016 | 1 | 896.4 |
| 2016-02 | 2016 | 2 | 894 |
| 2016-03 | 2016 | 3 | 893.5 |
| 2016-04 | 2016 | 4 | 893.7 |
| 2016-05 | 2016 | 5 | 893 |
| 2016-06 | 2016 | 6 | 892.5 |
| 2016-07 | 2016 | 7 | 894.3 |
| 2016-08 | 2016 | 8 | 893.2 |
| 2016-09 | 2016 | 9 | 897.1 |
| 2016-10 | 2016 | 10 | 898 |
| 2016-11 | 2016 | 11 | 893.2 |
| 2016-12 | 2016 | 12 | 892 |
| 2017-01 | 2017 | 1 | 889.1 |
| 2017-02 | 2017 | 2 | 887.2 |
| 2017-03 | 2017 | 3 | 886.8 |
| 2017-04 | 2017 | 4 | 883.9 |
| 2017-05 | 2017 | 5 | 884.4 |
| 2017-06 | 2017 | 6 | 883.7 |
| 2017-07 | 2017 | 7 | 873.6 |
| 2017-08 | 2017 | 8 | 874.3 |
| 2017-09 | 2017 | 9 | 866.6 |
| 2017-10 | 2017 | 10 | 826.4 |
| 2017-11 | 2017 | 11 | 839.4 |
| 2017-12 | 2017 | 12 | 856.4 |
| 2018-01 | 2018 | 1 | 849.4 |
| 2018-02 | 2018 | 2 | 852.4 |
| 2018-03 | 2018 | 3 | 854.1 |
| 2018-04 | 2018 | 4 | 861.3 |
| 2018-05 | 2018 | 5 | 864.5 |
| 2018-06 | 2018 | 6 | 868.4 |
| 2018-07 | 2018 | 7 | 869.1 |
| 2018-08 | 2018 | 8 | 869.9 |
| 2018-09 | 2018 | 9 | 869.7 |
| 2018-10 | 2018 | 10 | 866 |
| 2018-11 | 2018 | 11 | 869.5 |
| 2018-12 | 2018 | 12 | 866.5 |
| 2019-01 | 2019 | 1 | 875.1 |
| 2019-02 | 2019 | 2 | 876 |
| 2019-03 | 2019 | 3 | 878.8 |
| 2019-04 | 2019 | 4 | 878.5 |
| 2019-05 | 2019 | 5 | 880.1 |
| 2019-06 | 2019 | 6 | 884.4 |
| 2019-07 | 2019 | 7 | 880.4 |
| 2019-08 | 2019 | 8 | 880.6 |
| 2019-09 | 2019 | 9 | 884.7 |
| 2019-10 | 2019 | 10 | 883.1 |
| 2019-11 | 2019 | 11 | 882.7 |
| 2019-12 | 2019 | 12 | 880.8 |
| 2020-01 | 2020 | 1 | 880.1 |
| 2020-02 | 2020 | 2 | 883 |
| 2020-03 | 2020 | 3 | 884.6 |
| 2020-04 | 2020 | 4 | 767.5 |
| 2020-05 | 2020 | 5 | 775.3 |
| 2020-06 | 2020 | 6 | 803.2 |
| 2020-07 | 2020 | 7 | 823.8 |
| 2020-08 | 2020 | 8 | 832.3 |
| 2020-09 | 2020 | 9 | 838.6 |
| 2020-10 | 2020 | 10 | 842.7 |
| 2020-11 | 2020 | 11 | 845 |
| 2020-12 | 2020 | 12 | 846 |
| 2021-01 | 2021 | 1 | 851.3 |
| 2021-02 | 2021 | 2 | 853 |
| 2021-03 | 2021 | 3 | 857.9 |
| 2021-04 | 2021 | 4 | 866.3 |
| 2021-05 | 2021 | 5 | 866.8 |
| 2021-06 | 2021 | 6 | 874.3 |
| 2021-07 | 2021 | 7 | 888.8 |
| 2021-08 | 2021 | 8 | 887.8 |
| 2021-09 | 2021 | 9 | 894.8 |
| 2021-10 | 2021 | 10 | 902.4 |
| 2021-11 | 2021 | 11 | 904.5 |
| 2021-12 | 2021 | 12 | 908.1 |
| 2022-01 | 2022 | 1 | 912.9 |
| 2022-02 | 2022 | 2 | 915.2 |
| 2022-03 | 2022 | 3 | 918.7 |
| 2022-04 | 2022 | 4 | 915.9 |
| 2022-05 | 2022 | 5 | 917.1 |
| 2022-06 | 2022 | 6 | 922.3 |
| 2022-07 | 2022 | 7 | 925.6 |
| 2022-08 | 2022 | 8 | 927.4 |
| 2022-09 | 2022 | 9 | 930.7 |
| 2022-10 | 2022 | 10 | 935.3 |
| 2022-11 | 2022 | 11 | 938 |
| 2022-12 | 2022 | 12 | 947.4 |
| 2023-01 | 2023 | 1 | 933.2 |
| 2023-02 | 2023 | 2 | 935.8 |
| 2023-03 | 2023 | 3 | 938.4 |
| 2023-04 | 2023 | 4 | 940 |
| 2023-05 | 2023 | 5 | 942.1 |
| 2023-06 | 2023 | 6 | 940.8 |
| 2023-07 | 2023 | 7 | 942.2 |
| 2023-08 | 2023 | 8 | 946.9 |
| 2023-09 | 2023 | 9 | 950.8 |
| 2023-10 | 2023 | 10 | 949.8 |
| 2023-11 | 2023 | 11 | 952.8 |
| 2023-12 | 2023 | 12 | 951.8 |
| 2024-01 | 2024 | 1 | 951.9 |
| 2024-02 | 2024 | 2 | 953.2 |
| 2024-03 | 2024 | 3 | 955 |
| 2024-04 | 2024 | 4 | 952.9 |
| 2024-05 | 2024 | 5 | 954.4 |
| 2024-06 | 2024 | 6 | 951.9 |
| 2024-07 | 2024 | 7 | 952 |
| 2024-08 | 2024 | 8 | 953.6 |
| 2024-09 | 2024 | 9 | 956.5 |
| 2024-10 | 2024 | 10 | 954.2 |
| 2024-11 | 2024 | 11 | 952.5 |
| 2024-12 | 2024 | 12 | 949.4 |
| 2025-01 | 2025 | 1 | 953 |
| 2025-02 | 2025 | 2 | 951.1 |
| 2025-03 | 2025 | 3 | 953.9 |
| 2025-04 | 2025 | 4 | 954.6 |
| 2025-05 | 2025 | 5 | 954.9 |
| 2025-06 | 2025 | 6 | 954 |
| 2025-07 | 2025 | 7 | 949.1 |
| 2025-08 | 2025 | 8 | 950.1 |
| 2025-09 | 2025 | 9 | 947.4 |
| 2025-10 | 2025 | 10 | 949.2 |
| 2025-11 | 2025 | 11 | 950.2 |
| 2025-12 | 2025 | 12 | 949.6 |
| 2026-01 | 2026 | 1 | 949.9 |
| 2026-02 | 2026 | 2 | 951.7 |
| 2026-03 | 2026 | 3 | 953.9 |
| 2026-04 | 2026 | 4 | 958 |
| 2026-05 | 2026 | 5 | 952.5 |
| 2026-06 | 2026 | 6 | 955.9 |
| 2026-07 | 2026 | 7 | 957.8 |
| 2026-08 | 2026 | 8 | 958.8 |
Sources and methods
Payroll figures are from the U.S. Bureau of Labor Statistics State and Area Employment program, using the pinned snapshot released as bls-sm-snapshot-2026-08-24, with observations through August 2026. August 2026 values carry BLS preliminary footnotes.
Long-run lines use January of each year so the chart is annual, not a monthly scribble; the latest total cited in the text is the August 2026 preliminary month. The 2016–2026 recovery chart is monthly and seasonally adjusted.
Government shares divide seasonally adjusted government employment by seasonally adjusted total nonfarm employment in the same month. Industry shares use published supersectors. “Other private” is a residual (total private minus manufacturing, construction, leisure and hospitality, trade-transportation-utilities, and private education and health) and is not a BLS supersector.
The state comparison is a sample of small states plus Nebraska and Connecticut. It is not a complete 50-state ranking and should not be read as Puerto Rico’s exact place among all states. The catalogue has no BEA GDP or personal-income series for Puerto Rico, so this package does not measure output, household income or fiscal capacity.
Average hourly earnings are not seasonally adjusted private-sector wages for all employees. The Idaho comparison uses the same concept and month. Maria and COVID dates are calendar markers next to published job counts, not estimated storm or pandemic effects. Observation dates are not release dates.
Research completed 2026-10-18, for the October 17, 2026 news edition. The available source data may cover earlier periods; see the observation periods and source vintages above.