Research
Pennsylvania already has a drug industry. The new plants are a rounding error on the payroll.
A second $800 million, on a factory floor that is already there
Governor Josh Shapiro’s pitch is that Pennsylvania keeps winning the biopharma lottery. GSK will invest more than $800 million in a hub in Upper Merion Township, with construction planned for 2027 and more than 300 jobs. It is the company’s second $800 million Pennsylvania expansion since 2024, after Lancaster County. Eli Lilly is putting $3.5 billion into its first manufacturing plant in Lehigh County, with at least 850 permanent jobs. Johnson & Johnson is putting $1 billion into a cell-therapy plant in Montgomery County and 500 skilled biomanufacturing jobs. Add those three announcements and you get $5.3 billion of promised capital and 1,650 permanent factory jobs — before counting Lilly’s separate estimate of about 2,000 construction jobs.
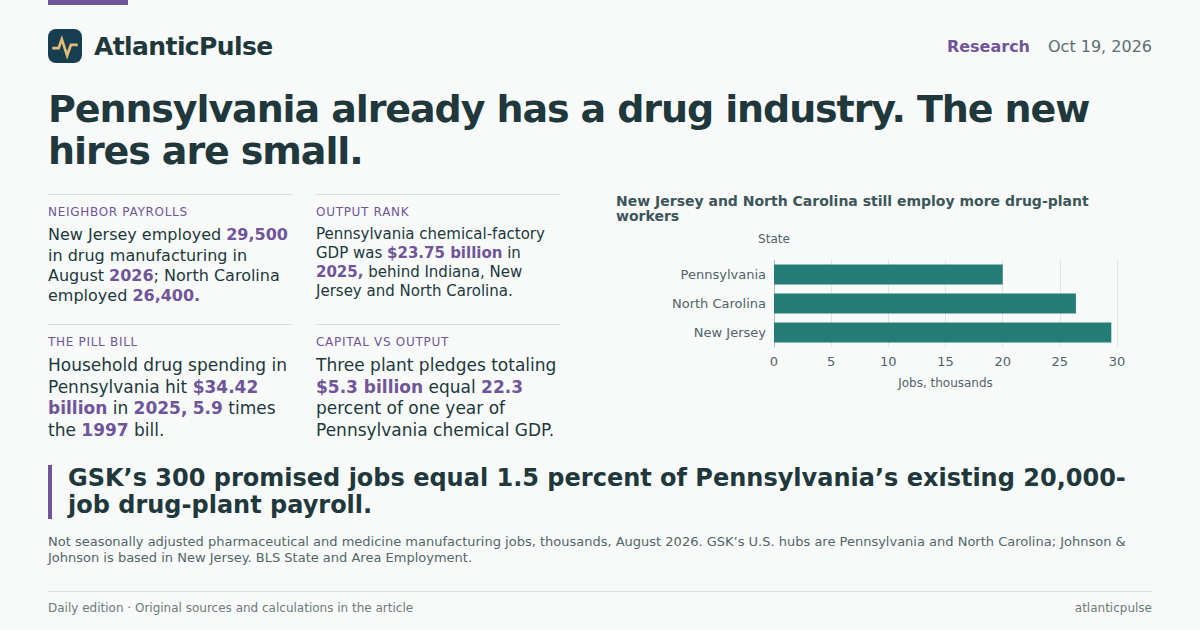
Those are real commitments. They are also small next to the industry Pennsylvania already books. In August 2026, the state employed 20,000 people in pharmaceutical and medicine manufacturing, not seasonally adjusted, according to the Bureau of Labor Statistics. GSK’s 300 promised jobs are 1.5 percent of that payroll. The three companies’ 1,650 permanent jobs together are 8.2 percent. An $800 million check is 3.4 percent of Pennsylvania’s $23.75 billion in chemical-manufacturing GDP in 2025; the $5.3 billion combined is 22 percent of one year’s output, not a new industry.
Pennsylvania drug-plant jobs have stalled just above 20,000

View exact chart values
| month | pharma_thousands | chemical_thousands |
|---|---|---|
| 2015-01 | 18.2 | 40.8 |
| 2015-02 | 18.2 | 40.8 |
| 2015-03 | 18.2 | 40.8 |
| 2015-04 | 18.2 | 40.8 |
| 2015-05 | 18.5 | 41.2 |
| 2015-06 | 18.3 | 41.2 |
| 2015-07 | 18.5 | 41.4 |
| 2015-08 | 18.4 | 41.2 |
| 2015-09 | 18.4 | 41 |
| 2015-10 | 18.4 | 40.7 |
| 2015-11 | 18.4 | 40.8 |
| 2015-12 | 18.5 | 40.9 |
| 2016-01 | 18.4 | 40.7 |
| 2016-02 | 18.5 | 40.8 |
| 2016-03 | 18.5 | 40.8 |
| 2016-04 | 18.5 | 40.7 |
| 2016-05 | 18.6 | 41 |
| 2016-06 | 18.7 | 41.4 |
| 2016-07 | 18.5 | 41.4 |
| 2016-08 | 18.7 | 41.5 |
| 2016-09 | 18.6 | 41.1 |
| 2016-10 | 18.7 | 41.1 |
| 2016-11 | 18.7 | 41.2 |
| 2016-12 | 18.8 | 41.4 |
| 2017-01 | 18.6 | 41.2 |
| 2017-02 | 18.5 | 41.1 |
| 2017-03 | 18.6 | 41.2 |
| 2017-04 | 18.8 | 41.5 |
| 2017-05 | 18.9 | 41.7 |
| 2017-06 | 18.9 | 41.8 |
| 2017-07 | 18.7 | 41.8 |
| 2017-08 | 18.7 | 41.8 |
| 2017-09 | 18.5 | 41.2 |
| 2017-10 | 18.4 | 41 |
| 2017-11 | 18.3 | 40.9 |
| 2017-12 | 18.3 | 41 |
| 2018-01 | 18.1 | 40.7 |
| 2018-02 | 18.1 | 40.6 |
| 2018-03 | 17.8 | 40.3 |
| 2018-04 | 17.8 | 40.4 |
| 2018-05 | 18 | 40.7 |
| 2018-06 | 18.2 | 41.1 |
| 2018-07 | 18.2 | 41.4 |
| 2018-08 | 18.4 | 41.4 |
| 2018-09 | 18.4 | 41.3 |
| 2018-10 | 18.6 | 41.4 |
| 2018-11 | 18.8 | 41.7 |
| 2018-12 | 18.9 | 42.1 |
| 2019-01 | 18.8 | 41.8 |
| 2019-02 | 19 | 42.1 |
| 2019-03 | 19.1 | 42.2 |
| 2019-04 | 18.8 | 42 |
| 2019-05 | 18.8 | 42.1 |
| 2019-06 | 18.9 | 42.6 |
| 2019-07 | 19 | 43.1 |
| 2019-08 | 18.8 | 42.7 |
| 2019-09 | 18.9 | 42.4 |
| 2019-10 | 19 | 42.5 |
| 2019-11 | 19 | 42.6 |
| 2019-12 | 19.2 | 42.7 |
| 2020-01 | 19.2 | 42.6 |
| 2020-02 | 19.2 | 42.6 |
| 2020-03 | 19.4 | 42.7 |
| 2020-04 | 19.2 | 42 |
| 2020-05 | 19.4 | 40.6 |
| 2020-06 | 19.7 | 42 |
| 2020-07 | 19.7 | 42.3 |
| 2020-08 | 19.8 | 42.3 |
| 2020-09 | 19.9 | 42.3 |
| 2020-10 | 19.8 | 42.2 |
| 2020-11 | 19.9 | 42.5 |
| 2020-12 | 20.2 | 42.7 |
| 2021-01 | 20.2 | 43.1 |
| 2021-02 | 20.1 | 43.2 |
| 2021-03 | 20.6 | 43.7 |
| 2021-04 | 20.5 | 43.4 |
| 2021-05 | 20.5 | 43.4 |
| 2021-06 | 20.5 | 43.7 |
| 2021-07 | 20.6 | 43.7 |
| 2021-08 | 20.8 | 44 |
| 2021-09 | 20.7 | 43.8 |
| 2021-10 | 20.6 | 43.8 |
| 2021-11 | 20.5 | 43.8 |
| 2021-12 | 20.6 | 44 |
| 2022-01 | 20.7 | 43.8 |
| 2022-02 | 20.8 | 44.2 |
| 2022-03 | 21.1 | 44.6 |
| 2022-04 | 20.8 | 44.3 |
| 2022-05 | 20.8 | 44.4 |
| 2022-06 | 21 | 44.6 |
| 2022-07 | 20.9 | 44.6 |
| 2022-08 | 20.9 | 44.7 |
| 2022-09 | 20.8 | 44.5 |
| 2022-10 | 20.7 | 44.4 |
| 2022-11 | 20.8 | 44.5 |
| 2022-12 | 20.9 | 44.6 |
| 2023-01 | 20.5 | 44.1 |
| 2023-02 | 20.7 | 44.4 |
| 2023-03 | 21 | 44.8 |
| 2023-04 | 20.7 | 44.5 |
| 2023-05 | 20.7 | 44.4 |
| 2023-06 | 20.8 | 44.7 |
| 2023-07 | 20.7 | 44.4 |
| 2023-08 | 20.7 | 44.3 |
| 2023-09 | 20.4 | 44 |
| 2023-10 | 20.3 | 43.6 |
| 2023-11 | 20.2 | 43.5 |
| 2023-12 | 20.1 | 43.4 |
| 2024-01 | 20.2 | 43.4 |
| 2024-02 | 20.3 | 43.4 |
| 2024-03 | 20.3 | 43.5 |
| 2024-04 | 20.2 | 43.3 |
| 2024-05 | 20.3 | 43.5 |
| 2024-06 | 20.6 | 43.9 |
| 2024-07 | 20.6 | 43.8 |
| 2024-08 | 20.6 | 43.8 |
| 2024-09 | 20.5 | 43.6 |
| 2024-10 | 20.4 | 43.4 |
| 2024-11 | 20.4 | 43.4 |
| 2024-12 | 20.5 | 43.5 |
| 2025-01 | 20.4 | 43.2 |
| 2025-02 | 20.5 | 43.3 |
| 2025-03 | 20.7 | 43.5 |
| 2025-04 | 20.4 | 43 |
| 2025-05 | 20.4 | 43.1 |
| 2025-06 | 20.7 | 43.3 |
| 2025-07 | 20.5 | 43.2 |
| 2025-08 | 20.3 | 42.9 |
| 2025-09 | 20.1 | 42.5 |
| 2025-10 | 19.9 | 42.2 |
| 2025-11 | 19.9 | 42.1 |
| 2025-12 | 19.9 | 42.1 |
| 2026-01 | 19.8 | 41.8 |
| 2026-02 | 19.9 | 41.9 |
| 2026-03 | 19.9 | 41.9 |
| 2026-04 | 19.8 | 41.6 |
| 2026-05 | 19.8 | 41.6 |
| 2026-06 | 19.9 | 41.8 |
| 2026-07 | 20.1 | 42.1 |
| 2026-08 | 20 | 41.8 |
The drug-plant payroll grew after 2019. It is still smaller than it was in 2001.
The recent history is not a collapse, and it is not a boom. Pennsylvania’s drug-plant payroll was 20,300 in August 2025 and 20,000 in August 2026, a 1.5 percent decline that may just be noise in a not-seasonally-adjusted series. Compared with August 2019, employment is up 6.4 percent from 18,800. Compared with January 2001, it is down 19.7 percent from 24,900. The annual average sat at 20,310 jobs in 2025, barely changed from 20,850 in 2022.
Chemical manufacturing, the broader factory group that includes medicines, paints, resins and industrial chemicals, employed 41,800 in August 2026. Drug plants were 48 percent of that total. Chemical jobs were 2.6 percent below August 2025 and 2.1 percent below August 2019. They are not the story of a state running out of chemists. They are the story of a state that already staffed this industry, then watched the rest of manufacturing shrink around it. Seasonally adjusted factory employment was 557,300 in August 2026, 35 percent below 857,200 in January 2001. Total nonfarm employment, by contrast, was 6.21 million.
The neighbors still have more of it
If the point of the announcements is to make Pennsylvania a biopharma capital, the official books say the capital is still next door. In the same August 2026 snapshot, New Jersey employed 29,500 people in pharmaceutical and medicine manufacturing. North Carolina employed 26,400. Both figures are not seasonally adjusted, so they line up with Pennsylvania’s 20,000. GSK already has a U.S. hub in North Carolina. Johnson & Johnson is a New Jersey company that used to keep major operations there before spinning off its consumer unit. Lilly is an Indiana company building in Pennsylvania.
The GDP ranking is even less flattering to Harrisburg’s press releases. In 2025, Indiana’s chemical-manufacturing GDP was $38.65 billion. New Jersey’s was $36.47 billion. North Carolina’s was $28.31 billion. Pennsylvania’s was $23.75 billion, or 4.1 percent of the U.S. chemical-factory total of $579.36 billion, on the Bureau of Economic Analysis annual accounts. Indiana’s chemical output has jumped 77 percent in current dollars since 2019; New Jersey’s is up 82 percent; North Carolina’s 71 percent. Pennsylvania’s is up 17 percent. The state is in the club. It is not leading it.
New Jersey and North Carolina still employ more drug-plant workers

View exact chart values
| state | pharma_jobs_thousands |
|---|---|
| New Jersey | 29.5 |
| North Carolina | 26.4 |
| Pennsylvania | 20 |
Indiana and New Jersey book more chemical-factory output than Pennsylvania

View exact chart values
| state | chem_gdp_billion | change_since_2019_pct |
|---|---|---|
| Indiana | 38.65 | 77.1 |
| New Jersey | 36.47 | 81.9 |
| North Carolina | 28.31 | 71 |
| Pennsylvania | 23.75 | 17.4 |
The dollars got bigger. The real output barely did.
Nominal GDP can flatter a factory that is mostly repricing. In chained 2017 dollars, Pennsylvania chemical manufacturing produced $20.42 billion in 2025, only 2.7 percent above $19.89 billion in 2019. The current-dollar series rose from $20.23 billion to $23.75 billion over the same span. Look further back and the real series is still below the early-2000s bulge, when output topped $34 billion in 2017 dollars. A state can announce new mills without having replaced the capacity it already had.
Chemicals are, however, a fat slice of what remains of Pennsylvania manufacturing. They accounted for 22.2 percent of the state’s $107.22 billion in factory GDP in 2025, and 2.2 percent of a $1.06 trillion state economy. That is not a rounding error in the industrial accounts. It is also not a reason to treat 300 jobs as a transformation. The plants Shapiro is celebrating will take years to build. Lilly’s Lehigh County factory is the company’s first in Pennsylvania; GSK’s Upper Merion hub is not due to start construction until 2027. The payroll those projects are supposed to join is the one already on the monthly survey.
Pennsylvania’s chemical factories look bigger in dollars than in real output

View exact chart values
| year | real_chem_gdp_billion | nominal_chem_gdp_billion |
|---|---|---|
| 1997 | 26.62 | 15.49 |
| 1998 | 25.67 | 16.13 |
| 1999 | 26.61 | 16.35 |
| 2000 | 27.22 | 16.34 |
| 2001 | 33.42 | 20.75 |
| 2002 | 34.2 | 21.34 |
| 2003 | 29.58 | 18.64 |
| 2004 | 23.84 | 14.94 |
| 2005 | 22.16 | 14.32 |
| 2006 | 20.75 | 13.69 |
| 2007 | 23.67 | 15.53 |
| 2008 | 21.08 | 15.08 |
| 2009 | 20.77 | 16.27 |
| 2010 | 19.7 | 15.31 |
| 2011 | 16.51 | 13.81 |
| 2012 | 14.94 | 13.16 |
| 2013 | 16.7 | 14.91 |
| 2014 | 17.2 | 15.86 |
| 2015 | 16.71 | 15.88 |
| 2016 | 18.21 | 17.67 |
| 2017 | 18.14 | 18.14 |
| 2018 | 19.37 | 19.81 |
| 2019 | 19.89 | 20.23 |
| 2020 | 21.09 | 21.28 |
| 2021 | 21.05 | 23.25 |
| 2022 | 18.38 | 21.93 |
| 2023 | 17.87 | 21.24 |
| 2024 | 19.38 | 22.44 |
| 2025 | 20.42 | 23.75 |
The household bill is the part that actually exploded
Pennsylvanians do not wait for a new mill to buy medicine. Household spending on pharmaceutical products in the state was $34.42 billion in 2025, according to BEA’s state consumption accounts. That is 5.9 times the $5.84 billion residents spent in 1997. New Jersey’s household drug bill was $27.77 billion in 2025. North Carolina’s was $24.00 billion. The U.S. total was $719.56 billion.
Those consumption figures are not factory shipments. They count what people in each state buy, including drugs made elsewhere, and they are in current dollars, so inflation and mix shifts do some of the work. Even with that caveat, the comparison is awkward for a state selling itself as a production platform: Pennsylvania households now spend more on pharmaceutical products than the state’s chemical factories produce. The customer is already here. The question the announcements do not answer is how much of that $34 billion bill will ever be filled from Upper Merion, Lehigh County or Montgomery County.
Pennsylvanians’ drug bill grew faster than the factory payroll

View exact chart values
| year | pa_billion | nj_billion | nc_billion |
|---|---|---|---|
| 1997 | 5.84 | 3.99 | 2.84 |
| 1998 | 6.59 | 4.69 | 3.4 |
| 1999 | 7.64 | 5.44 | 4.21 |
| 2000 | 8.54 | 6.33 | 4.87 |
| 2001 | 9.63 | 7.28 | 5.6 |
| 2002 | 10.72 | 8.01 | 6.28 |
| 2003 | 11.62 | 8.78 | 6.86 |
| 2004 | 12.15 | 9.32 | 7.36 |
| 2005 | 12.54 | 9.73 | 7.99 |
| 2006 | 13.76 | 10.7 | 8.81 |
| 2007 | 14.3 | 11.35 | 9.34 |
| 2008 | 14.67 | 11.51 | 9.6 |
| 2009 | 15.47 | 11.96 | 10.08 |
| 2010 | 15.7 | 12.28 | 10.53 |
| 2011 | 16.3 | 12.85 | 11.07 |
| 2012 | 16.86 | 13.25 | 11.49 |
| 2013 | 17.52 | 13.51 | 11.94 |
| 2014 | 18.66 | 14.57 | 12.92 |
| 2015 | 19.85 | 15.73 | 13.82 |
| 2016 | 20.31 | 16.26 | 14.13 |
| 2017 | 20.87 | 16.48 | 14.57 |
| 2018 | 21.68 | 17.4 | 15.1 |
| 2019 | 22.85 | 18.92 | 15.75 |
| 2020 | 24.24 | 20.44 | 16.92 |
| 2021 | 24.48 | 22.27 | 17.2 |
| 2022 | 27.15 | 23.04 | 18.75 |
| 2023 | 30.18 | 24.79 | 21 |
| 2024 | 32.03 | 26.2 | 22.34 |
| 2025 | 34.42 | 27.77 | 24 |
What to take from the ribbon-cuttings
None of this means the investments are fake, or that 300 jobs do not matter to the people who get them. It means the scale in the speeches is the wrong denominator. GSK, Lilly and Johnson & Johnson are adding plants to a state that already employs 20,000 in drug manufacturing and books $24 billion a year of chemical-factory GDP — and that still trails New Jersey and North Carolina on the payroll and Indiana, New Jersey and North Carolina on output. The household drug bill has nearly sextupled since the late 1990s while the factory headcount has not.
A fair reading of the official books is narrower than an economic-development brochure. Pennsylvania is a serious chemical and pharmaceutical state that lost factory jobs for a generation, held a drug-plant payroll in a tight band near 20,000, and is now collecting capital from companies that already know the neighborhood. Whether those plants close the gap with Indiana and New Jersey is a 2030s question. August 2026’s answer is that the industry they are joining is already on the books, and it is not waiting for a groundbreaking.
Sources and methods
BLS State and Area Employment figures are from the pinned snapshot dated August 24, 2026, with monthly observations through August 2026. Pharmaceutical and medicine manufacturing and chemical manufacturing are not seasonally adjusted; year-over-year job changes use August-to-August comparisons for that reason. Total manufacturing and total nonfarm employment cited in the article are seasonally adjusted. Pharmaceutical manufacturing (NAICS 3254) is a subset of chemical manufacturing (NAICS 325); the two series are not added. Duplicate period keys, if any, were skipped; missing values were not treated as zero.
BEA annual state GDP (chemical manufacturing, manufacturing, all-industry total) and real GDP in chained 2017 dollars run through calendar 2025 and come from the September 30, 2026 regional release. Chemical GDP is factory value added, not company revenue or announced capital spending. Chain-weighted industry GDP figures are not additive across industries. BEA state personal consumption expenditures on pharmaceutical products also run through 2025 and measure what residents buy, including products made in other states, in current dollars.
Announced investment and job counts for GSK, Eli Lilly and Johnson & Johnson are taken from the October 19, 2026 reporting on Shapiro’s announcement, not from BEA or BLS. Those pledges are not the same as completed spending, operating payrolls or GDP. Lilly’s estimated construction jobs are excluded from the permanent-job totals. Provider refresh lag is normal; these are not current-day observations. The calculation does not estimate causal effects of the announcements on employment or output.
Research completed 2026-10-20, for the October 19, 2026 news edition. The available source data may cover earlier periods; see the observation periods and source vintages above.