Research
Paramount’s leaked job-years, measured against the Hollywood payroll already gone
A studio threat, and a much larger hole already on the books
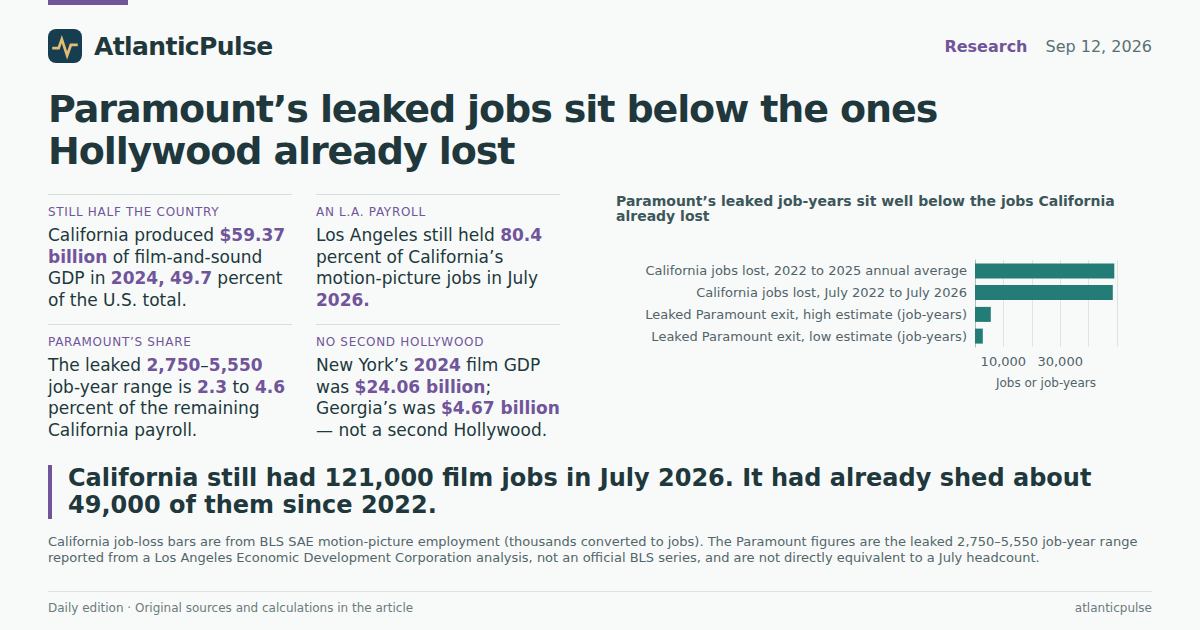
A leaked Los Angeles Economic Development Corporation analysis, as reported in trade coverage, put a floor under the panic: relocating Paramount’s headquarters and other California operations would cost 2,750 to 5,550 job-years. That is a serious number for one company. It is not, on the official books, a serious share of the industry it would leave.
In July 2026, California still employed 121,000 people in motion picture and sound recording, according to the Bureau of Labor Statistics state payroll survey. The high end of the leaked range is 4.6 percent of that remaining headcount; the low end is 2.3 percent. The same survey says the state has already shed about 49,000 of those jobs from the 2022 annual average of 172,300 to the 2025 average of 123,300. The Paramount range sits well below a loss that has already happened.
Paramount’s leaked job-years sit well below the jobs California already lost

View exact chart values
| label | jobs |
|---|---|
| California jobs lost, 2022 to 2025 annual average | 49042 |
| California jobs lost, July 2022 to July 2026 | 48500 |
| Leaked Paramount exit, high estimate (job-years) | 5550 |
| Leaked Paramount exit, low estimate (job-years) | 2750 |
Half the country’s film GDP still sits in California
Output tells a different story from the payroll. In 2024, the latest year in the Bureau of Economic Analysis annual state GDP accounts, California’s motion picture and sound recording industries produced $59.37 billion in current-dollar output. That was 49.7 percent of the U.S. total of $119.39 billion — still about half the national industry, even after a decade of incentives elsewhere. It was only 1.47 percent of California’s entire $4.05 trillion economy, which is why a studio departure can dominate the local news without moving the state GDP needle.
That $59.37 billion was a nominal record, and the inflation-adjusted series agrees: chained-2017-dollar output reached $58.29 billion in 2024, a hair above 2022 and 29.5 percent above 2019. The industry shrank in the pandemic, then more than recovered on paper. What it did not recover is the job count that went with the 2022 production bulge.
California’s lead is not close. New York produced $24.06 billion in 2024, 20.2 percent of the U.S. total. Georgia, the loudest rival on the incentive circuit, produced $4.67 billion, 3.9 percent. Florida and Texas were $2.92 billion and $2.85 billion. New Mexico, a frequent pitch in location debates, was $1.10 billion, under 1 percent. The rest of the country combined for $24.40 billion, about the same as New York. If Paramount is shopping for a smaller tax bill, it is not shopping in a second Hollywood. There isn’t one.
California’s film-and-sound economy is larger than before the pandemic

View exact chart values
| year | nominal_billion | real_2017_billion |
|---|---|---|
| 1997 | 23.24 | 19.81 |
| 1998 | 27.48 | 23.55 |
| 1999 | 32.48 | 27.44 |
| 2000 | 27.89 | 23.27 |
| 2001 | 34.61 | 28.36 |
| 2002 | 39.35 | 32.47 |
| 2003 | 39.63 | 32.76 |
| 2004 | 39.89 | 32.83 |
| 2005 | 36.01 | 30.91 |
| 2006 | 38.2 | 34.59 |
| 2007 | 41.36 | 38.11 |
| 2008 | 45.45 | 42.4 |
| 2009 | 43.03 | 42.96 |
| 2010 | 49.07 | 48.8 |
| 2011 | 44.73 | 44.85 |
| 2012 | 42.27 | 41.54 |
| 2013 | 41.94 | 42.04 |
| 2014 | 41.72 | 42.21 |
| 2015 | 46.29 | 47.41 |
| 2016 | 49.79 | 49.43 |
| 2017 | 51.4 | 51.4 |
| 2018 | 48.39 | 48.15 |
| 2019 | 44.3 | 45 |
| 2020 | 39.86 | 41.51 |
| 2021 | 44.52 | 46.65 |
| 2022 | 57.29 | 58.1 |
| 2023 | 56.38 | 57.53 |
| 2024 | 59.37 | 58.29 |
California still accounts for about half of U.S. film-and-sound GDP

View exact chart values
| state | gdp_billion | share_pct |
|---|---|---|
| California | 59.37 | 49.7 |
| New York | 24.06 | 20.2 |
| Georgia | 4.67 | 3.9 |
| Florida | 2.92 | 2.4 |
| Texas | 2.85 | 2.4 |
| New Mexico | 1.1 | 0.9 |
| All other states | 24.4 | 20.4 |
Los Angeles is still the payroll. It is a thinner payroll.
The jobs are even more concentrated than the output. Of California’s 121,000 motion-picture jobs in July 2026, 97,300 — 80.4 percent — were in the Los Angeles-Long Beach-Glendale metropolitan division. That is the Paramount problem in geographic form: an exit from the studio lot is an L.A. event, not a Sacramento abstraction. It is also why the leaked job-year range, even if it landed in full, would not be a rounding error on the local information payroll.
It would still be smaller than the hole already visible. California’s July 2026 count was 16.9 percent below July 2019 and 34.2 percent below the series peak of 183,800 in May 2016. From July 2022’s 169,500, the state has lost 48,500 jobs in four years. Those figures are not seasonally adjusted, so month-to-month swings include the industry’s usual feast-and-famine calendar. The annual averages wash some of that out and still show the same break: 158,000 jobs in 2019, 172,300 in 2022, 123,300 in 2025, and 123,300 again in the first seven months of 2026.
Nationally, the seasonally adjusted U.S. payroll in the same industry was 332,700 in July 2026, down 24.5 percent from 440,800 in July 2019. Average hourly earnings for those remaining U.S. workers were $45.07 in June 2026, up from $37.27 in July 2019. Fewer people are on the clock. The ones who are have not, on average, taken a pay cut.
Los Angeles still is the payroll. It is a thinner payroll.

View exact chart values
| period | ca_thousands | la_thousands | ny_thousands |
|---|---|---|---|
| 2019-01 | 161 | 134.8 | 56.1 |
| 2019-02 | 174.2 | 147.5 | 58.1 |
| 2019-03 | 167.1 | 140.4 | 60.1 |
| 2019-04 | 149.7 | 123.9 | 61.8 |
| 2019-05 | 149.3 | 123.4 | 63.2 |
| 2019-06 | 151.7 | 125.4 | 63.2 |
| 2019-07 | 145.6 | 119.2 | 62.6 |
| 2019-08 | 155.2 | 129.6 | 64.9 |
| 2019-09 | 163.9 | 139.1 | 62.9 |
| 2019-10 | 156.3 | 131.8 | 62 |
| 2019-11 | 163.4 | 138.4 | 63.1 |
| 2019-12 | 158.8 | 132.9 | 61.9 |
| 2020-01 | 167.1 | 142 | 58.9 |
| 2020-02 | 177.6 | 152.5 | 60.7 |
| 2020-03 | 170.8 | 146.1 | 61 |
| 2020-04 | 98.9 | 87.4 | 36.2 |
| 2020-05 | 96.9 | 87.6 | 33.2 |
| 2020-06 | 89.9 | 80.4 | 32.8 |
| 2020-07 | 92 | 82.3 | 31.9 |
| 2020-08 | 101.3 | 91.6 | 34.6 |
| 2020-09 | 105.5 | 94.5 | 38.7 |
| 2020-10 | 124.4 | 111.8 | 47.1 |
| 2020-11 | 132.5 | 120.3 | 49.7 |
| 2020-12 | 127.4 | 116.6 | 49.6 |
| 2021-01 | 114.6 | 104.3 | 46.1 |
| 2021-02 | 124 | 113.6 | 48.6 |
| 2021-03 | 129.4 | 118.5 | 54.2 |
| 2021-04 | 135 | 119.9 | 52.8 |
| 2021-05 | 144.1 | 127 | 55 |
| 2021-06 | 138.2 | 119.8 | 57.2 |
| 2021-07 | 135.4 | 115.6 | 56.7 |
| 2021-08 | 165 | 144.6 | 58 |
| 2021-09 | 146.8 | 126.6 | 62 |
| 2021-10 | 160 | 139.3 | 59.4 |
| 2021-11 | 172.4 | 151.1 | 62.2 |
| 2021-12 | 163.4 | 141.2 | 60.5 |
| 2022-01 | 167.7 | 146.6 | 55.2 |
| 2022-02 | 182.4 | 161.1 | 59.7 |
| 2022-03 | 177.4 | 155.6 | 60.2 |
| 2022-04 | 168.9 | 147 | 58.3 |
| 2022-05 | 173.4 | 150.8 | 61.8 |
| 2022-06 | 169.3 | 145.9 | 64.3 |
| 2022-07 | 169.5 | 145.5 | 63.4 |
| 2022-08 | 177.5 | 154.3 | 63.3 |
| 2022-09 | 168.4 | 146.5 | 60.8 |
| 2022-10 | 169.3 | 147.1 | 62.6 |
| 2022-11 | 174.4 | 151.5 | 62 |
| 2022-12 | 169.4 | 146.3 | 59 |
| 2023-01 | 155.7 | 134.2 | 54.7 |
| 2023-02 | 156.7 | 135.3 | 55.9 |
| 2023-03 | 151.7 | 130.2 | 56.5 |
| 2023-04 | 136.8 | 115.2 | 53.8 |
| 2023-05 | 137.3 | 114.8 | 52.5 |
| 2023-06 | 124.8 | 101.7 | 51.3 |
| 2023-07 | 117.6 | 94.2 | 44.9 |
| 2023-08 | 116.3 | 93.4 | 42.9 |
| 2023-09 | 113.7 | 91.7 | 42.5 |
| 2023-10 | 115.9 | 93.7 | 42.7 |
| 2023-11 | 126.7 | 104.7 | 43.8 |
| 2023-12 | 130.1 | 107.9 | 47 |
| 2024-01 | 124.8 | 102.6 | 47.2 |
| 2024-02 | 136.6 | 114.9 | 52.8 |
| 2024-03 | 139 | 117.2 | 53.5 |
| 2024-04 | 130.8 | 109.2 | 53.8 |
| 2024-05 | 133.8 | 112.2 | 54.6 |
| 2024-06 | 127.4 | 105.1 | 53.7 |
| 2024-07 | 126 | 103 | 52.8 |
| 2024-08 | 133.9 | 111.5 | 52.5 |
| 2024-09 | 130.8 | 109.3 | 52.9 |
| 2024-10 | 126.9 | 105.3 | 55.1 |
| 2024-11 | 138.5 | 116.8 | 54 |
| 2024-12 | 130 | 108 | 53.5 |
| 2025-01 | 114.9 | 93.4 | 45.6 |
| 2025-02 | 130.8 | 108.9 | 47.4 |
| 2025-03 | 120.6 | 99.4 | 50.7 |
| 2025-04 | 121.1 | 99.6 | 48.7 |
| 2025-05 | 128.3 | 106.4 | 49.4 |
| 2025-06 | 123.4 | 100.7 | 48.7 |
| 2025-07 | 120.7 | 97.3 | 49.2 |
| 2025-08 | 127.3 | 103.9 | 50.1 |
| 2025-09 | 121.6 | 100.3 | 51.4 |
| 2025-10 | 122.7 | 100.7 | 52 |
| 2025-11 | 123.1 | 100.8 | 51.3 |
| 2025-12 | 124.6 | 101.6 | 51.8 |
| 2026-01 | 119.5 | 97.1 | 48.6 |
| 2026-02 | 125.9 | 103.9 | 52.2 |
| 2026-03 | 126.2 | 101.4 | 52.2 |
| 2026-04 | 121.8 | 96.9 | 46.8 |
| 2026-05 | 123.4 | 98.1 | 47.1 |
| 2026-06 | 125.2 | 101 | 48 |
| 2026-07 | 121 | 97.3 | 48.2 |
New York lost jobs too. It did not catch California.
If the work were simply migrating east, New York’s payroll would be the place to see it. It is not. New York employed 48,200 people in the industry in July 2026, down from 62,600 in July 2019. Indexed to each place’s 2019 annual average, California, New York and the United States all sit in the mid-to-high 70s as of 2026. The 2022 rebound shows up everywhere; so does the give-back.
That pattern matters for the Paramount argument. A headquarters leaving California for a tax-friendlier state is a political story. It is not, on these books, a story of a rival state absorbing the work. Georgia’s GDP is real and has grown, but it is still less than a tenth of California’s. Texas, which has the factories, the data centers and the air-taxi demo flights, had $2.85 billion of film-and-sound output in 2024 — about 5 percent of California’s. The jobs California has already lost did not reappear as a second-place industry somewhere else in the BLS and BEA tables.
Compensation inside California tells the same split-screen. Employee compensation in the industry peaked at $24.11 billion in 2022 and was $21.31 billion in 2024, still above 2019’s $20.37 billion. The state is paying a smaller workforce about as much as it did before the pandemic, on a smaller headcount, while recording record output. That is consistent with a shift toward fewer, more expensive productions — or toward a lot of value sitting in rights and distribution rather than in people on set. The accounts cannot say which. They can say the headcount decline is not a statistical blip.
The jobs recovery of 2022 did not last in California, New York or the U.S.

View exact chart values
| year | ca_index_2019 | la_index_2019 | ny_index_2019 | us_index_2019 |
|---|---|---|---|---|
| 2010 | 91.7 | 91.6 | 88.7 | 84.6 |
| 2011 | 91.3 | 91.2 | 90 | 82.7 |
| 2012 | 89.4 | 89.6 | 92.4 | 82.6 |
| 2013 | 91.4 | 92.1 | 97.1 | 84.5 |
| 2014 | 92.3 | 92.7 | 96.3 | 86.9 |
| 2015 | 96.7 | 97.5 | 95.7 | 91.1 |
| 2016 | 109.9 | 112 | 95.9 | 97.4 |
| 2017 | 101 | 100.3 | 100.2 | 98.6 |
| 2018 | 100.4 | 99.8 | 98.3 | 100.6 |
| 2019 | 100 | 100 | 100.1 | 100 |
| 2020 | 78.3 | 82.8 | 72.2 | 68.7 |
| 2021 | 91.1 | 95.9 | 91 | 86.7 |
| 2022 | 109 | 113.3 | 98.8 | 102.2 |
| 2023 | 83.5 | 83.1 | 79.5 | 92.7 |
| 2024 | 83.2 | 82.9 | 86 | 88.2 |
| 2025 | 78 | 76.5 | 80.6 | 81.1 |
| 2026 | 78 | 75.2 | 79.5 | 76.5 |
What the leaked range actually changes
Put the leaked job-years next to the official books and the scale snaps into place. California’s film-and-sound industry is still enormous: $59 billion of output, about half the country, 121,000 jobs, four-fifths of them in Los Angeles. A Paramount headquarters move in the 2,750–5,550 job-year range would be painful in the neighborhoods that already watched the 2023 contraction. It would not, by itself, be the thing that took Hollywood off California’s books. That damage, if the payroll survey is the measure, arrived earlier and in larger numbers.
Two caveats belong next to that conclusion. Job-years in an economic-impact memo are not the same object as a July employment reading, and the leaked range is not an official statistic. And 2024 GDP can rise while 2025–2026 jobs stay depressed; the output accounts have not yet caught the latest payroll year. None of that makes the Paramount number imaginary. It does mean readers can hold two true things at once: California still is the center of the American film economy, and the center has already gotten smaller.
Sources and methods
Figures are from pinned, read-only snapshots, not live website pulls. BEA annual state GDP and compensation come from the April 9, 2026 regional release (snapshot created 2026-08-31). BLS State and Area Employment and Current Employment Statistics come from the August 24, 2026 public bulk snapshots, with observations through July 2026 for employment and June 2026 for national average hourly earnings.
Motion picture and sound recording is NAICS 512 throughout. BEA GDP is millions of current dollars (SAGDP2) and millions of chained 2017 dollars (SAGDP9). Compensation is thousands of current dollars (SAINC6N). BLS employment is thousands of jobs. Shares and conversions to billions or headcounts are arithmetic on those units; missing observations were dropped, not treated as zero.
The 2025 BEA annual GDP value for this industry was not in the extract (nulls omitted), so GDP statements stop at 2024. BLS 2026 annual averages are January–July year-to-date means, not full-year figures. California and New York employment series are not seasonally adjusted; the U.S. CES employment and earnings series are seasonally adjusted. Those series are compared only where the seasonal status is labeled.
The 2,750–5,550 job-year range is from today’s stored reporting of a leaked Los Angeles analysis, not from BEA or BLS. Job-years are not equivalent to a July employment count. No causal effect is inferred from the Paramount threat, from state tax incentives, or from the 2023 production downturn. Descriptive comparisons only.
Provider and refresh lag are normal. These are the latest observations in the pinned catalogue, not current-day readings, and they are not a historical reconstruction of what was knowable on a past date.
Research completed 2026-09-13, for the September 12, 2026 news edition. The available source data may cover earlier periods; see the observation periods and source vintages above.