Research
Oregon’s 17-month job slump is real. Health care is the only thing still hiring.
A parked car that is rolling backward
Oregon’s state economist, Carl Riccadonna, told lawmakers the labor market had become “low-hire, low-fire”: fewer layoffs than the ugly 2024–25 wave, but almost no new jobs either. On an annual basis, he said, the state had shed jobs for 16 months, with semiconductors primarily responsible and even health care “shifting into a lower gear,” The Chronicle reported. That is a testable claim. It is also a more interesting one than the national “sturdy labor market” slogan, because Oregon is small enough that a chip bust actually shows up in the totals.
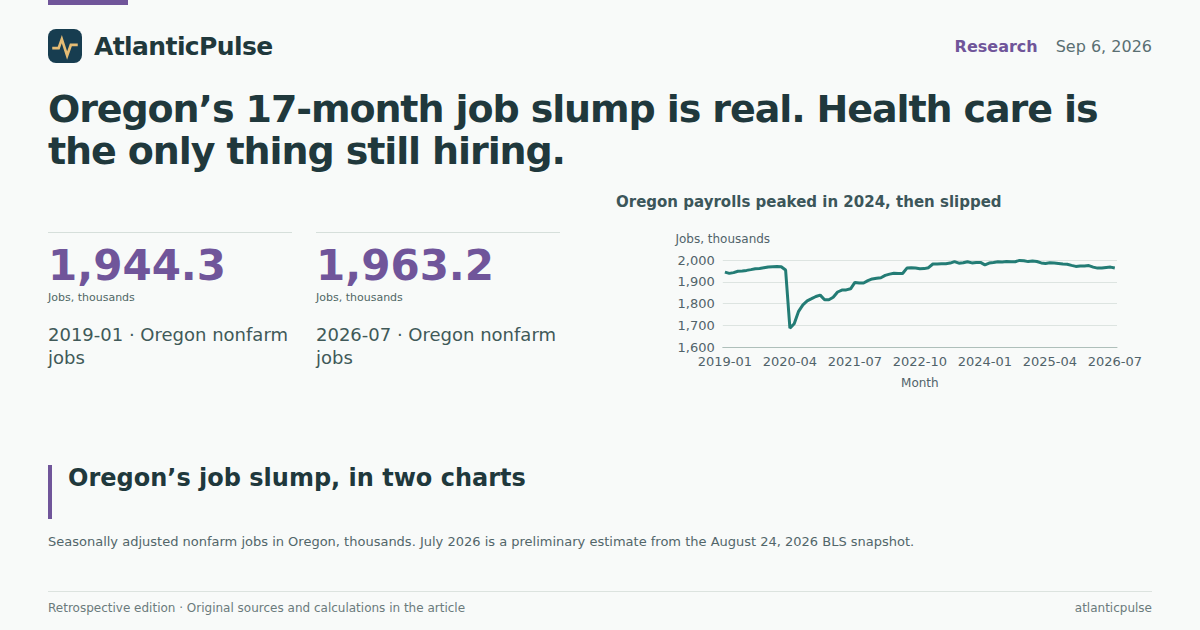
The Bureau of Labor Statistics’ state payroll survey says the slide is real, and a month longer than the talking point. Seasonally adjusted nonfarm employment was 1,963,200 in July 2026, a preliminary figure, down 18,000 jobs, or 0.91 percent, from July 2025. That was the 17th consecutive month below the same month a year earlier. The peak was September 2024, at 1,998,000. Oregon has since given back 34,800 jobs — not a collapse, not a rounding error, and not the same as “workers are just sitting still.” A parked car does not lose 35,000 seats.
Month to month, the path is choppier. Payrolls ticked up in late 2025 and again in spring 2026 before slipping in July. The 16-month claim is an annual-basis fact, not 16 straight monthly declines. That distinction matters if you are waiting for a sudden crash. Oregon is not crashing. It is leaking, in public, while neighboring states keep hiring.
Oregon payrolls peaked in 2024, then slipped

View exact chart values
| month | jobs_thousands | preliminary |
|---|---|---|
| 2019-01 | 1944.3 | 0 |
| 2019-02 | 1938.6 | 0 |
| 2019-03 | 1942 | 0 |
| 2019-04 | 1948 | 0 |
| 2019-05 | 1950.1 | 0 |
| 2019-06 | 1952 | 0 |
| 2019-07 | 1956 | 0 |
| 2019-08 | 1960.1 | 0 |
| 2019-09 | 1961.6 | 0 |
| 2019-10 | 1964.7 | 0 |
| 2019-11 | 1967.6 | 0 |
| 2019-12 | 1969.1 | 0 |
| 2020-01 | 1969.6 | 0 |
| 2020-02 | 1969.2 | 0 |
| 2020-03 | 1954 | 0 |
| 2020-04 | 1687 | 0 |
| 2020-05 | 1706.8 | 0 |
| 2020-06 | 1764.3 | 0 |
| 2020-07 | 1794 | 0 |
| 2020-08 | 1812 | 0 |
| 2020-09 | 1822.2 | 0 |
| 2020-10 | 1832.4 | 0 |
| 2020-11 | 1838.4 | 0 |
| 2020-12 | 1817 | 0 |
| 2021-01 | 1817 | 0 |
| 2021-02 | 1828.7 | 0 |
| 2021-03 | 1852.9 | 0 |
| 2021-04 | 1861.4 | 0 |
| 2021-05 | 1862.7 | 0 |
| 2021-06 | 1867.6 | 0 |
| 2021-07 | 1897.1 | 0 |
| 2021-08 | 1894.9 | 0 |
| 2021-09 | 1894.3 | 0 |
| 2021-10 | 1905.4 | 0 |
| 2021-11 | 1913.1 | 0 |
| 2021-12 | 1916.4 | 0 |
| 2022-01 | 1918.6 | 0 |
| 2022-02 | 1929.2 | 0 |
| 2022-03 | 1935.2 | 0 |
| 2022-04 | 1939.4 | 0 |
| 2022-05 | 1938.5 | 0 |
| 2022-06 | 1938 | 0 |
| 2022-07 | 1962.7 | 0 |
| 2022-08 | 1964.2 | 0 |
| 2022-09 | 1963.9 | 0 |
| 2022-10 | 1960.1 | 0 |
| 2022-11 | 1960.3 | 0 |
| 2022-12 | 1964.5 | 0 |
| 2023-01 | 1981.6 | 0 |
| 2023-02 | 1982 | 0 |
| 2023-03 | 1983.2 | 0 |
| 2023-04 | 1982.9 | 0 |
| 2023-05 | 1985.9 | 0 |
| 2023-06 | 1992.5 | 0 |
| 2023-07 | 1985.5 | 0 |
| 2023-08 | 1986.9 | 0 |
| 2023-09 | 1992.3 | 0 |
| 2023-10 | 1986.5 | 0 |
| 2023-11 | 1989 | 0 |
| 2023-12 | 1989 | 0 |
| 2024-01 | 1977.6 | 0 |
| 2024-02 | 1985.7 | 0 |
| 2024-03 | 1988.6 | 0 |
| 2024-04 | 1991.9 | 0 |
| 2024-05 | 1991.2 | 0 |
| 2024-06 | 1993.6 | 0 |
| 2024-07 | 1991.5 | 0 |
| 2024-08 | 1992.4 | 0 |
| 2024-09 | 1998 | 0 |
| 2024-10 | 1996.5 | 0 |
| 2024-11 | 1992.8 | 0 |
| 2024-12 | 1995.3 | 0 |
| 2025-01 | 1993.1 | 0 |
| 2025-02 | 1986.6 | 0 |
| 2025-03 | 1984.3 | 0 |
| 2025-04 | 1987 | 0 |
| 2025-05 | 1986.2 | 0 |
| 2025-06 | 1983.9 | 0 |
| 2025-07 | 1981.2 | 0 |
| 2025-08 | 1980.8 | 0 |
| 2025-09 | 1975.2 | 0 |
| 2025-10 | 1970.4 | 0 |
| 2025-11 | 1972.4 | 0 |
| 2025-12 | 1972.5 | 0 |
| 2026-01 | 1974.1 | 0 |
| 2026-02 | 1967.2 | 0 |
| 2026-03 | 1962.9 | 0 |
| 2026-04 | 1963.5 | 0 |
| 2026-05 | 1966 | 0 |
| 2026-06 | 1967.3 | 0 |
| 2026-07 | 1963.2 | 1 |
The plants that used to define the place
Riccadonna blamed semiconductors. Official Oregon statistics do not publish a seasonally adjusted “semiconductor” payroll; they do publish computer and electronic product manufacturing, not seasonally adjusted. That category is broader than chip fabs, but it is the closest statewide series, and it is ugly. In July 2026 it employed 31,300 people, down from 35,400 a year earlier and 42,000 in July 2022. July 1990, at the start of the series, was 30,700. The lowest reading after 1992 is 31,100 in May 2026. A “30-year low” is not a stretch. It is almost a 33-year low.
Nationally, the picture is milder, which is the point of looking at Oregon instead of repeating a U.S. chip-factory story. National CES payrolls for semiconductor and related device manufacturing stood at 180,300 in June 2026, the latest month in the snapshot, down from 201,000 in July 2022 — a decline, not a wipeout. Oregon’s computer-and-electronics July count is about 25 percent below that 2022 level. The state that sold itself as a second Silicon Valley is, on this measure, back where it was when the plants were still the new thing.
Manufacturing as a whole, which is seasonally adjusted, fell 6,400 jobs over the year, to 172,800. That is not all chips. Wood, metals, and food processing live in that number too. But computer and electronics, even on a not-seasonally-adjusted July-to-July comparison, lost 4,100 jobs — enough to explain a large share of the factory decline, and enough to notice in a state with fewer than two million payroll jobs.
Oregon’s computer-and-electronics plants are back near early-1990s levels

View exact chart values
| year | jobs_thousands |
|---|---|
| 1990 | 30.7 |
| 1991 | 31.6 |
| 1992 | 31.2 |
| 1993 | 31.7 |
| 1994 | 33.5 |
| 1995 | 36.8 |
| 1996 | 42.1 |
| 1997 | 47.1 |
| 1998 | 47.6 |
| 1999 | 46 |
| 2000 | 47.8 |
| 2001 | 50.2 |
| 2002 | 43.9 |
| 2003 | 40.8 |
| 2004 | 41.7 |
| 2005 | 41.2 |
| 2006 | 42.4 |
| 2007 | 40.7 |
| 2008 | 39.3 |
| 2009 | 35.3 |
| 2010 | 35.1 |
| 2011 | 36.9 |
| 2012 | 37.8 |
| 2013 | 37.2 |
| 2014 | 36.8 |
| 2015 | 38.3 |
| 2016 | 37.3 |
| 2017 | 37 |
| 2018 | 38.2 |
| 2019 | 39 |
| 2020 | 38 |
| 2021 | 37.8 |
| 2022 | 42 |
| 2023 | 40.7 |
| 2024 | 40.3 |
| 2025 | 35.4 |
| 2026 | 31.3 |
Health care did not get the memo
The other half of the briefing was that health care, “the one bright spot,” was cooling. Job openings may well be. Payrolls are not. Health care and social assistance employed 323,200 in July 2026, up 9,200, or 2.9 percent, from a year earlier. Private education and health services, the broader supersector, was up 10,100. If you subtract health care from the statewide total, the rest of Oregon lost about 27,200 jobs over the year. The “reliable engine” is still running. It is just towing a trailer with a flat tire.
The losses are spread across the private-service and public payroll, not confined to fabs. Professional and business services, which include temporary help, fell 5,900. Government fell 6,300. Leisure and hospitality fell 3,700. Trade, transportation, and utilities fell 3,600. Construction, the sector that usually amplifies a downturn, was essentially flat, up 600. That is an odd recession: factories, offices, restaurants, and the public payroll shrinking while hospitals and clinics keep posting help-wanted signs that, apparently, still get filled.
None of this proves openings have not slowed. The state economist was talking about vacancies, which are a different survey. A cooling in openings can coexist with rising employment if employers stop expanding as fast but do not stop hiring altogether. The payroll books simply do not show health care joining the slump. They show it as the reason the slump is 18,000 jobs rather than 27,000.
Health care still hired. Almost everything else in Oregon did not.

View exact chart values
| industry | change_thousands | pct_change | jul2026_thousands |
|---|---|---|---|
| Manufacturing | -6.4 | -3.57 | 172.8 |
| Government | -6.3 | -1.98 | 311.3 |
| Professional and business services | -5.9 | -2.33 | 247.4 |
| Leisure and hospitality | -3.7 | -1.78 | 203.6 |
| Trade, transportation and utilities | -3.6 | -1.02 | 350.8 |
| Construction | 0.6 | 0.53 | 113.2 |
| Health care and social assistance | 9.2 | 2.93 | 323.2 |
The only state in the room going the wrong way
Low-hire, low-fire is a national mood. Oregon is a local result. Indexed to January 2024, Oregon’s payroll was at 99.3 in July 2026. Washington was at 101.5, California at 100.6, Idaho at 103.8, and the United States at 101.2. The neighbors did not boom. They did not shrink. Oregon did.
Over the 12 months to July 2026, among a comparison set of large and nearby states, Oregon was the only one with a year-over-year decline. Illinois, New York, and the United States were up about 0.2 percent. Washington and Idaho were up about 0.5 percent. California was up 0.6 percent. Arizona, Nevada, and Texas were up between 0.7 and 1.2 percent. This is not a claim about all 50 states. It is a claim about the states you would check if someone told you the West Coast had caught a cold. Only Oregon had.
Neighbors kept adding jobs. Oregon did not.

View exact chart values
| month | oregon | washington | california | idaho | united_states |
|---|---|---|---|---|---|
| 2023-01 | 100.2 | 99.57 | 98.5 | 98.14 | 98.56 |
| 2023-02 | 100.22 | 99.75 | 98.64 | 98.35 | 98.75 |
| 2023-03 | 100.28 | 99.65 | 98.6 | 98.1 | 98.79 |
| 2023-04 | 100.27 | 99.75 | 98.54 | 98.74 | 98.94 |
| 2023-05 | 100.42 | 99.83 | 98.85 | 99.08 | 99.12 |
| 2023-06 | 100.75 | 100.09 | 99.01 | 99.47 | 99.27 |
| 2023-07 | 100.4 | 99.77 | 98.77 | 98.72 | 99.37 |
| 2023-08 | 100.47 | 99.84 | 98.94 | 99.17 | 99.51 |
| 2023-09 | 100.74 | 99.91 | 99.19 | 99.47 | 99.61 |
| 2023-10 | 100.45 | 99.86 | 98.99 | 100.3 | 99.71 |
| 2023-11 | 100.58 | 99.99 | 99.07 | 100.76 | 99.79 |
| 2023-12 | 100.58 | 100.11 | 99.35 | 101.21 | 99.89 |
| 2024-01 | 100 | 100 | 100 | 100 | 100 |
| 2024-02 | 100.41 | 100.34 | 99.61 | 100.16 | 100.13 |
| 2024-03 | 100.56 | 100.45 | 99.68 | 100.48 | 100.28 |
| 2024-04 | 100.72 | 100.4 | 99.5 | 100.68 | 100.32 |
| 2024-05 | 100.69 | 100.54 | 99.48 | 100.92 | 100.37 |
| 2024-06 | 100.81 | 100.54 | 99.45 | 101.18 | 100.42 |
| 2024-07 | 100.7 | 100.68 | 99.57 | 101.35 | 100.46 |
| 2024-08 | 100.75 | 100.73 | 99.66 | 101.64 | 100.46 |
| 2024-09 | 101.03 | 101.06 | 99.79 | 101.78 | 100.56 |
| 2024-10 | 100.96 | 100.01 | 100.14 | 101.88 | 100.58 |
| 2024-11 | 100.77 | 100.85 | 100.12 | 101.9 | 100.67 |
| 2024-12 | 100.9 | 101.06 | 99.88 | 101.86 | 100.82 |
| 2025-01 | 100.78 | 101.08 | 99.99 | 102.11 | 100.79 |
| 2025-02 | 100.46 | 100.94 | 99.87 | 101.94 | 100.81 |
| 2025-03 | 100.34 | 100.88 | 99.9 | 102.13 | 100.86 |
| 2025-04 | 100.48 | 101.14 | 100.17 | 102.67 | 100.93 |
| 2025-05 | 100.43 | 101.32 | 100.2 | 102.91 | 100.93 |
| 2025-06 | 100.32 | 101.25 | 100.06 | 102.85 | 100.92 |
| 2025-07 | 100.18 | 101.06 | 99.96 | 103.26 | 100.96 |
| 2025-08 | 100.16 | 100.96 | 100.06 | 103.3 | 100.92 |
| 2025-09 | 99.88 | 100.91 | 99.97 | 103.1 | 100.97 |
| 2025-10 | 99.64 | 101.01 | 99.98 | 102.84 | 100.88 |
| 2025-11 | 99.74 | 101.07 | 100.18 | 103.02 | 100.9 |
| 2025-12 | 99.74 | 101.17 | 100.2 | 103.21 | 100.89 |
| 2026-01 | 99.82 | 101.17 | 100.65 | 102.81 | 100.99 |
| 2026-02 | 99.47 | 101.11 | 100.55 | 102.46 | 100.89 |
| 2026-03 | 99.26 | 101.16 | 100.75 | 102.8 | 101.03 |
| 2026-04 | 99.29 | 101.17 | 100.75 | 103.4 | 101.12 |
| 2026-05 | 99.41 | 101.33 | 100.67 | 103.63 | 101.16 |
| 2026-06 | 99.48 | 101.21 | 100.7 | 103.62 | 101.18 |
| 2026-07 | 99.27 | 101.54 | 100.59 | 103.76 | 101.16 |
Among these states, only Oregon’s payroll shrank over the year

View exact chart values
| state | jul2025 | jul2026 | change_thousands | pct_change |
|---|---|---|---|---|
| Oregon | 1981.2 | 1963.2 | -18 | -0.91 |
| Illinois | 6164.5 | 6176.4 | 11.9 | 0.19 |
| United States | 158542 | 158858 | 316 | 0.2 |
| New York | 9940.1 | 9960.7 | 20.6 | 0.21 |
| Colorado | 2961.6 | 2973.7 | 12.1 | 0.41 |
| Florida | 9996.3 | 10037.3 | 41 | 0.41 |
| Washington | 3635.3 | 3652.5 | 17.2 | 0.47 |
| Idaho | 882.6 | 886.8 | 4.2 | 0.48 |
| California | 18020.3 | 18133 | 112.7 | 0.63 |
| Arizona | 3262.7 | 3285.8 | 23.1 | 0.71 |
| Nevada | 1595 | 1612.5 | 17.5 | 1.1 |
| Texas | 14302.4 | 14468 | 165.6 | 1.16 |
What the 16-month line actually means
Three caveats belong next to the findings, not in a footnote nobody reads. July 2026 is preliminary. State payrolls get revised, sometimes enough to shorten a streak. Computer and electronic product manufacturing is not a pure semiconductor count, and it is not seasonally adjusted; July-to-July is the honest comparison, not a monthly panic. And a selected group of states is not a ranking of the nation. If some other small manufacturing state also shrank, it is not in this chart.
What survives those caveats is still the story from the fairground of Labor Day weekend, minus the hurricanes. Oregon’s official books show a labor market that has been smaller than a year earlier for 17 months, a computer-and-electronics workforce last seen when George H.W. Bush was president, and a health-care sector that has not, in fact, stopped hiring. Low-fire is the optimistic half of the slogan. The hire side is not low. It is negative — unless you work in a hospital.
Sources and methods
This is retrospective enrichment using pinned BLS snapshots, not a reconstruction of what was knowable on the edition date of 2026-09-06. Research used the AtlanticPulse catalogue extracts pulled on 2026-09-11 from the BLS State and Area Employment snapshot dated 2026-08-24 (release bls-sm-snapshot-2026-08-24) and the Current Employment Statistics snapshot dated 2026-08-24 (release bls-ce-snapshot-2026-08-24).
Oregon statewide total nonfarm and supersector series are seasonally adjusted monthly payrolls in thousands. Computer and electronic product manufacturing is not seasonally adjusted; comparisons use July of each year. July 2026 values carry a preliminary status flag in the snapshot. Missing values were not treated as zeros.
The 17-month streak counts consecutive months in which seasonally adjusted Oregon nonfarm employment was below the same month a year earlier, ending in July 2026. Peak-to-latest uses the highest reading in the 2010–July 2026 extract (September 2024).
State comparisons are a selected set (Oregon, Washington, California, Idaho, Nevada, Texas, Colorado, Arizona, Florida, New York, Illinois) plus the national CES total, not a 50-state census. Dictionary presence of other states was not treated as proof of extracted observations.
National semiconductor and related device manufacturing (CES) is a narrower industry than Oregon computer and electronic product manufacturing (SAE) and is seasonally adjusted; the latest U.S. observation in this snapshot is June 2026, not July. The two series are not the same workforce and are not added or ratioed as if they were.
Health-care payrolls are not job openings. The news claim about cooling vacancies was not tested here because the indexed JOLTS product in this catalogue does not provide a usable recent Oregon series. No causal effect is inferred from descriptive comparisons.
Research completed 2026-09-11, for the September 6, 2026 news edition. This is retrospective analysis, not a reconstruction of information available that day.