Research
Ohio’s voucher fight, measured against the school system already on the books
A second school system, on paper
Ohio’s Tenth District Court of Appeals ruled the statewide EdChoice voucher program unconstitutional, saying it funds a separate school system, lacks oversight, and is unavailable to many rural taxpayers who still pay for it. About 180,000 students use the program, expanded in 2023. Public-school groups called a $1 billion-a-year diversion a “boondoggle”; school-choice advocates said a loss would be devastating. The ruling lets the program continue while an expected appeal goes to the Ohio Supreme Court.
Those are legal and political claims. They are not a picture of the school economy Ohio already has. The question that can be answered with official books is narrower, and less theatrical: how large is the public-school payroll, how much do households already spend on private K-12, and did either of those series lurch after the program went universal? The short version is that local public-school jobs never collapsed, household private-K-12 spending was already larger than the disputed $1 billion, and the payroll that actually shrank is at state universities.
None of this proves that vouchers caused, or failed to cause, a second system. Payrolls and household spending can move for enrollment, wages, college prices, or a pandemic. The point is scale. A $1 billion program is easier to argue about than to place next to a 298,000-person public-school workforce and a $12 billion household education bill.
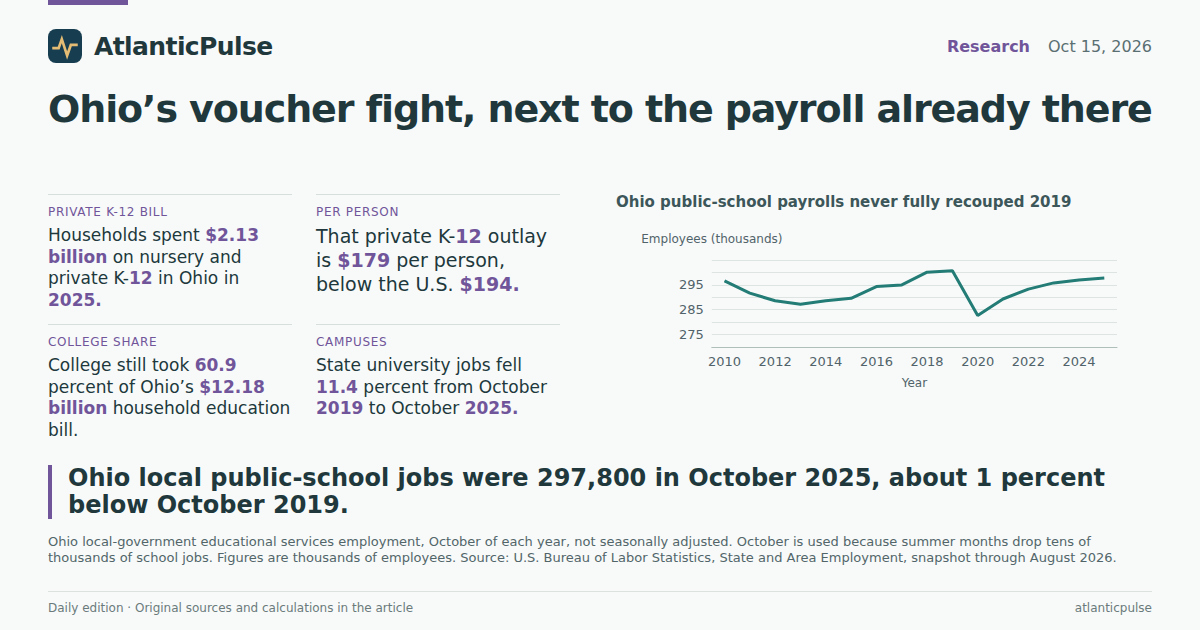
Ohio public-school payrolls never fully recouped 2019

View exact chart values
| year | employees_thousands |
|---|---|
| 2010 | 296.6 |
| 2011 | 291.7 |
| 2012 | 288.6 |
| 2013 | 287.2 |
| 2014 | 288.6 |
| 2015 | 289.6 |
| 2016 | 294.3 |
| 2017 | 295 |
| 2018 | 300.1 |
| 2019 | 300.7 |
| 2020 | 282.7 |
| 2021 | 289.3 |
| 2022 | 293.3 |
| 2023 | 295.8 |
| 2024 | 297 |
| 2025 | 297.8 |
The public-school payroll is almost the same size it was in 2019
Ohio local-government educational services — the series that is mostly public K-12 — employed 297,800 people in October 2025. That is 2,900 below October 2019, or about 1 percent. It is also 4,500 above October 2022, the last full school-year snapshot before the 2023 expansion. The 2020 trough was real: 282,700 that October. The jobs came back. They did not overshoot.
October is the honest month. Local school payrolls are not seasonally adjusted, and they drop hard in summer; August 2026 still showed only 274,200. May 2026, another in-session month, was 297,100, versus 300,400 in May 2019. Neighbors look similar, not like a uniquely Ohio collapse. From October 2019 to October 2025, Indiana was down 1.3 percent, Kentucky was unchanged, and Michigan was up 4.5 percent. If EdChoice were hollowing out public-school staffing, it is not showing up as an Ohio outlier on the official count.
Statewide nonfarm payrolls grew 1.5 percent from August 2019 to August 2026. Local public-school jobs, using October, are still a hair below 2019. That is a lag, not a crater. It also means the public system the court said lawmakers must fund is still, by headcount, almost the same size it was when EdChoice was smaller and more targeted.
Private education jobs recovered. Local public-school jobs lagged.

View exact chart values
| year | local_ed_oct_index | local_ed_oct_thousands | private_ed_aug_index | private_ed_aug_thousands | total_nfp_aug_index |
|---|---|---|---|---|---|
| 2010 | 98.6 | 296.6 | 94 | 110.3 | 89.7 |
| 2011 | 97 | 291.7 | 94.3 | 110.6 | 91.5 |
| 2012 | 96 | 288.6 | 95.1 | 111.6 | 92.8 |
| 2013 | 95.5 | 287.2 | 100.3 | 117.6 | 94.2 |
| 2014 | 96 | 288.6 | 100.9 | 118.4 | 95.6 |
| 2015 | 96.3 | 289.6 | 102.2 | 119.9 | 97.1 |
| 2016 | 97.9 | 294.3 | 100.6 | 118 | 97.9 |
| 2017 | 98.1 | 295 | 99.9 | 117.2 | 98.8 |
| 2018 | 99.8 | 300.1 | 98.9 | 116 | 99.5 |
| 2019 | 100 | 300.7 | 100 | 117.3 | 100 |
| 2020 | 94 | 282.7 | 91.4 | 107.2 | 93.3 |
| 2021 | 96.2 | 289.3 | 91.2 | 107 | 96.6 |
| 2022 | 97.5 | 293.3 | 93.6 | 109.8 | 99.1 |
| 2023 | 98.4 | 295.8 | 97.1 | 113.9 | 100.5 |
| 2024 | 98.8 | 297 | 100.5 | 117.9 | 101 |
| 2025 | 99 | 297.8 | 100.3 | 117.7 | 101.4 |
| 2026 | — | — | 103.9 | 121.9 | 101.5 |
Private education jobs rose. State campuses did the shrinking.
Private educational services — a seasonally adjusted series that includes private colleges and training centres, not only K-12 academies — employed 121,900 in August 2026, up 3.9 percent from August 2019 and 7 percent from August 2023. That is the wrong series for a clean voucher scoreboard, because a private university librarian and a voucher-funded elementary teacher sit in the same bucket. It is still useful as a ceiling: the entire private education workforce is about two-fifths the local public-school workforce, and it has grown since the universal expansion.
The sharper payroll drop is on the public campus side. State-government educational services employed 101,900 in October 2025, down 11.4 percent from 115,000 in October 2019. May 2026 was 88,000, a seasonal campus trough. That is not EdChoice. It is a reminder that “education jobs” in Ohio are not one story. Local public schools held roughly steady. State universities did not. Collapsing those into a morality play about vouchers would be tidy, and wrong.
Households already spend more than $2 billion on private K-12
Household spending on nursery, elementary and secondary schools in Ohio was $2.13 billion in 2025. That is not the public-school budget. It is what families spend, mostly on private tuition and related outlays. It is more than twice the $1 billion-a-year voucher figure opponents used in court. It is also only 17.5 percent of Ohio’s $12.18 billion household education bill. Higher education took 60.9 percent, or $7.41 billion. Commercial and vocational schools took 20 percent, or $2.44 billion.
That private K-12 bill has grown: 28.3 percent since 2019 and 12.2 percent since 2022, in current dollars. The United States grew faster on the same line, 34.4 percent and 15.6 percent. Ohio is not sprinting away from the country. Per resident, Ohio households spent $179 on nursery and K-12 schools in 2025, 7.7 percent below the national $194. Indiana, Kentucky and Michigan spent less per person; Pennsylvania and Illinois spent more. If the voucher era were showing up as an Ohio household binge on private school, the official spending books do not isolate it.
Put the court’s “second system” next to those numbers and the proportions look different. Local public schools still employ about 298,000 people in a typical October. Households already spend $2.13 billion a year on private K-12, which is large next to a $1 billion voucher program and small next to what they spend on college. The series that actually shrank is state higher education employment. Readers can argue about constitutionality. They should not have to guess at the scale.
Ohio households spend far more on college than on private K-12

View exact chart values
| year | k12_billions | higher_ed_billions |
|---|---|---|
| 2010 | 1.327 | 6.464 |
| 2011 | 1.333 | 6.524 |
| 2012 | 1.347 | 6.411 |
| 2013 | 1.38 | 6.372 |
| 2014 | 1.418 | 6.292 |
| 2015 | 1.464 | 6.374 |
| 2016 | 1.54 | 6.415 |
| 2017 | 1.587 | 6.535 |
| 2018 | 1.657 | 6.639 |
| 2019 | 1.664 | 6.769 |
| 2020 | 1.65 | 6.745 |
| 2021 | 1.81 | 6.862 |
| 2022 | 1.903 | 7.009 |
| 2023 | 1.946 | 7.219 |
| 2024 | 2.002 | 7.351 |
| 2025 | 2.135 | 7.413 |
Ohio’s private K-12 bill is middling among its neighbours

View exact chart values
| state | k12_millions | population | k12_per_capita_dollars |
|---|---|---|---|
| Indiana | 1081.6 | 6973333 | 155.1 |
| Kentucky | 728.2 | 4606864 | 158.1 |
| Michigan | 1664.6 | 10127884 | 164.4 |
| Ohio | 2134.5 | 11900510 | 179.4 |
| United States | 66455.2 | 341784857 | 194.4 |
| Pennsylvania | 2862.1 | 13059432 | 219.2 |
| Illinois | 3171.4 | 12719141 | 249.3 |
College still dominates Ohio’s household education bill

View exact chart values
| category | millions | share_pct |
|---|---|---|
| Higher education | 7413 | 60.9 |
| Nursery, elementary and secondary | 2134.5 | 17.5 |
| Commercial and vocational schools | 2437.3 | 20 |
Sources and methods
Payroll figures are U.S. Bureau of Labor Statistics State and Area Employment series from the August 24, 2026 snapshot, with observations through August 2026. Local- and state-government educational services are not seasonally adjusted; October is used as an in-session snapshot because July and August drop tens of thousands of school jobs. Private educational services and total nonfarm are seasonally adjusted August levels. Private educational services include private colleges and training, not only K-12.
Household spending is Bureau of Economic Analysis personal consumption expenditures by state, 2025 vintage, in current dollars. The nursery, elementary and secondary line is household outlays, largely private tuition, not public-school appropriations. Per-person figures divide that line by BEA midyear resident population. Educational books, about 1.6 percent of Ohio household education spending in 2025, are omitted from the composition chart. Dollar changes are not inflation-adjusted.
The $1 billion-a-year voucher figure and the 180,000-student count come from contemporaneous reporting on the court ruling, not from these statistical series. Comparisons with that figure are scale checks only. The 2023 universal expansion is a date on the calendar, not an identified cause of later payroll or spending changes. Provider snapshots lag publication; 2025 PCE and population are annual, and 2026 payrolls are monthly.
Research completed 2026-10-16, for the October 15, 2026 news edition. The available source data may cover earlier periods; see the observation periods and source vintages above.