Research
Ohio’s homeownership crash is not a high-rent story
The occupation report, and a different set of books
The National Housing Conference’s latest Priced Out report, as Ohio Capital Journal summarized it, is blunt: Ohio had the steepest decline in homeownership affordability of any state between 2020 and 2025. Across Ohio metros, the share of occupations that could buy a typically priced home with 10 percent down fell from 67 percent to 26 percent. In Mansfield, a typical home jumped from about $115,000 to $189,000, and the income needed more than doubled. Firefighters and mail carriers who could buy five years ago cannot now. That is a mortgage-and-wage story about who still qualifies. It is not, by itself, a story about how large Ohio’s housing bill already is.
The official consumption books, last fully tabulated for calendar 2025 in the Bureau of Economic Analysis state PCE accounts, answer a different question: what households spent, or were imputed to spend, on shelter. Ohio’s housing line—tenant rent, the imputed rental value of owner-occupied homes, farm dwellings and group housing—rose from $64.4 billion in 2020 to $88.4 billion in 2025, a 37 percent increase (BEA state consumer spending). The U.S. housing line rose faster, 43 percent. Housing’s share of Ohio spending actually slipped a little, from 13.7 percent of personal consumption in 2020 to 13.4 percent in 2025, and stayed well below the national housing share of about 16 percent. Ohio did not become a high-rent state on these books. It became a slightly more expensive version of a still-cheap one.
That distinction matters because the occupation report and the BEA accounts are not measuring the same household. Priced Out asks whether a listed job can carry a newly purchased typical house at recent mortgage rates. BEA housing spending counts rent checks and an imputed rent for people who already own, whether or not they could qualify today. A teacher who bought in 2015 still shows up as an owner. A teacher who cannot buy in 2025 shows up as a renter only if she actually rents. The two pictures can diverge for years.
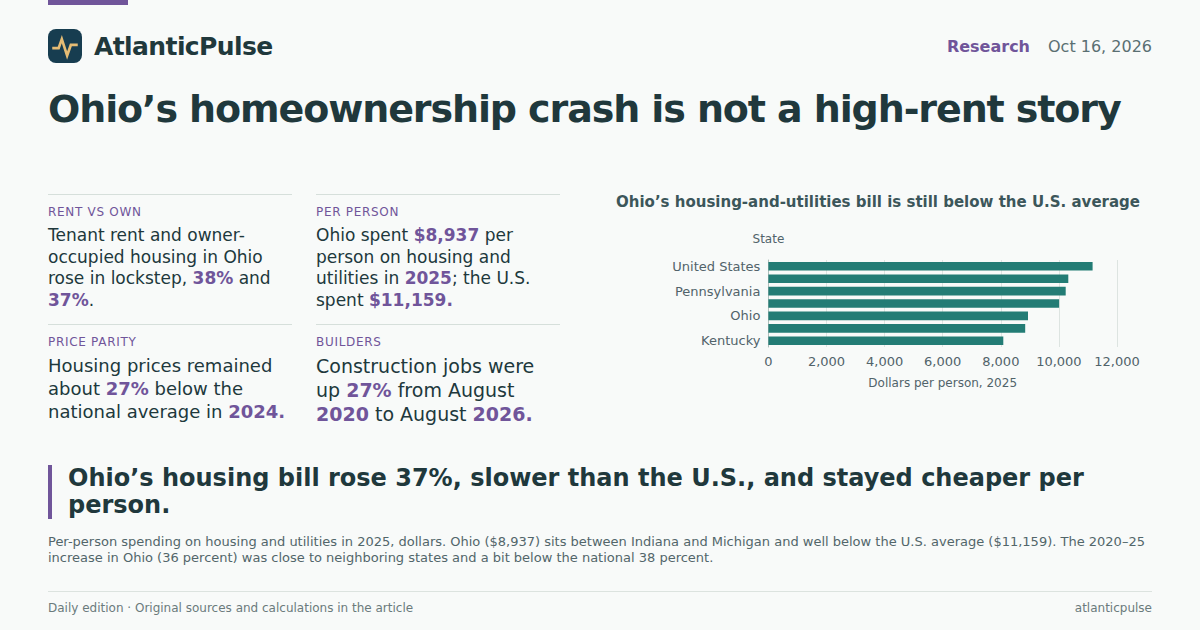
Ohio’s housing-and-utilities bill is still below the U.S. average

View exact chart values
| state | pc_housing_utilities_2025 | pc_housing_utilities_2020 | pct_change_2020_2025 |
|---|---|---|---|
| Kentucky | 8086 | 6073 | 33.1 |
| Indiana | 8839 | 6581 | 34.3 |
| Ohio | 8937 | 6560 | 36.2 |
| Michigan | 10007 | 7445 | 34.4 |
| Pennsylvania | 10235 | 7578 | 35.1 |
| Illinois | 10323 | 7708 | 33.9 |
| United States | 11159 | 8106 | 37.7 |
Tenants and owners moved in lockstep
If Ohio’s path to ownership had already collapsed into a rental surge, tenant-occupied rent should have pulled away from owner-occupied housing on the spending books. It did not. Tenant rent in Ohio rose from $12.5 billion in 2020 to $17.3 billion in 2025, or 38 percent. Imputed owner-occupied rent rose from $50.7 billion to $69.7 billion, or 37 percent. Nationally, tenant rent was up 44 percent and owner-occupied housing 42 percent. Ohio’s two series tracked each other, and both lagged the country.
Owner-occupied housing is not a mortgage payment. BEA imputes what the owner could have received by renting the house to a tenant. That is why the owner line is so much larger than the tenant line: most Ohioans still live in houses they own, even if fewer occupations can buy the next one. A 38 percent jump in tenant rent can still squeeze people who write rent checks every month. It is not evidence that Ohio has already flipped from an ownership state to a rental state.
Per person, Ohio spent $8,937 on housing and utilities in 2025, up 36 percent from $6,560 in 2020. That is more than Kentucky ($8,086) and Indiana ($8,839) and less than Michigan, Pennsylvania, Illinois and the U.S. average of $11,159. Ohio’s increase was in the same band as its neighbors and a shade below the national 38 percent. The state’s housing-and-utilities bill also took a larger bite of income: 13.2 percent of per-capita personal income in 2025, versus 12.4 percent in 2020, because nominal incomes rose 28 percent while the housing-and-utilities line rose 36 percent.
Ohio’s rent bill and owner-occupied housing rose together

View exact chart values
| year | ohio_owner_index | ohio_tenant_index | us_owner_index | us_tenant_index | ohio_owner_bil | ohio_tenant_bil |
|---|---|---|---|---|---|---|
| 2015 | 84.1 | 87.5 | 79.7 | 83 | 42.65 | 10.97 |
| 2016 | 87.4 | 90.1 | 83.1 | 85.8 | 44.34 | 11.3 |
| 2017 | 90.2 | 91.5 | 86.6 | 87 | 45.77 | 11.48 |
| 2018 | 93 | 93.4 | 90 | 91.4 | 47.16 | 11.71 |
| 2019 | 95.4 | 99.1 | 94.1 | 97 | 48.39 | 12.43 |
| 2020 | 100 | 100 | 100 | 100 | 50.72 | 12.54 |
| 2021 | 106.1 | 105.8 | 105.6 | 106.1 | 53.81 | 13.27 |
| 2022 | 112.7 | 113.2 | 114.6 | 115.9 | 57.15 | 14.19 |
| 2023 | 120.9 | 126 | 125.5 | 128.3 | 61.33 | 15.8 |
| 2024 | 131.2 | 132.8 | 134.6 | 136.8 | 66.57 | 16.66 |
| 2025 | 137.3 | 138.2 | 142.4 | 143.7 | 69.66 | 17.32 |
The price tag is still low. The paycheck, after inflation, is not keeping up.
Regional price parities make the cheapness explicit. In 2024, the latest year in the BEA price file, Ohio’s housing RPP was 73.0, meaning housing prices were about 27 percent below the national average of 100. That index was 73.3 in 2020. Ohio did not reprice toward California on this measure. All-items prices in Ohio were 92.8 percent of the U.S. average in 2024, a little closer to parity than in 2020, but housing remained the discount. BEA estimates those housing price levels from tenant-occupied units, not from asking prices on Mansfield listings, so they will not match a realtor’s median.
What did stall is purchasing power. Real per-capita personal income in Ohio, in 2017 dollars, was $55,074 in 2020 and $56,232 in 2024—a 2.1 percent increase over four years (BEA regional price parities). The nation rose 4.7 percent over the same span. 2020 is a messy base because federal transfers inflated incomes; even so, Ohio’s real paycheck has barely moved while the occupation report’s qualifying income in Mansfield more than doubled. Nominal per-capita personal income in Ohio did rise, from $52,855 in 2020 to $67,584 in 2025. Inflation and a housing market that is cheap relative to the coasts but expensive relative to a $70,000 firefighter salary can both be true.
Population is not the escape hatch. Ohio’s midyear population rose 0.9 percent from 2020 to 2025, to about 11.9 million. The housing bill grew because prices and imputed rents grew, not because millions of new residents arrived. A slow-growing state with cheap housing can still shut essential workers out of buying if mortgage rates and down payments do the rationing.
Ohio housing stayed cheap. Real incomes barely moved.

View exact chart values
| year | ohio_housing_rpp | ohio_all_items_rpp | ohio_real_pcpi | us_real_pcpi | ohio_real_pcpi_index | us_real_pcpi_index |
|---|---|---|---|---|---|---|
| 2015 | 75.6 | 92.2 | 48895 | 49396 | 88.8 | 87.4 |
| 2016 | 75.1 | 92.3 | 49223 | 49828 | 89.4 | 88.2 |
| 2017 | 75 | 91.9 | 50280 | 51006 | 91.3 | 90.3 |
| 2018 | 74.2 | 93 | 50500 | 52242 | 91.7 | 92.4 |
| 2019 | 73.5 | 93.3 | 51249 | 53683 | 93.1 | 95 |
| 2020 | 73.3 | 91.9 | 55074 | 56514 | 100 | 100 |
| 2021 | 72.8 | 92.2 | 57339 | 59365 | 104.1 | 105 |
| 2022 | 72.8 | 91.5 | 54882 | 57104 | 99.7 | 101 |
| 2023 | 72.1 | 91.9 | 55789 | 58088 | 101.3 | 102.8 |
| 2024 | 73 | 92.8 | 56232 | 59195 | 102.1 | 104.7 |
The construction payroll grew. Real construction output barely did.
A housing shortage story often implies that the builders left. Ohio’s seasonally adjusted construction payroll did the opposite. It fell in the 2020 shutdown, then climbed from 218,700 jobs in August 2020 to 260,400 in August 2025 and 278,200 in August 2026—a 27 percent increase over six years (BLS State and Area Employment). Total nonfarm employment in Ohio rose 9 percent over the same August-to-August span. From January 2020, construction was about 21 percent higher by August 2026; the rest of the job market was barely above water.
Neighbors did not all match that. Indiana’s construction payroll rose 27 percent from August 2020 to August 2026, Michigan 17 percent, Illinois 18 percent and Pennsylvania 7 percent. Ohio looks more like Indiana than like a state that stopped pouring slabs. These are all-construction jobs—highways, factories, data halls and houses mixed together—so they cannot prove that Ohio added the specific homes Priced Out says its workforce cannot buy. They can disprove a simple “the crews vanished” story.
Real construction GDP, in chained 2017 dollars, is the caution. Ohio’s construction output was $25.3 billion in 2020 and $26.3 billion in 2025, only 4 percent higher, while the state’s real GDP rose 12 percent. More people on construction payrolls without much more real output is consistent with cost inflation, mix shifts toward less housing, or both. Mansfield’s tiny mining-logging-and-construction series, rounded to the nearest hundred jobs, went from 2,200 in August 2020 to 2,300 in August 2025; Cleveland’s larger combined series rose from 39,800 to 44,700. Neither metro series is housing-only. The occupation report’s firefighters still cannot buy. The official job count says someone was hiring.
Ohio construction payrolls grew faster than in Pennsylvania

View exact chart values
| year | ohio_const_thousands | ohio_nfp_thousands | ohio_const_index | indiana_const_index | michigan_const_index | pennsylvania_const_index | illinois_const_index |
|---|---|---|---|---|---|---|---|
| 2019 | 227.7 | 5602.2 | 104.1 | 101.7 | 102 | 107.3 | 106.9 |
| 2020 | 218.7 | 5229.6 | 100 | 100 | 100 | 100 | 100 |
| 2021 | 225.3 | 5414.2 | 103 | 105.1 | 104 | 104.5 | 103 |
| 2022 | 234.1 | 5551.5 | 107 | 110.4 | 107.7 | 105.5 | 108.1 |
| 2023 | 238.2 | 5630 | 108.9 | 113.3 | 111.7 | 106.3 | 109.1 |
| 2024 | 251 | 5656.4 | 114.8 | 118.8 | 115 | 106 | 109.8 |
| 2025 | 260.4 | 5678.8 | 119.1 | 123.9 | 119.1 | 107.8 | 111.6 |
| 2026 | 278.2 | 5688.7 | 127.2 | 126.6 | 116.8 | 106.6 | 117.8 |
Ohio’s builders hired. The rest of the job market did not keep up.

View exact chart values
| month | ohio_construction_thousands | ohio_construction_index | ohio_nonfarm_index |
|---|---|---|---|
| 2019-01 | 224.9 | 97.6 | 99.5 |
| 2019-02 | 223.6 | 97 | 99.5 |
| 2019-03 | 224.6 | 97.4 | 99.6 |
| 2019-04 | 224.9 | 97.6 | 99.6 |
| 2019-05 | 225.5 | 97.8 | 99.7 |
| 2019-06 | 225.9 | 98 | 99.7 |
| 2019-07 | 226.9 | 98.4 | 99.8 |
| 2019-08 | 227.7 | 98.8 | 99.8 |
| 2019-09 | 228.4 | 99.1 | 99.8 |
| 2019-10 | 230.3 | 99.9 | 99.8 |
| 2019-11 | 229.7 | 99.7 | 99.9 |
| 2019-12 | 229.8 | 99.7 | 100 |
| 2020-01 | 230.5 | 100 | 100 |
| 2020-02 | 230.4 | 100 | 99.9 |
| 2020-03 | 227.9 | 98.9 | 99 |
| 2020-04 | 193.7 | 84 | 84.3 |
| 2020-05 | 209.4 | 90.8 | 87.4 |
| 2020-06 | 214.2 | 92.9 | 91.5 |
| 2020-07 | 216.2 | 93.8 | 92.4 |
| 2020-08 | 218.7 | 94.9 | 93.2 |
| 2020-09 | 220.5 | 95.7 | 94 |
| 2020-10 | 221 | 95.9 | 94.5 |
| 2020-11 | 221.4 | 96.1 | 94.7 |
| 2020-12 | 221.8 | 96.2 | 94.7 |
| 2021-01 | 221.9 | 96.3 | 95 |
| 2021-02 | 217.2 | 94.2 | 95 |
| 2021-03 | 220.9 | 95.8 | 95.3 |
| 2021-04 | 222.9 | 96.7 | 95.2 |
| 2021-05 | 222.1 | 96.4 | 95.3 |
| 2021-06 | 221.4 | 96.1 | 95.6 |
| 2021-07 | 224.7 | 97.5 | 96.4 |
| 2021-08 | 225.3 | 97.7 | 96.5 |
| 2021-09 | 225.1 | 97.7 | 96.1 |
| 2021-10 | 227.4 | 98.7 | 97 |
| 2021-11 | 229.7 | 99.7 | 97.3 |
| 2021-12 | 230.2 | 99.9 | 97.5 |
| 2022-01 | 230.3 | 99.9 | 97.6 |
| 2022-02 | 229.7 | 99.7 | 97.9 |
| 2022-03 | 231.7 | 100.5 | 98.1 |
| 2022-04 | 233.4 | 101.3 | 98.5 |
| 2022-05 | 234.4 | 101.7 | 98.5 |
| 2022-06 | 233.5 | 101.3 | 98.5 |
| 2022-07 | 233.8 | 101.4 | 98.9 |
| 2022-08 | 234.1 | 101.6 | 98.9 |
| 2022-09 | 234.5 | 101.7 | 99 |
| 2022-10 | 234.9 | 101.9 | 99.1 |
| 2022-11 | 235.5 | 102.2 | 99.1 |
| 2022-12 | 236 | 102.4 | 99.2 |
| 2023-01 | 238.2 | 103.3 | 99.7 |
| 2023-02 | 238 | 103.3 | 99.8 |
| 2023-03 | 236.7 | 102.7 | 99.8 |
| 2023-04 | 236.7 | 102.7 | 99.8 |
| 2023-05 | 236.2 | 102.5 | 99.9 |
| 2023-06 | 237.3 | 103 | 100.3 |
| 2023-07 | 237.6 | 103.1 | 100.3 |
| 2023-08 | 238.2 | 103.3 | 100.3 |
| 2023-09 | 239.3 | 103.8 | 100.4 |
| 2023-10 | 239.4 | 103.9 | 100.2 |
| 2023-11 | 239.6 | 103.9 | 100.3 |
| 2023-12 | 241 | 104.6 | 100.4 |
| 2024-01 | 242.8 | 105.3 | 100.5 |
| 2024-02 | 245 | 106.3 | 100.6 |
| 2024-03 | 245.6 | 106.6 | 100.8 |
| 2024-04 | 244.1 | 105.9 | 100.7 |
| 2024-05 | 246.5 | 106.9 | 100.8 |
| 2024-06 | 248.4 | 107.8 | 100.9 |
| 2024-07 | 249.9 | 108.4 | 100.8 |
| 2024-08 | 251 | 108.9 | 100.8 |
| 2024-09 | 252.2 | 109.4 | 101 |
| 2024-10 | 253.8 | 110.1 | 100.9 |
| 2024-11 | 254.9 | 110.6 | 101 |
| 2024-12 | 255.4 | 110.8 | 101 |
| 2025-01 | 253.6 | 110 | 100.8 |
| 2025-02 | 256 | 111.1 | 100.9 |
| 2025-03 | 256.8 | 111.4 | 100.9 |
| 2025-04 | 257.1 | 111.5 | 101 |
| 2025-05 | 258.7 | 112.2 | 101.1 |
| 2025-06 | 258.8 | 112.3 | 100.9 |
| 2025-07 | 259.5 | 112.6 | 101.1 |
| 2025-08 | 260.4 | 113 | 101.2 |
| 2025-09 | 260.5 | 113 | 101 |
| 2025-10 | 258.5 | 112.1 | 100.8 |
| 2025-11 | 260.6 | 113.1 | 100.9 |
| 2025-12 | 262.2 | 113.8 | 100.9 |
| 2026-01 | 261.6 | 113.5 | 101.1 |
| 2026-02 | 262.7 | 114 | 101 |
| 2026-03 | 267.5 | 116.1 | 101.2 |
| 2026-04 | 267.3 | 116 | 101.3 |
| 2026-05 | 266.8 | 115.7 | 101.2 |
| 2026-06 | 270.2 | 117.2 | 101.3 |
| 2026-07 | 273.6 | 118.7 | 101.3 |
| 2026-08 | 278.2 | 120.7 | 101.4 |
What readers should take from the mismatch
The honest reading is unsatisfying in the way accounting often is. Ohio’s homeownership ladder shortened for people who still need a mortgage. That is the Priced Out finding, and nothing in the BEA or BLS files refutes a qualifying-income collapse in Mansfield. What the official books add is that Ohio did not get there by turning into a high-rent, low-construction state. Housing remains cheap relative to the country. Tenant rent did not race ahead of owner-occupied housing. Construction employment grew faster than the rest of the state’s payroll. Real incomes, after the 2020 spike, hardly grew at all.
That combination is worse, in a way, than a simple supply shortage. If the problem were only too few crews, a construction boom might close it. If the problem is that a typical house now requires an income many essential jobs do not pay, while real paychecks are flat, more electricians on the books will not automatically restore the 2020 buyer. The National Housing Conference’s prescription—build near jobs, cut delays, raise supply—still has to clear a mortgage-rate and wage test the BEA accounts do not take.
None of these series is a causal model of why Ohio ranked first in the occupation drop. They are a check on what “Ohio cannot afford homes” means on the government’s own ledgers. It means the qualifying math got worse. It does not mean Ohio households already spend like coastal renters, or that the construction workforce packed up.
Sources and methods
Figures and claims use pinned catalogue snapshots, not live downloads. BEA state personal consumption expenditures (SAPCE) run through calendar year 2025 in a snapshot built from the September 30, 2026 regional release. BEA regional price parities and real personal income run through 2024. BEA annual GDP, population and nominal per-capita personal income run through 2025. BLS State and Area Employment figures are monthly through August 2026 in the August 24, 2026 SAE snapshot. Provider lag is normal; these are not current-day observations.
Housing in the PCE function table is current-dollar spending on tenant-occupied nonfarm rent, imputed rental of owner-occupied nonfarm housing, farm dwellings and group housing. Imputed owner-occupied rent is not a mortgage payment. Housing-and-utilities per-capita series also include electricity, gas, water and sanitation. Regional housing price parities are estimated from tenant-occupied housing and are indexed so the U.S. equals 100. Real per-capita personal income is in chained 2017 dollars. 2020 incomes include pandemic transfers, so 2020–2024 real-income changes should not be read as a pure wage path.
Construction employment is seasonally adjusted statewide payrolls for NAICS construction, all employees, in thousands. Neighbor comparisons use August of each year to line up with the latest 2026 month. Metro Mansfield and Cleveland series are not seasonally adjusted and combine mining, logging and construction; Mansfield values are small and rounded. Real construction GDP is chained 2017 dollars for all construction, not residential building alone. Missing observations were skipped and never treated as zero. No causal effect is inferred from these descriptive comparisons. The National Housing Conference occupation-affordability figures are from contemporaneous reporting, not from these extracts.
Research completed 2026-10-18, for the October 16, 2026 news edition. The available source data may cover earlier periods; see the observation periods and source vintages above.