Research
Ohio’s $6 diesel fight is landing on a $14 billion household fuel bill
A tax holiday looking for a household bill
Ohio’s Republican leaders came back to Columbus this week to try a 90-day pause of the state fuel tax after Midwest diesel broke $6 a gallon, topping the June 2022 record. The pitch is simple: harvest is coming, pumps hurt, and a 38.5-cent gasoline tax — 47 cents on diesel — is the lever they can still pull. House Speaker Matt Huffman wants a vote next Wednesday. Without Democratic help, the cut cannot take effect before November. The dollar figure attached to the pause is about $678 million in lost road-and-bridge revenue, to be backfilled from reserves.
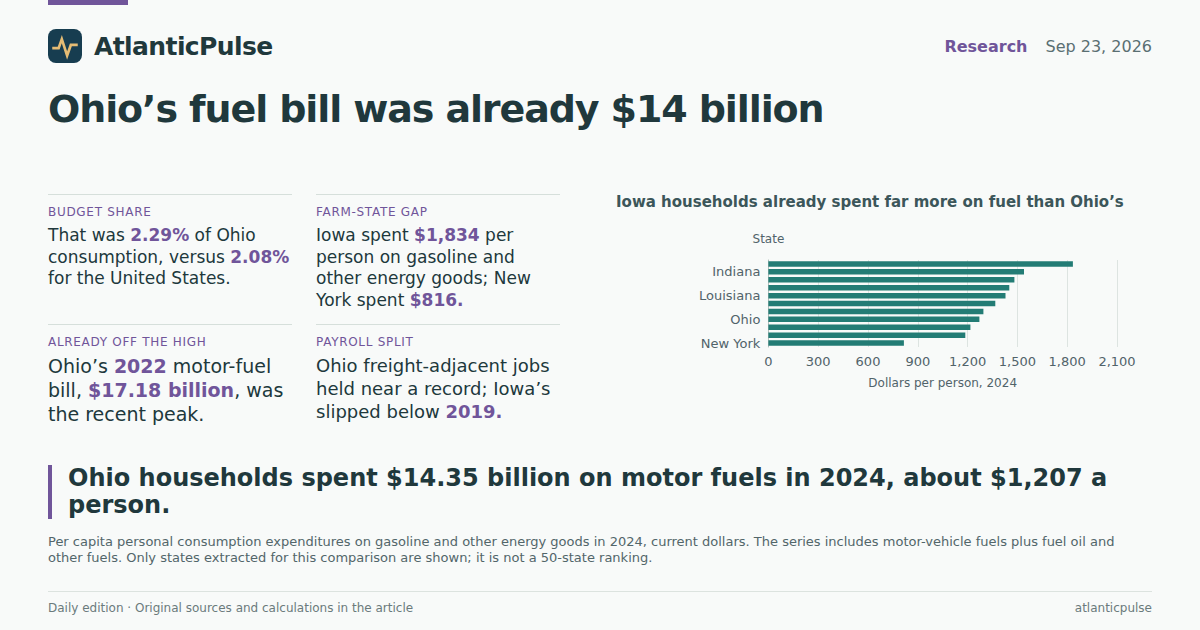
That is real money for the Ohio Department of Transportation. It is a much smaller slice of what Ohio households already spend to move around. In calendar year 2024, the latest year in the Bureau of Economic Analysis’s state consumption accounts, Ohio residents spent $14.35 billion on motor vehicle fuels, lubricants, and fluids — about $1,207 per person, or 2.29 percent of all personal consumption in the state. The United States as a whole spent 2.08 percent of consumption on the same category. A $678 million tax holiday is less than 5 percent of that 2024 household fuel bill. It is not a rounding error. It is also not a rewrite of the diesel invoice.
Two caveats belong next to those numbers, not in a footnote. First, BEA’s motor-fuel series is household spending. It does not count diesel burned in farm tractors, grain trucks, or for-hire freight, which is the part of the spike that farmers and shippers are actually yelling about. Second, 2024 is not September 2026. The official books closed before this month’s record diesel print. What they can tell readers is the size of the bill Ohio already had, and whether Ohio was an outlier before the latest panic.
Ohio households spent $14.3 billion on motor fuels in 2024

View exact chart values
| year | motor_fuels_billions | share_of_pce_pct |
|---|---|---|
| 1997 | 5.38 | 2.46 |
| 1998 | 4.85 | 2.1 |
| 1999 | 5.65 | 2.31 |
| 2000 | 7.05 | 2.71 |
| 2001 | 6.36 | 2.35 |
| 2002 | 6.11 | 2.18 |
| 2003 | 7.13 | 2.43 |
| 2004 | 8.13 | 2.66 |
| 2005 | 9.48 | 2.96 |
| 2006 | 10.39 | 3.14 |
| 2007 | 12.25 | 3.57 |
| 2008 | 12.69 | 3.64 |
| 2009 | 9.48 | 2.76 |
| 2010 | 11.7 | 3.29 |
| 2011 | 14.81 | 4.01 |
| 2012 | 15.52 | 4.06 |
| 2013 | 15.4 | 3.9 |
| 2014 | 14.93 | 3.67 |
| 2015 | 11.81 | 2.82 |
| 2016 | 10.44 | 2.42 |
| 2017 | 11.6 | 2.59 |
| 2018 | 12.76 | 2.75 |
| 2019 | 12.24 | 2.57 |
| 2020 | 8.67 | 1.85 |
| 2021 | 12.88 | 2.47 |
| 2022 | 17.18 | 3.04 |
| 2023 | 15.66 | 2.62 |
| 2024 | 14.35 | 2.29 |
Ohio is not Iowa
On a per-person basis, Ohio’s fuel bill looks stubbornly ordinary. BEA’s broader “gasoline and other energy goods” series — motor fuels plus fuel oil and other fuels — put Ohio at $1,271 per person in 2024, a shade below the U.S. figure of $1,295. Fuel oil is a small extra in Ohio: households spent $760 million on it in 2024, against $14.35 billion on motor fuels. The state’s fuel problem, on the household books, is gasoline and diesel at the pump, not heating oil in the basement.
The states that actually look stretched are the ones sending the harvest-season distress calls. Among the states pulled for this comparison, Iowa spent $1,834 per person on gasoline and other energy goods in 2024 — more than double New York’s $816, and about $560 more than Ohio. Indiana ($1,540), Minnesota ($1,482), Alabama ($1,451), and Louisiana ($1,428) all sat above the national average. Illinois ($1,186) and California ($1,217) sat below it. Texas, which lives in the same diesel-and-freight world, came in at $1,367.
That ranking is not a morality play about SUVs. It is mostly geography, driving, and what BEA puts in the category. New York’s low figure reflects denser transit and, even with some heating oil, less driving. Iowa’s high figure is what a spread-out farm state looks like when every errand is a car trip — and it still understates the diesel that never shows up as household consumption. If the political question is “who feels $6 diesel,” the household books say start in Iowa and Indiana, not in a belief that Ohioans were already the country’s most exposed drivers.
Iowa households already spent far more on fuel than Ohio’s

View exact chart values
| state | per_capita_dollars |
|---|---|
| New York | 816 |
| Illinois | 1186 |
| California | 1217 |
| Ohio | 1271 |
| United States | 1295 |
| Texas | 1367 |
| Louisiana | 1428 |
| Alabama | 1451 |
| Minnesota | 1482 |
| Indiana | 1540 |
| Iowa | 1834 |
Ohio’s household fuel bill tracks the nation — and 2022 was the peak

View exact chart values
| year | ohio_dollars | us_dollars |
|---|---|---|
| 1997 | 525 | 542 |
| 1998 | 471 | 480 |
| 1999 | 548 | 525 |
| 2000 | 683 | 654 |
| 2001 | 613 | 625 |
| 2002 | 584 | 584 |
| 2003 | 682 | 677 |
| 2004 | 773 | 795 |
| 2005 | 902 | 960 |
| 2006 | 988 | 1071 |
| 2007 | 1152 | 1147 |
| 2008 | 1202 | 1286 |
| 2009 | 896 | 936 |
| 2010 | 1095 | 1088 |
| 2011 | 1387 | 1327 |
| 2012 | 1436 | 1342 |
| 2013 | 1431 | 1331 |
| 2014 | 1385 | 1287 |
| 2015 | 1088 | 991 |
| 2016 | 953 | 885 |
| 2017 | 1055 | 992 |
| 2018 | 1159 | 1116 |
| 2019 | 1103 | 1067 |
| 2020 | 783 | 779 |
| 2021 | 1152 | 1162 |
| 2022 | 1547 | 1541 |
| 2023 | 1395 | 1380 |
| 2024 | 1271 | 1295 |
The peak on paper was 2022, not this week
The last time diesel set a record, the household books moved. Ohio’s motor-fuel spending hit $17.18 billion in 2022, or $1,459 per person, and 3.04 percent of statewide consumption. Per capita spending on gasoline and other energy goods peaked the same year at $1,547 in Ohio and $1,541 nationally. Then it eased: $1,395 in Ohio in 2023, $1,271 in 2024. The dollar bill shrank as prices came off that peak, even as total consumption kept growing.
The share of the budget tells a longer story than the latest panic. Motor fuels took 4.06 percent of Ohio consumption in 2012 and 4.01 percent in 2011, when prices were high and the rest of the household budget was smaller. By 2020 the share had fallen to 1.85 percent. The 2024 share, 2.29 percent, is closer to the late-1990s than to the 2012 squeeze. A falling share does not mean fuel got cheap in some moral sense. It means other spending grew faster, and that 2022’s spike, ugly as it was, did not permanently reprice the Ohio household.
That is the awkward backdrop for a 90-day tax holiday sold as emergency medicine. The official household series, which ends in 2024, shows a bill that had already come down from a recent high. The 2026 diesel spike may well push 2026 spending back up. It had not, as of the last full year, left Ohio households spending a uniquely large share of their money on fuel.
Fuel’s slice of Ohio spending is smaller than the 2012 peak

View exact chart values
| year | motor_fuels_billions | share_of_pce_pct |
|---|---|---|
| 1997 | 5.38 | 2.46 |
| 1998 | 4.85 | 2.1 |
| 1999 | 5.65 | 2.31 |
| 2000 | 7.05 | 2.71 |
| 2001 | 6.36 | 2.35 |
| 2002 | 6.11 | 2.18 |
| 2003 | 7.13 | 2.43 |
| 2004 | 8.13 | 2.66 |
| 2005 | 9.48 | 2.96 |
| 2006 | 10.39 | 3.14 |
| 2007 | 12.25 | 3.57 |
| 2008 | 12.69 | 3.64 |
| 2009 | 9.48 | 2.76 |
| 2010 | 11.7 | 3.29 |
| 2011 | 14.81 | 4.01 |
| 2012 | 15.52 | 4.06 |
| 2013 | 15.4 | 3.9 |
| 2014 | 14.93 | 3.67 |
| 2015 | 11.81 | 2.82 |
| 2016 | 10.44 | 2.42 |
| 2017 | 11.6 | 2.59 |
| 2018 | 12.76 | 2.75 |
| 2019 | 12.24 | 2.57 |
| 2020 | 8.67 | 1.85 |
| 2021 | 12.88 | 2.47 |
| 2022 | 17.18 | 3.04 |
| 2023 | 15.66 | 2.62 |
| 2024 | 14.35 | 2.29 |
The payrolls did not crash in Columbus. They sagged in Des Moines.
If $6 diesel were already taking a scythe to freight work, it should show up in payrolls. Ohio’s transportation, warehousing, and utilities sector — the Bureau of Labor Statistics bundle that mixes trucking with power companies — employed 277,000 people in July 2026, seasonally adjusted, versus 231,500 in January 2019. The recent peak was 280,000 in April 2026. Indexed to early 2019, that is about 120. Ohio’s total nonfarm payroll, over the same span, is only about 102. The freight-and-utilities slice grew faster than the rest of the state’s job market, and it had not rolled over as of the July snapshot.
Iowa is the contrast the harvest news implies. The same transportation-warehousing-utilities grouping stood at 68,400 jobs in July 2026, a tick below 69,100 in January 2019 and well below a 72,300 peak in March 2022. Iowa’s index is 99. That is not a collapse. It is a grind: a farm-and-freight state whose logistics payroll peaked four years ago and has been leaking since. The series cannot separate a trucking layoff from a utility hiring freeze, and it cannot prove diesel caused the drift. It can say the official job count in Iowa’s freight-adjacent sector was already softer before this month’s record print, while Ohio’s was not.
None of that makes $6 diesel a vibe. It does mean a gas-tax holiday sold as job protection in Ohio is aiming at a workforce that, on the books through July, was still near a record. The weaker payroll is next door, in the state whose households already spent the most per person on fuel.
Ohio freight payrolls held up. Iowa’s did not.

View exact chart values
| period | ohio_twu_index | iowa_twu_index | ohio_nonfarm_index |
|---|---|---|---|
| 2019-01 | 100 | 100 | 100 |
| 2019-02 | 99.8 | 99.7 | 100 |
| 2019-03 | 99.6 | 100 | 100.1 |
| 2019-04 | 100 | 100.3 | 100.1 |
| 2019-05 | 100.7 | 100.3 | 100.2 |
| 2019-06 | 101.7 | 100.4 | 100.2 |
| 2019-07 | 102.8 | 101 | 100.2 |
| 2019-08 | 103.4 | 100.6 | 100.3 |
| 2019-09 | 103.8 | 100.4 | 100.3 |
| 2019-10 | 104.4 | 100.3 | 100.2 |
| 2019-11 | 105.9 | 100.1 | 100.4 |
| 2019-12 | 106.3 | 100.3 | 100.4 |
| 2020-01 | 105.8 | 99.7 | 100.5 |
| 2020-02 | 106 | 99 | 100.4 |
| 2020-03 | 106.3 | 99.3 | 99.5 |
| 2020-04 | 100 | 95.8 | 84.7 |
| 2020-05 | 105.2 | 96.2 | 87.8 |
| 2020-06 | 107.6 | 97.1 | 91.9 |
| 2020-07 | 107.9 | 97.5 | 92.9 |
| 2020-08 | 108.3 | 98.1 | 93.6 |
| 2020-09 | 108.9 | 98.4 | 94.5 |
| 2020-10 | 109.4 | 99.3 | 94.9 |
| 2020-11 | 110.2 | 99.6 | 95.1 |
| 2020-12 | 110.6 | 100.1 | 95.2 |
| 2021-01 | 113.3 | 101.2 | 95.5 |
| 2021-02 | 112.1 | 100.6 | 95.4 |
| 2021-03 | 112.3 | 100.7 | 95.8 |
| 2021-04 | 112.4 | 100.3 | 95.6 |
| 2021-05 | 112.2 | 100.9 | 95.8 |
| 2021-06 | 112.6 | 101.4 | 96.1 |
| 2021-07 | 113.7 | 102.5 | 96.8 |
| 2021-08 | 114.3 | 102.7 | 96.9 |
| 2021-09 | 114.5 | 102.6 | 96.6 |
| 2021-10 | 115.5 | 102.3 | 97.5 |
| 2021-11 | 115.9 | 103.6 | 97.8 |
| 2021-12 | 116.9 | 104.1 | 98 |
| 2022-01 | 117.3 | 103.6 | 98.1 |
| 2022-02 | 119.2 | 104.5 | 98.4 |
| 2022-03 | 120 | 104.6 | 98.6 |
| 2022-04 | 119.4 | 103.9 | 99 |
| 2022-05 | 119.2 | 104.2 | 99 |
| 2022-06 | 118.7 | 103.9 | 98.9 |
| 2022-07 | 118.3 | 103.8 | 99.3 |
| 2022-08 | 118.1 | 103.8 | 99.4 |
| 2022-09 | 118.4 | 104.3 | 99.5 |
| 2022-10 | 117.8 | 104.5 | 99.6 |
| 2022-11 | 117.1 | 103.9 | 99.6 |
| 2022-12 | 116.5 | 103.6 | 99.6 |
| 2023-01 | 117.1 | 103.8 | 100.1 |
| 2023-02 | 117.1 | 103.6 | 100.2 |
| 2023-03 | 117.1 | 103.2 | 100.3 |
| 2023-04 | 117.5 | 103.3 | 100.3 |
| 2023-05 | 117.9 | 103.2 | 100.4 |
| 2023-06 | 118.1 | 103.2 | 100.8 |
| 2023-07 | 117.9 | 102.3 | 100.7 |
| 2023-08 | 116.8 | 102 | 100.8 |
| 2023-09 | 118.6 | 102 | 100.9 |
| 2023-10 | 120.3 | 102.3 | 100.7 |
| 2023-11 | 120.1 | 102.5 | 100.7 |
| 2023-12 | 119.7 | 102.6 | 100.9 |
| 2024-01 | 119.7 | 99.6 | 101 |
| 2024-02 | 119.2 | 102 | 101.1 |
| 2024-03 | 119.3 | 102.2 | 101.3 |
| 2024-04 | 119.7 | 102.7 | 101.1 |
| 2024-05 | 119.8 | 103 | 101.3 |
| 2024-06 | 119.9 | 102.5 | 101.4 |
| 2024-07 | 119.9 | 103.2 | 101.3 |
| 2024-08 | 119.8 | 104.2 | 101.3 |
| 2024-09 | 119.8 | 103.5 | 101.5 |
| 2024-10 | 119.4 | 102.7 | 101.4 |
| 2024-11 | 120 | 102.9 | 101.5 |
| 2024-12 | 120.1 | 102.7 | 101.5 |
| 2025-01 | 119.4 | 103 | 101.3 |
| 2025-02 | 119.5 | 103 | 101.4 |
| 2025-03 | 119.5 | 103 | 101.4 |
| 2025-04 | 119.1 | 102.7 | 101.5 |
| 2025-05 | 119.4 | 102.7 | 101.6 |
| 2025-06 | 119.8 | 102.6 | 101.4 |
| 2025-07 | 120.5 | 102.5 | 101.6 |
| 2025-08 | 120.8 | 102.3 | 101.7 |
| 2025-09 | 120.5 | 102.3 | 101.5 |
| 2025-10 | 118.8 | 100.4 | 101.3 |
| 2025-11 | 117.9 | 99.6 | 101.3 |
| 2025-12 | 119.3 | 99.6 | 101.4 |
| 2026-01 | 119 | 99.6 | 101.6 |
| 2026-02 | 119.1 | 98.8 | 101.5 |
| 2026-03 | 120 | 99.3 | 101.7 |
| 2026-04 | 121 | 99.9 | 101.8 |
| 2026-05 | 119.9 | 99.6 | 101.7 |
| 2026-06 | 119.4 | 99.3 | 101.8 |
| 2026-07 | 119.7 | 99 | 101.9 |
What a 90-day pause cannot buy
Put the pieces in one place. Ohio households spent $14.35 billion on motor fuels in 2024, a typical American share of the budget, after a 2022 spike had already faded on paper. Iowa households spent far more per person. Ohio’s freight-adjacent payrolls were still elevated; Iowa’s were not. The tax holiday under debate would forgo about $678 million, a few percent of Ohio’s annual household fuel bill and a large hole in the road fund unless reserves refill it.
The move may still be good politics. Early voting starts October 6, and $4.48 gasoline is easier to campaign on than a chained-dollar table. It is weaker economics. Household PCE will not capture the diesel in a combine. A 90-day cut will not reset a global middle distillate market. And if the test is “who was already living with a fat fuel bill and a softer logistics payroll,” the official numbers point west of the Ohio River, not at a belief that Columbus had uniquely failed to keep the lights on at the pump.
The next useful print is not another press conference. It is 2025 and 2026 consumption, when they arrive, and a trucking-only payroll series that does not hide behind utilities. Until then, the honest sentence is narrower: Ohio is arguing over a modest tax pause against a household fuel bill that was large, ordinary, and already off its 2022 high — while the farm states that spend more per person, and the Iowa payroll that already sagged, sit in the same diesel storm with less of a hearing.
Sources and methods
State consumption figures are annual BEA Personal Consumption Expenditures by State (SAPCE), current dollars, calendar years 1997–2024, from the September 26, 2025 SAPCE release in a snapshot dated August 31, 2026. They are not 2026 observations and are not adjusted for inflation. Motor vehicle fuels, lubricants, and fluids are household purchases; they exclude farm diesel and for-hire trucking fuel. The broader gasoline-and-other-energy-goods per capita series also includes fuel oil and other fuels. Per-person motor-fuel estimates divide state motor-fuel totals by population implied from total PCE and per capita PCE. Employment figures are BLS State and Area Employment, seasonally adjusted, through July 2026, from an August 24, 2026 snapshot. The transportation, warehousing, and utilities supersector mixes freight with utilities and is not a pure trucking count. Indexes use January 2019=100. Comparisons cover only states extracted for this piece, not a full 50-state ranking. No causal effect is inferred from the diesel spike or the proposed tax holiday. The $678 million holiday figure is from contemporaneous Ohio political reporting, not from BEA.
Research completed 2026-09-24, for the September 23, 2026 news edition. The available source data may cover earlier periods; see the observation periods and source vintages above.