Research
Nine Times the Size: What the New Russia Sanctions Law Is Actually Aimed At
A bill with a bayonet, waiting for a signature
Wednesday, the House passed the most ambitious Russia sanctions legislation in two years, 262-159, and sent it to President Trump's desk. The bill, named for the late Sen. Lindsey Graham, sanctions Russian officials, banks and the shadow-fleet tankers that keep Russian energy moving - and directs the president to impose tariffs of up to 100% on the top five importers of Russian oil or gas, with a carve-out for countries buying less than 15% of Russia's gas exports. The Senate had already approved it 86-11 (AP via Times Leader).
Supporters say the tariff provisions are aimed squarely at deterring China and India from buying Russian crude; the Kremlin warns the law would complicate peace efforts; India insists its energy security is non-negotiable. Strip away the choreography and one practical question remains: what would this weapon actually do to the Russian war economy - and what would it do to the buyers it targets? The IMF's World Economic Outlook, the closest thing the world has to an agreed set of macroeconomic scorecards, offers a surprisingly specific answer.
What sanctions already did - and didn't do
The record so far is humbling for anyone who expected an embargo to crater Russian output. In 2022, the first full sanctions year, Russia's real GDP shrank just 1.4%. It then grew 4.1% in 2023 and 4.9% in 2024, as military spending doubled as stimulus and oil found new buyers in Asia. Across 2022-2025, the Fund's arithmetic adds up to roughly +8.7% cumulative growth - an economy that bent, reorganized, and kept producing (all figures from the IMF's spring 2026 vintage, with 2025 an estimate).
But look at the right edge of the chart and the sugar high is clearly over. The IMF estimates growth of about 1.0% in 2025 and projects roughly 1.1% for 2026 and 2027 - back near the mediocre trendline Russia had before the war. In other words: sanctions didn't break the Russian economy, and the new law starts from an economy that is already idling.
Russia's war economy: the rebound is over

View exact chart values
| year | value_pct | phase |
|---|---|---|
| 2000 | 10.05 | observed |
| 2001 | 5.08 | observed |
| 2002 | 4.75 | observed |
| 2003 | 7.36 | observed |
| 2004 | 7.15 | observed |
| 2005 | 6.4 | observed |
| 2006 | 8.17 | observed |
| 2007 | 8.55 | observed |
| 2008 | 5.25 | observed |
| 2009 | -7.82 | observed |
| 2010 | 4.51 | observed |
| 2011 | 3.99 | observed |
| 2012 | 4.02 | observed |
| 2013 | 1.76 | observed |
| 2014 | 0.74 | observed |
| 2015 | -1.97 | observed |
| 2016 | 0.19 | observed |
| 2017 | 1.83 | observed |
| 2018 | 2.81 | observed |
| 2019 | 2.2 | observed |
| 2020 | -2.65 | observed |
| 2021 | 5.87 | observed |
| 2022 | -1.44 | observed |
| 2023 | 4.07 | observed |
| 2024 | 4.92 | observed |
| 2025 | 0.98 | estimate |
| 2026 | 1.09 | projection |
| 2027 | 1.09 | projection |
| 2028 | 1 | projection |
| 2029 | 1 | projection |
| 2030 | 1 | projection |
| 2031 | 1 | projection |
The overheat, not the embargo
Where Russia hurts is prices. Consumer inflation hit 13.8% in 2022 and, per the Fund, was still running at 8.4% in 2024 and an estimated 8.7% in 2025 - the macro bill for labor shortages, military demand and a ruble that travels badly. The projections have it easing to 5.6% in 2026 and 4.3% in 2027, which would be relief, not victory.
The energy windfall has also thinned. Russia's current-account surplus - the broadest gauge of its oil-and-gas earnings power - peaked at 10.4% of GDP in 2022, fell to 2.9% by 2024 and an estimated 1.6% in 2025, as discounted barrels and rerouting costs ate the premium. The Fund projects a partial recovery to roughly 2-3% of GDP in 2026-2027. One caveat deserves its own sentence: this vintage was assembled before the current Strait of Hormuz escalation pushed Brent toward $106 a barrel, so the next IMF edition may well show the blockade money showing up in Russian numbers.
Sanctions did not break Russian prices — the overheat did

View exact chart values
| year | value_pct | phase |
|---|---|---|
| 2000 | 20.8 | observed |
| 2001 | 21.48 | observed |
| 2002 | 15.79 | observed |
| 2003 | 13.66 | observed |
| 2004 | 10.89 | observed |
| 2005 | 12.69 | observed |
| 2006 | 9.67 | observed |
| 2007 | 9.01 | observed |
| 2008 | 14.11 | observed |
| 2009 | 11.65 | observed |
| 2010 | 6.85 | observed |
| 2011 | 8.44 | observed |
| 2012 | 5.07 | observed |
| 2013 | 6.75 | observed |
| 2014 | 7.82 | observed |
| 2015 | 15.53 | observed |
| 2016 | 7.04 | observed |
| 2017 | 3.68 | observed |
| 2018 | 2.88 | observed |
| 2019 | 4.47 | observed |
| 2020 | 3.38 | observed |
| 2021 | 6.69 | observed |
| 2022 | 13.75 | observed |
| 2023 | 5.86 | observed |
| 2024 | 8.44 | observed |
| 2025 | 8.68 | estimate |
| 2026 | 5.62 | projection |
| 2027 | 4.28 | projection |
| 2028 | 4 | projection |
| 2029 | 4 | projection |
| 2030 | 4 | projection |
| 2031 | 4 | projection |
Current account balance, % of GDP (2015–2027)

View exact chart values
| year | russia | china | india |
|---|---|---|---|
| 2015 | 5 | 2.59 | -1.06 |
| 2016 | 1.91 | 1.67 | -0.63 |
| 2017 | 2.04 | 1.51 | -1.86 |
| 2018 | 7 | 0.17 | -2.16 |
| 2019 | 3.87 | 0.71 | -0.88 |
| 2020 | 2.38 | 1.65 | 0.92 |
| 2021 | 6.83 | 1.94 | -1.25 |
| 2022 | 10.35 | 2.42 | -2.06 |
| 2023 | 2.43 | 1.43 | -0.74 |
| 2024 | 2.86 | 2.24 | -0.61 |
| 2025 | 1.6 | 3.71 | -0.92 |
| 2026 | 2.95 | 3.48 | -2.03 |
| 2027 | 2.29 | 3.27 | -1.65 |
The leverage math
Now the odd part of the design: the bill's sharpest tool is aimed not at Russia but at its customers. In 2025 the IMF estimates China's economy at $19.6 trillion and India's at $3.9 trillion, against Russia's $2.6 trillion. China alone is 7.6 times Russia; the two buyers together are about nine times. The United States, for scale, is nearly twelve times.
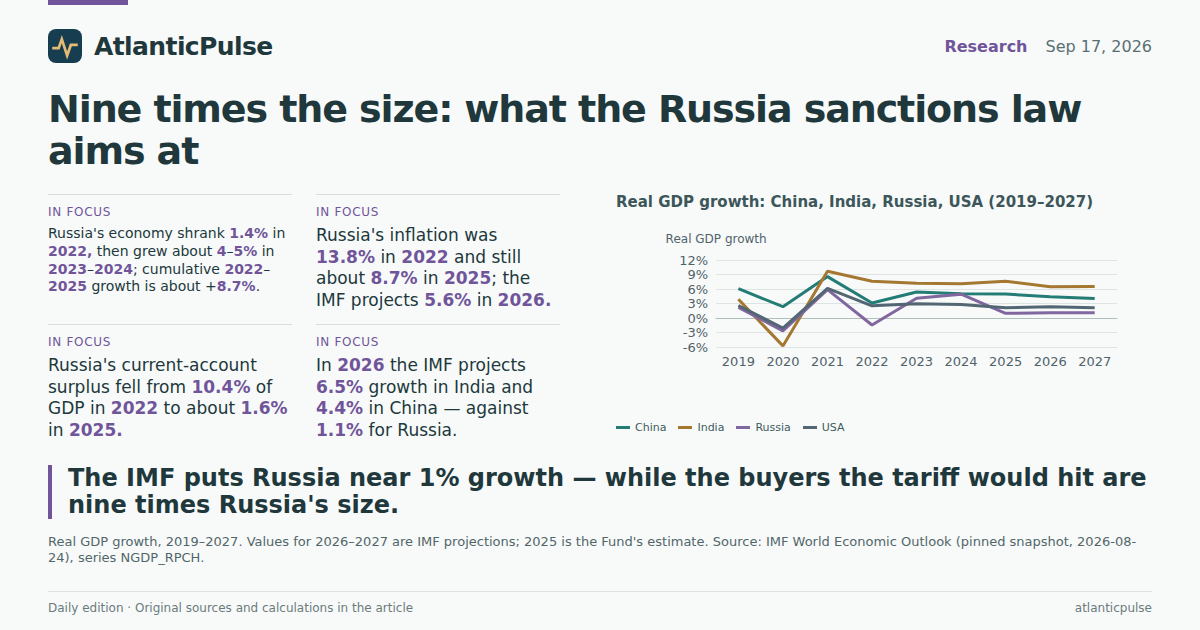
Growth tells the same story from a different angle. The Fund projects 2026 growth of 6.5% in India and 4.4% in China, versus 2.3% in the United States - and 1.1% in Russia. India also runs a current-account deficit of about 2% of GDP, meaning less external cushion if trade gets rougher, while China runs a surplus near 3.5%. To be clear about what these numbers are: descriptive scale comparisons, not predictions. The tariff authority is discretionary, and whether the president pulls that trigger is politics, not arithmetic. But the asymmetry is hard to miss - a law that would put the fastest-growing major economies on notice to discipline one of the slowest.
Size of economies, 2025 (US$ trillions)

View exact chart values
| country | gdp_2025_usd_tn |
|---|---|
| United States | 30.767 |
| China | 19.626 |
| India | 3.916 |
| Russia | 2.588 |
Real GDP growth: China, India, Russia, USA (2019–2027)

View exact chart values
| year | china | india | russia | usa |
|---|---|---|---|---|
| 2019 | 6.06 | 3.87 | 2.2 | 2.58 |
| 2020 | 2.34 | -5.78 | -2.65 | -2.08 |
| 2021 | 8.56 | 9.69 | 5.87 | 6.15 |
| 2022 | 3.11 | 7.61 | -1.44 | 2.52 |
| 2023 | 5.38 | 7.21 | 4.07 | 2.93 |
| 2024 | 5 | 7.1 | 4.92 | 2.79 |
| 2025 | 4.96 | 7.62 | 0.98 | 2.12 |
| 2026 | 4.41 | 6.48 | 1.09 | 2.32 |
| 2027 | 4.03 | 6.53 | 1.09 | 2.1 |
What it means for the rest of us
There is a small domestic footnote, too. The same IMF vintage projected US consumer inflation averaging about 3.2% in 2026 - close to the inflation the Federal Reserve said Wednesday it had to fight with its first rate hike in three years. Global energy chaos, in other words, is already priced into the year's central bank drama.
The payoff, then: the new sanctions law is less a stranglehold than a bargaining chip. Russia enters the law's first day growing at about 1%, with 8-9% inflation behind it, an overheated labor market and an energy surplus a fraction of its 2022 peak. The buyers the tariff threat dangles over are nine times larger and growing several times faster. Whether that leverage forces Russia's economy to bend further - or merely gives Washington a very large thing to threaten with - will be decided one discretionary signature at a time.
Sources and methods
Data: IMF World Economic Outlook extract from the pinned local snapshot created 2026-08-24 (the spring 2026 WEO edition). Series: NGDP_RPCH (real GDP growth), PCPIPCH (average consumer-price inflation), NGDPD (GDP, current US$) and BCA_NGDPD (current account, % of GDP), for Russia, China, India and the United States, annual observations 2000-2031.
The extract does not carry explicit observed/estimated/projected status flags. Values through 2024 are treated as recorded, 2025 as the Fund's estimate and 2026 onward as projections, following the spring-edition convention; the figures shade the projection region accordingly.
All derived numbers come from the saved calculation weo-sanctions-macro run over the complete saved extracts; missing values are skipped, never treated as zero.
GDP sizes are nominal US-dollar values at market exchange rates; the size and growth comparisons are descriptive, not predictions of what tariffs would do.
The spring 2026 vintage predates the current Strait of Hormuz escalation, so its 2026-2027 projections do not include the war's latest oil-price effects.
The sanctions bill's tariff authority (up to 100% on the top five importers of Russian oil or gas, with a carve-out for small importers) is discretionary; this article makes no causal claims about its effects.
Research completed 2026-09-18, for the September 17, 2026 news edition. The available source data may cover earlier periods; see the observation periods and source vintages above.
- IMF World Economic Outlook (WEO Entire Dataset; pinned snapshot created 2026-08-24, spring 2026 edition): Source 1