Research
Nevada’s hospitality machine is still the outlier on the Colorado River
Two emergencies, one unusual payroll
On August 24, Nevada was fighting a fire at one end of the state and a river at the other. The Hawk Fire had pushed tens of thousands of people out of northwest Reno. Three days after the Interior Department published a two-year Colorado River plan, Nevada sued, arguing that cuts of more than 210,000 acre-feet — about 71 percent of its 300,000 acre-foot entitlement — could hammer a Las Vegas Valley that draws 90 percent of its water from the river. The complaint put a $180 billion regional economy on the table and said the federal environmental statement never priced what happens if most of that water disappears.
That is not a farm story. Prior basin reporting has already covered how Lower Basin agriculture compares with Upper Basin farms. The question hanging over Reno’s casinos and the Strip is simpler and, for Nevada, more existential: how much of the state’s actual paycheck still comes from putting people in hotel rooms, restaurants and showrooms — and has that dependence eased as the population boomed?
The official answer, from the Bureau of Labor Statistics’ state and area payrolls through July 2026 and the Bureau of Economic Analysis’ state GDP accounts through 2025, is that Nevada remains a hospitality outlier. It is less of one than it was in 2000. It is still in a different league from Arizona, California, Colorado, Utah, New Mexico or Wyoming.
One in five Nevada jobs is still leisure and hospitality
In July 2026, Nevada had 357,700 seasonally adjusted leisure-and-hospitality jobs out of 1,612,500 total nonfarm jobs — 22.2 percent of the payroll. That is down from 29.7 percent in July 2000, when 305,000 hospitality jobs sat on a much smaller 1,028,100-job base. The state added residents and other kinds of work faster than it added dealers, housekeepers and line cooks. The hospitality count itself is only about 17 percent above its July 2000 level.
The pandemic showed how fast that supersector can vanish. Seasonally adjusted leisure jobs fell to 151,600 in May 2020, 13.7 percent of a shrunken payroll, and were still only 237,100 in July 2020. They have since climbed back through 355,900 in July 2019’s pre-pandemic mark to a recent peak of 361,900 in July 2025, then slipped to 357,700 in July 2026. The share of jobs has stabilized in a band around 22 to 23 percent — well below the old one-in-three world, and nowhere near a normal American mix.
Nevada’s hospitality payroll is still huge — and a smaller slice than it used to be

View exact chart values
| year | leisure_thousands | nonfarm_thousands | share_pct |
|---|---|---|---|
| 2000 | 305 | 1028.1 | 29.67 |
| 2001 | 307 | 1056.1 | 29.07 |
| 2002 | 297.7 | 1052.9 | 28.27 |
| 2003 | 303.1 | 1086.6 | 27.89 |
| 2004 | 313.3 | 1156.6 | 27.09 |
| 2005 | 329.8 | 1228.1 | 26.85 |
| 2006 | 337.5 | 1282.2 | 26.32 |
| 2007 | 337.8 | 1289.9 | 26.19 |
| 2008 | 331.7 | 1268.2 | 26.16 |
| 2009 | 305.9 | 1137.2 | 26.9 |
| 2010 | 308.6 | 1120.3 | 27.55 |
| 2011 | 315.7 | 1127 | 28.01 |
| 2012 | 317 | 1143.9 | 27.71 |
| 2013 | 325.6 | 1176.5 | 27.68 |
| 2014 | 335.6 | 1214.9 | 27.62 |
| 2015 | 340.4 | 1258 | 27.06 |
| 2016 | 346.2 | 1304.9 | 26.53 |
| 2017 | 347.2 | 1339.5 | 25.92 |
| 2018 | 352.7 | 1385.5 | 25.46 |
| 2019 | 355.9 | 1421.4 | 25.04 |
| 2020 | 237.1 | 1237.1 | 19.17 |
| 2021 | 308.3 | 1390.6 | 22.17 |
| 2022 | 337.5 | 1496.4 | 22.55 |
| 2023 | 346.6 | 1536.7 | 22.55 |
| 2024 | 358.7 | 1560.4 | 22.99 |
| 2025 | 361.9 | 1595 | 22.69 |
| 2026 | 357.7 | 1612.5 | 22.18 |
The rest of the basin does not look like this
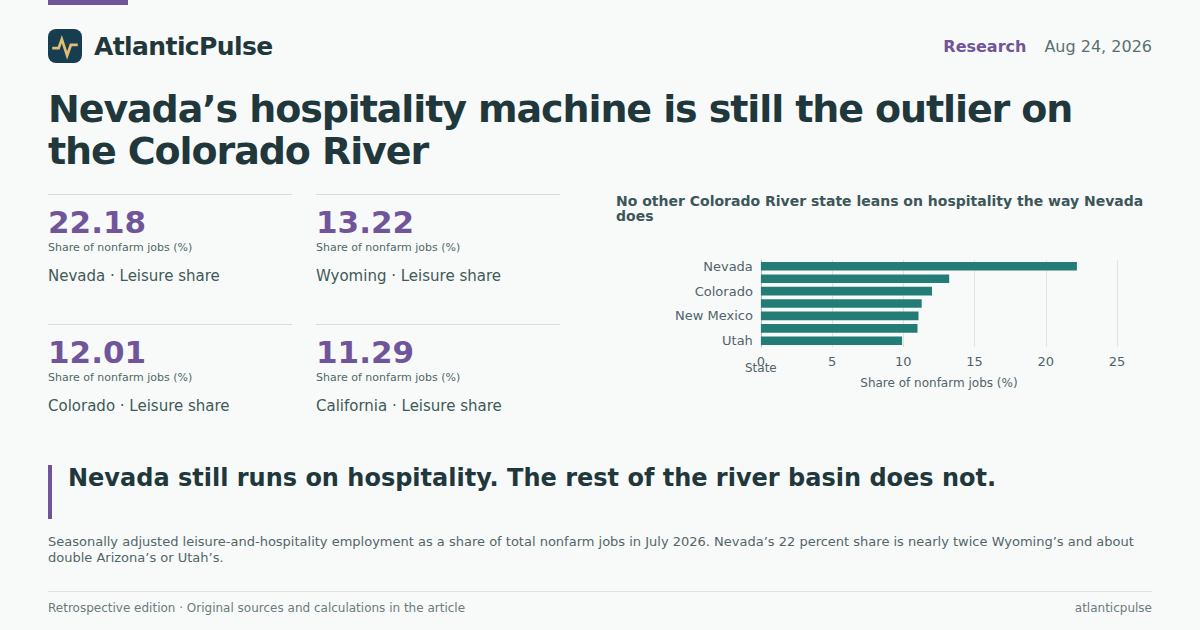
Compare that July 2026 share with the other Colorado River states, using the same seasonally adjusted series. Wyoming, the next most hospitality-heavy, was at 13.2 percent. Colorado was at 12.0 percent, California 11.3 percent, New Mexico 11.1 percent, Arizona 11.0 percent and Utah 9.9 percent. Nevada’s share is roughly double Arizona’s. It is also larger in absolute terms than Colorado’s entire leisure payroll (357,100) despite having far fewer people.
That gap is the point of Nevada’s water brief, even if the lawsuit is written in acre-feet. A cut that lands on Las Vegas is not landing on a diversified desert economy that happens to have some hotels. It is landing on the one Lower Basin state where hospitality is still the organizing principle of the labor market. Arizona and California have bigger tourism industries in raw dollars. They do not live on them.
No other Colorado River state leans on hospitality the way Nevada does

View exact chart values
| state | leisure_thousands | nonfarm_thousands | share_pct | period |
|---|---|---|---|---|
| Nevada | 357.7 | 1612.5 | 22.18 | 2026-07 |
| Wyoming | 39 | 295.1 | 13.22 | 2026-07 |
| Colorado | 357.1 | 2973.7 | 12.01 | 2026-07 |
| California | 2047.4 | 18133 | 11.29 | 2026-07 |
| New Mexico | 99 | 895.5 | 11.06 | 2026-07 |
| Arizona | 361 | 3285.8 | 10.99 | 2026-07 |
| Utah | 177.1 | 1787.4 | 9.91 | 2026-07 |
GDP tells the same story, louder
Jobs understate the concentration. In 2025, arts, entertainment, recreation, accommodation and food services produced $44.3 billion of Nevada’s $281.5 billion in current-dollar GDP — 15.7 percent of output. The same industry group was 4.3 percent of U.S. GDP. Colorado, the next basin state on the list, was at 5.4 percent. Arizona, which takes a larger river delivery than Nevada, was at 4.5 percent. Utah was at 3.7 percent.
These are not the same categories as the BLS leisure supersector, and current-dollar GDP inflates with prices. The comparison is still blunt. Nevada’s tourism-related share of output has fallen from 22.4 percent in 2000, with a 2020 plunge to 11.4 percent, but it has not converged on the national 4 percent. As of 2025 it was still nearly four times the U.S. share. If Interior’s plan is a fight about who can absorb a shortage, the GDP accounts say Nevada is absorbing it in hotels, not alfalfa.
Tourism is still one-sixth of Nevada’s economy — nearly four times the U.S. share

View exact chart values
| state | gdp_millions | arts_accom_millions | share_pct |
|---|---|---|---|
| Nevada | 281453.8 | 44296.1 | 15.74 |
| Colorado | 584323.9 | 31345.2 | 5.36 |
| Wyoming | 52622.3 | 2656.3 | 5.05 |
| New Mexico | 152778.6 | 6975.1 | 4.57 |
| California | 4250840.8 | 192325.7 | 4.52 |
| Arizona | 598188.8 | 26865.1 | 4.49 |
| United States | 30762099 | 1332333 | 4.33 |
| Utah | 315973.2 | 11582.3 | 3.67 |
Las Vegas carries the hospitality machine. Reno does not.
The two metros in this week’s headlines are not interchangeable. In July 2026, Las Vegas-Henderson-North Las Vegas had 302,200 leisure-and-hospitality jobs, not seasonally adjusted, on a seasonally adjusted nonfarm base of 1,176,800. Reno had 41,500 leisure jobs on 286,400 nonfarm jobs. Mixing those seasonal adjustments makes the metro shares only approximate — about 26 percent in Las Vegas and 14 percent in Reno — but the levels are not ambiguous. Most of Nevada’s hospitality payroll sits in the valley that drinks the Colorado River.
Las Vegas’s July leisure count has more than recovered from 2020’s 192,800 and is a shade above July 2019’s 296,500. Reno’s July 2026 figure, 41,500, is essentially the same as July 2019’s 41,600 and below the 45,500 it posted in July 2000. The Hawk Fire is a local disaster for a metro that has spent two decades becoming less of a casino town. The river cut is aimed at the metro that never stopped being one.
Statewide, that split is visible in the growth math. From 2000 to 2025 Nevada’s population rose from 2.02 million to 3.28 million, a 63 percent increase. Current-dollar GDP rose from $77 billion to $281 billion. July leisure jobs, indexed to 2000, were only 19 percent higher by 2025. People and nominal output ran ahead of the hospitality payroll, which is why the job share fell. It did not fall far enough to make Nevada look like Arizona.
Las Vegas still carries most of the hospitality payroll. Reno’s is smaller — and flatter.

View exact chart values
| year | las_vegas_leisure_nsa | reno_leisure_nsa | las_vegas_nonfarm_sa | reno_nonfarm_sa |
|---|---|---|---|---|
| 2000 | 235.6 | 45.5 | 700 | 205.1 |
| 2001 | 239.8 | 44.4 | 732.2 | 209.6 |
| 2002 | 233.7 | 42.1 | 732.8 | 206.3 |
| 2003 | 240.1 | 41.9 | 759.5 | 210.4 |
| 2004 | 249.9 | 41.8 | 816.5 | 219.8 |
| 2005 | 267.2 | 41.5 | 875.4 | 229.2 |
| 2006 | 274.9 | 42.3 | 921 | 235.8 |
| 2007 | 274.4 | 42.9 | 926.7 | 236.4 |
| 2008 | 271.1 | 40.7 | 915.8 | 228.5 |
| 2009 | 251.7 | 36.7 | 816.9 | 205.3 |
| 2010 | 255 | 37 | 806.4 | 201.7 |
| 2011 | 262.4 | 36.6 | 810.3 | 199.3 |
| 2012 | 264.5 | 36.2 | 825.1 | 201.2 |
| 2013 | 271.7 | 37.1 | 851.8 | 207.2 |
| 2014 | 280.8 | 38 | 881.4 | 215 |
| 2015 | 283.7 | 38.5 | 917.3 | 220.5 |
| 2016 | 289.3 | 39.7 | 954.2 | 231.1 |
| 2017 | 291.5 | 40.4 | 978.4 | 243.6 |
| 2018 | 294.3 | 40.8 | 1008.1 | 255.5 |
| 2019 | 296.5 | 41.6 | 1037.3 | 260.2 |
| 2020 | 192.8 | 30.9 | 883.1 | 243.7 |
| 2021 | 257.4 | 36.4 | 1009.4 | 261.7 |
| 2022 | 283 | 39.2 | 1090.5 | 273.8 |
| 2023 | 290.7 | 40.7 | 1121.1 | 279.1 |
| 2024 | 301.8 | 40.8 | 1141.4 | 278.9 |
| 2025 | 304 | 41.7 | 1166.9 | 286.1 |
| 2026 | 302.2 | 41.5 | 1176.8 | 286.4 |
People and output grew faster than the casino payroll

View exact chart values
| year | population | pop_index | gdp_millions | gdp_index | personal_income_millions | leisure_july_index | per_capita_pi |
|---|---|---|---|---|---|---|---|
| 2000 | 2018741 | 100 | 77181.5 | 100 | 64312.6 | 100 | 31858 |
| 2001 | 2098399 | 103.9 | 80968.6 | 104.9 | 68026.7 | 100.7 | 32418 |
| 2002 | 2173791 | 107.7 | 85541 | 110.8 | 69952.7 | 97.6 | 32180 |
| 2003 | 2248850 | 111.4 | 91365 | 118.4 | 74518.4 | 99.4 | 33136 |
| 2004 | 2346222 | 116.2 | 104132 | 134.9 | 82524.7 | 102.7 | 35173 |
| 2005 | 2432143 | 120.5 | 117165.1 | 151.8 | 92194.1 | 108.1 | 37907 |
| 2006 | 2522658 | 125 | 126613.4 | 164 | 99485.1 | 110.7 | 39437 |
| 2007 | 2601072 | 128.8 | 132045.4 | 171.1 | 103706 | 110.8 | 39870 |
| 2008 | 2653630 | 131.4 | 130570.9 | 169.2 | 102535.9 | 108.8 | 38640 |
| 2009 | 2684665 | 133 | 122471.2 | 158.7 | 96982.8 | 100.3 | 36125 |
| 2010 | 2701888 | 133.8 | 125149 | 162.1 | 100750.4 | 101.2 | 37289 |
| 2011 | 2710129 | 134.2 | 128638.4 | 166.7 | 104596.4 | 103.5 | 38595 |
| 2012 | 2739290 | 135.7 | 130238.2 | 168.7 | 108696.1 | 103.9 | 39680 |
| 2013 | 2769188 | 137.2 | 133592.5 | 173.1 | 108914.4 | 106.8 | 39331 |
| 2014 | 2808779 | 139.1 | 136918.4 | 177.4 | 115514.1 | 110 | 41126 |
| 2015 | 2855986 | 141.5 | 145786.8 | 188.9 | 125088.6 | 111.6 | 43799 |
| 2016 | 2904614 | 143.9 | 153318 | 198.6 | 129879.1 | 113.5 | 44715 |
| 2017 | 2954768 | 146.4 | 163199.1 | 211.4 | 138847 | 113.8 | 46991 |
| 2018 | 3011007 | 149.2 | 172547.9 | 223.6 | 148408.1 | 115.6 | 49289 |
| 2019 | 3068665 | 152 | 184611.1 | 239.2 | 159393 | 116.7 | 51942 |
| 2020 | 3116851 | 154.4 | 176178.7 | 228.3 | 170447.5 | 77.7 | 54686 |
| 2021 | 3148472 | 156 | 202091.8 | 261.8 | 192132.9 | 101.1 | 61024 |
| 2022 | 3177672 | 157.4 | 232437.9 | 301.2 | 199226.6 | 110.7 | 62696 |
| 2023 | 3211077 | 159.1 | 253443.3 | 328.4 | 214392.7 | 113.6 | 66767 |
| 2024 | 3253543 | 161.2 | 269010.5 | 348.5 | 228086.6 | 117.6 | 70104 |
| 2025 | 3282188 | 162.6 | 281453.8 | 364.7 | 240111.7 | 118.7 | 73156 |
What the numbers do not say
None of this measures how many acre-feet a hotel room uses, or what a 71 percent cut would do to visitor counts. Payrolls and GDP are not a hydrological model. Leisure and hospitality also include neighborhood restaurants in Elko and banquet halls that never see a Colorado River tap. The arts-and-accommodation GDP bundle is broader than casinos and narrower than “tourism.” And these figures are retrospective, drawn from snapshots available after the edition date: state jobs through July 2026, GDP through 2025. Later revisions will move some of the decimals.
What they do say is harder to dodge. Nevada went to court as the only basin state that still runs more than a fifth of its payroll, and about a sixth of its economy, through the business of putting strangers in beds and feeding them. Reno’s fire is falling on a more ordinary Western metro. Las Vegas is not. If the river plan is going to be argued as an urban-survival case, that is the official record the state is standing on.
Sources and methods
This is retrospective enrichment using pinned catalogue snapshots available to the research tools, not a reconstruction of what was knowable on the August 24, 2026 edition date. Later releases and revisions may be present in the snapshots.
Research compiled on September 11, 2026. Historical edition date: August 24, 2026.
Jobs are from the U.S. Bureau of Labor Statistics State and Area Employment program, snapshot created 2026-08-24 (release id bls-sm-snapshot-2026-08-24). Statewide series used here are seasonally adjusted monthly payrolls in thousands. Observation window for statewide and metro jobs: January 2000–July 2026. July values are used for year-to-year comparisons to limit seasonal noise in the not-seasonally-adjusted metro leisure series.
Las Vegas and Reno leisure-and-hospitality series are not seasonally adjusted. Las Vegas and Reno total nonfarm series used for approximate metro shares are seasonally adjusted. Those metro shares are therefore approximate and are not compared directly with statewide seasonally adjusted shares.
GDP, population and personal income are from BEA annual state accounts, snapshot created 2026-08-31, source release bea-regional-state-annual-2026-04-09. GDP is millions of current dollars (not inflation-adjusted). The tourism-related GDP group is NAICS 71 and 72 (arts, entertainment, recreation, accommodation and food services). That is related to, but not identical with, the BLS leisure-and-hospitality supersector. Observation window: 2000–2025 for Nevada and U.S. totals; 2019–2025 for other basin-state GDP comparisons.
Null observations were dropped and not treated as zero. Where duplicate period keys appeared, the last observation for the period was kept. New Mexico nonfarm series carry a footnote:C on some 2024 months; July 2026 values were used for the cross-state job-share table.
No causal effect of river operations, wildfire, or tourism policy is inferred from these descriptive comparisons. The figures do not measure water use per job or per visitor.
Research completed 2026-09-11, for the August 24, 2026 news edition. This is retrospective analysis, not a reconstruction of information available that day.