Research
Minnesota's $225 million cut lands on a payroll that was already smaller than it looks
A big number next to a bigger payroll
The University of Minnesota told its campuses this week that it will cut $225 million over two years, 12 to 15 percent of allocated operating revenue, and called the moment an "institutional inflection point." Officials blamed enrollment, unpredictable state and federal funding, and costs that outrun revenue. They have not yet said how the reductions will be split across campuses. That is a real budget. It is not, on the official books, a vanishing industry.
Minnesota state government paid $9.73 billion in employee compensation in 2024, the latest Bureau of Economic Analysis year. Two hundred twenty-five million dollars is about 2.3 percent of that compensation bill — and the comparison is generous, because state-government compensation includes prisons, highway crews and the rest of St. Paul, not just faculty. Against what Minnesota households spent on higher education in 2024, $4.31 billion, the same cut is about 5 percent. The university is large. The cut is not a rounding error. It is also not the whole sector.
The public-campus jobs were not collapsing
The closest official payroll for public colleges and universities is state-government educational services from the Bureau of Labor Statistics. It is not the University of Minnesota alone. It folds in the Minnesota State colleges and universities. It is not seasonally adjusted, so August looks like a ghost town and October looks like a campus. Used carefully — October to October, or a 12-month average — it is still the right tape measure.
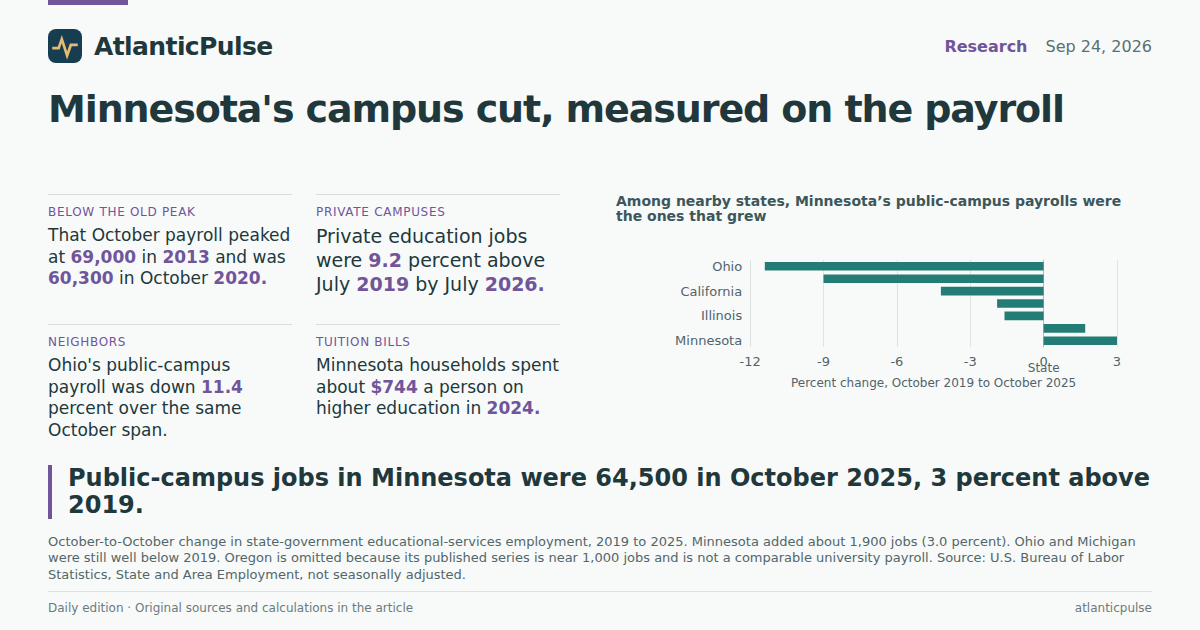
In October 2025 that payroll employed 64,500 people, up 1,900, or 3.0 percent, from 62,600 in October 2019. The 12-month average ending October 2025 was 60,850, 2.8 percent above the same window in 2019. The latest month in the snapshot, July 2026, was 51,900, essentially unchanged from 52,000 in July 2019. Summer comparisons are noisy. They do not show a collapse.
They also do not show a boom. October employment peaked at 69,000 in 2013, sagged through the late 2010s, dipped to 60,300 in October 2020, and has been climbing back. October 2025 was still 4,500 jobs short of that 2013 high and only 1,600 above October 2007. If this is an inflection point, the books say the last one happened a decade ago.
Minnesota public-campus payrolls never fully recaptured their 2013 peak

View exact chart values
| year | october_nsa_thousands | trailing12_thousands |
|---|---|---|
| 2008 | 64.1 | 60.39 |
| 2009 | 64.5 | 60.81 |
| 2010 | 65.5 | 61.49 |
| 2011 | 66.7 | 62.79 |
| 2012 | 67.6 | 62.31 |
| 2013 | 69 | 62.8 |
| 2014 | 67.7 | 63.8 |
| 2015 | 65.9 | 61.47 |
| 2016 | 62.6 | 59.52 |
| 2017 | 65.2 | 58.88 |
| 2018 | 62.8 | 59.73 |
| 2019 | 62.6 | 59.22 |
| 2020 | 60.3 | 58.64 |
| 2021 | 60.8 | 57.46 |
| 2022 | 61 | 57.69 |
| 2023 | 62.7 | 58.77 |
| 2024 | 63.9 | 59.93 |
| 2025 | 64.5 | 60.85 |
The other education jobs did more of the work
Private educational services — private colleges, trade schools and the rest of NAICS 61 outside government — are a different labor market, and they have been hiring. Seasonally adjusted, those jobs stood at 77,500 in July 2026, 9.2 percent above 71,000 in July 2019, after a pandemic low of 61,800 in April 2020. Indexed to July 2019, the private payroll was at 109; a 12-month average of the public-campus series was at 103.
Local-government educational services, mostly K-12, dwarf both. In October 2025 that payroll employed 150,000, up 0.9 percent from 148,600 in October 2019. Put the three official buckets side by side that month and the university system is the smallest: 64,500 public-campus jobs, 74,500 private education jobs, 150,000 local education jobs. A cut at the flagship lands on the thin end of the state's education employment.
The rest of the Minnesota job market was not in reverse either. Seasonally adjusted total nonfarm employment was 3.06 million in July 2026, 2.6 percent above July 2019. All of state government, of which educational services were about half in that summer month, was 107,000, up 5.6 percent. The university can be in a fiscal bind while the state's broader payroll still looks ordinary. Those facts can both be true.
Private education jobs in Minnesota ran ahead of public campuses

View exact chart values
| year | private_ed_index_jul2019 | stategov_ed_t12_index_jul2019 | private_ed_thousands | stategov_ed_t12_thousands |
|---|---|---|---|---|
| 2015 | 92.5 | 104.4 | 65.7 | 61.8 |
| 2016 | 94.8 | 101.5 | 67.3 | 60.09 |
| 2017 | 96.8 | 98.7 | 68.7 | 58.44 |
| 2018 | 98.3 | 101.6 | 69.8 | 60.17 |
| 2019 | 100 | 100 | 71 | 59.19 |
| 2020 | 89.7 | 99.8 | 63.7 | 59.09 |
| 2021 | 95.5 | 97.2 | 67.8 | 57.52 |
| 2022 | 99.4 | 97.5 | 70.6 | 57.72 |
| 2023 | 101.3 | 98.6 | 71.9 | 58.36 |
| 2024 | 102.7 | 101 | 72.9 | 59.77 |
| 2025 | 103.8 | 102.6 | 73.7 | 60.72 |
| 2026 | 109.2 | 103.4 | 77.5 | 61.18 |
Public campuses are not Minnesota’s biggest education payroll

View exact chart values
| category | jobs_thousands |
|---|---|
| State government educational services | 64.5 |
| Local government educational services | 150 |
| Private educational services | 74.5 |
Nearby states look worse
Compare October 2019 with October 2025 across states that publish the same public-campus series and Minnesota is not the patient. Ohio's state-government educational-services payroll fell 11.4 percent, from 115,000 to 101,900. Michigan was down 9.0 percent, California 4.2 percent, Wisconsin 1.9 percent, Illinois 1.6 percent. Iowa eked out a 1.7 percent gain. Minnesota's 3.0 percent increase was the strongest in that group.
That is not a prediction that the new cuts will leave the payroll untouched. It is a reminder that several Big Ten neighbors already did the shrinking. Ohio shed about 13,100 October jobs over those six years; Minnesota added 1,900. If enrollment and federal funds are the shared weather, the official employment record says Minnesota's public campuses walked into this announcement less reduced than the neighbors', not more.
Among nearby states, Minnesota’s public-campus payrolls were the ones that grew

View exact chart values
| state | oct2019_thousands | oct2025_thousands | pct_oct2019_2025 | pct_oct2024_2025 | jobs_change_oct_thousands |
|---|---|---|---|---|---|
| Ohio | 115 | 101.9 | -11.4 | 0.4 | -13.1 |
| Michigan | 133.2 | 121.2 | -9 | 3.3 | -12 |
| California | 253.2 | 242.6 | -4.2 | -7.5 | -10.6 |
| Wisconsin | 58.5 | 57.4 | -1.9 | -1.9 | -1.1 |
| Illinois | 89.9 | 88.5 | -1.6 | 0.5 | -1.4 |
| Iowa | 41.8 | 42.5 | 1.7 | -1.2 | 0.7 |
| Minnesota | 62.6 | 64.5 | 3 | 0.9 | 1.9 |
Households still write a large tuition check
Jobs are one ledger. Households keep another. Minnesota residents spent $4.31 billion on higher education in 2024, according to BEA state consumer spending, or about $744 a person — above the U.S. $607. That bill was 1.27 percent of Minnesota personal consumption, versus 1.04 percent nationally. Illinois spent an even larger share, 1.57 percent; Wisconsin, 1.03 percent.
The Minnesota share used to be higher. It peaked near 1.9 percent of spending around 2010, then drifted down even as the dollar total rose 10 percent from 2019 to 2024, almost the same as the national 10 percent increase. Families are still paying. They are paying a smaller slice of a larger consumption pie. Private educational-services output in Minnesota was $4.72 billion in 2025, under 1 percent of state GDP — and that GDP line is private schools, not the public university, which BEA parks inside state and local government.
None of this says the $225 million cut is imaginary, or that it will be painless for students and staff. It says the official books already distinguish three stories that the announcement can blur: a flagship budget, a public-campus payroll that is a bit larger than in 2019 and still smaller than in 2013, and a household tuition bill that remains heavier in Minnesota than in the country as a whole. The inflection, if it comes, will show up in next year's October number. This year's already did not look like a crash.
Minnesota households still spend more of their budget on college than the U.S. average

View exact chart values
| year | mn_highered_millions | us_highered_millions | mn_share_of_pce_pct | us_share_of_pce_pct | mn_highered_per_capita | us_highered_per_capita |
|---|---|---|---|---|---|---|
| 1997 | 1544.5 | 61261.2 | 1.43 | 1.11 | 324 | 225 |
| 1998 | 1749.8 | 66027.1 | 1.54 | 1.12 | 364 | 239 |
| 1999 | 2022.1 | 70773.9 | 1.65 | 1.13 | 415 | 254 |
| 2000 | 2342.1 | 76776.4 | 1.76 | 1.13 | 475 | 272 |
| 2001 | 2466.7 | 82917.3 | 1.77 | 1.17 | 495 | 291 |
| 2002 | 2528.9 | 86985.5 | 1.75 | 1.18 | 504 | 302 |
| 2003 | 2727.2 | 94980.7 | 1.79 | 1.23 | 540 | 327 |
| 2004 | 2906.3 | 102481.5 | 1.8 | 1.24 | 571 | 350 |
| 2005 | 2972.8 | 110853.3 | 1.77 | 1.26 | 581 | 375 |
| 2006 | 3032.1 | 119676 | 1.73 | 1.29 | 587 | 401 |
| 2007 | 3162.7 | 128284.7 | 1.75 | 1.32 | 607 | 426 |
| 2008 | 3251.5 | 135278.4 | 1.73 | 1.35 | 620 | 445 |
| 2009 | 3411.2 | 144297.2 | 1.84 | 1.46 | 646 | 470 |
| 2010 | 3605.6 | 154979.2 | 1.88 | 1.51 | 679 | 501 |
| 2011 | 3645.6 | 161110.9 | 1.82 | 1.51 | 681 | 517 |
| 2012 | 3566.9 | 163217.7 | 1.73 | 1.48 | 662 | 519 |
| 2013 | 3584.7 | 166691.4 | 1.69 | 1.46 | 660 | 526 |
| 2014 | 3533.9 | 169281.6 | 1.61 | 1.43 | 646 | 530 |
| 2015 | 3578.7 | 173151.8 | 1.58 | 1.41 | 649 | 538 |
| 2016 | 3702.9 | 177278.8 | 1.59 | 1.39 | 666 | 547 |
| 2017 | 3772 | 180589 | 1.55 | 1.36 | 673 | 553 |
| 2018 | 3832 | 183459.2 | 1.5 | 1.32 | 678 | 558 |
| 2019 | 3906.9 | 187047 | 1.5 | 1.3 | 687 | 566 |
| 2020 | 3927.4 | 188016.9 | 1.57 | 1.32 | 688 | 567 |
| 2021 | 3985.7 | 190429.9 | 1.42 | 1.18 | 697 | 573 |
| 2022 | 4123.7 | 197190.1 | 1.35 | 1.11 | 721 | 590 |
| 2023 | 4236.8 | 202523.7 | 1.32 | 1.08 | 736 | 601 |
| 2024 | 4312.3 | 206341.3 | 1.27 | 1.04 | 744 | 607 |
Sources and methods
BLS State and Area Employment snapshot through July 2026 (release vintage bls-sm-snapshot-2026-08-24). State-government educational services is not seasonally adjusted and is not the University of Minnesota alone; it includes other public higher education. October-to-October comparisons and 12-month averages are used because summer months empty campuses. Private educational services is seasonally adjusted NAICS 61 outside government. Local-government educational services is mostly K-12.
Oregon's published state-government educational-services series is near 1,000 jobs and is omitted from the peer ranking as not a comparable university payroll. No causal effect is inferred from the newly announced cut; employment figures predate any layoffs from this week's plan.
BEA annual GDP and compensation through 2025 and 2024 respectively (bea-regional-state-annual-2026-04-09). BEA educational-services GDP and compensation are private NAICS 61, not public universities, which sit in state and local government. BEA PCE by state through 2024 (bea-sapce-2025-09-26). Higher-education spending is household consumption, not university budgets. Per-person figures divide higher-education PCE by implied population (total PCE divided by per-capita PCE). Null observations are omitted, not treated as zero. Provider lag is normal; these are not current-day observations.
Research completed 2026-09-25, for the September 24, 2026 news edition. The available source data may cover earlier periods; see the observation periods and source vintages above.