Research
Microsoft’s home state stopped hiring. California’s hospitals did the hiring instead.
A freeze aimed at named employers
Vice President JD Vance went after Microsoft by name this week, saying no company had “abused the system” more, and the Labor Department suspended new and pending permanent labor certifications — the PERM filings most employment-based green cards require — for Microsoft, Adobe, Cognizant, Infosys, Tata Consultancy Services, Wipro, HCL Technologies and Capgemini. Vance cited 6,000 American layoffs against 6,300 H-1B visas and nearly 3,000 green cards; Microsoft said most of those petitions were for people already on the payroll, and that it had announced 4,800 job cuts in July, about 2.1 percent of its global workforce. The political charge is replacement. The official books cannot see Microsoft’s badge swipe. They can see whether the states those firms actually hire in have already stopped adding the kinds of jobs a green-card freeze is supposed to protect.
Professional and business services is a blunt instrument: it bundles computer-systems shops with temp agencies, janitors and call centers. A tighter cut is professional, scientific and technical services — lawyers, consultants, architects and the computer-systems designers the visa fight is actually about. Information is tighter still on the software-publisher side, though in California it also includes Hollywood. None of this is a headcount of H-1B workers. It is the payroll those workers, and the Americans sitting next to them, show up in.
Washington’s boom already ended
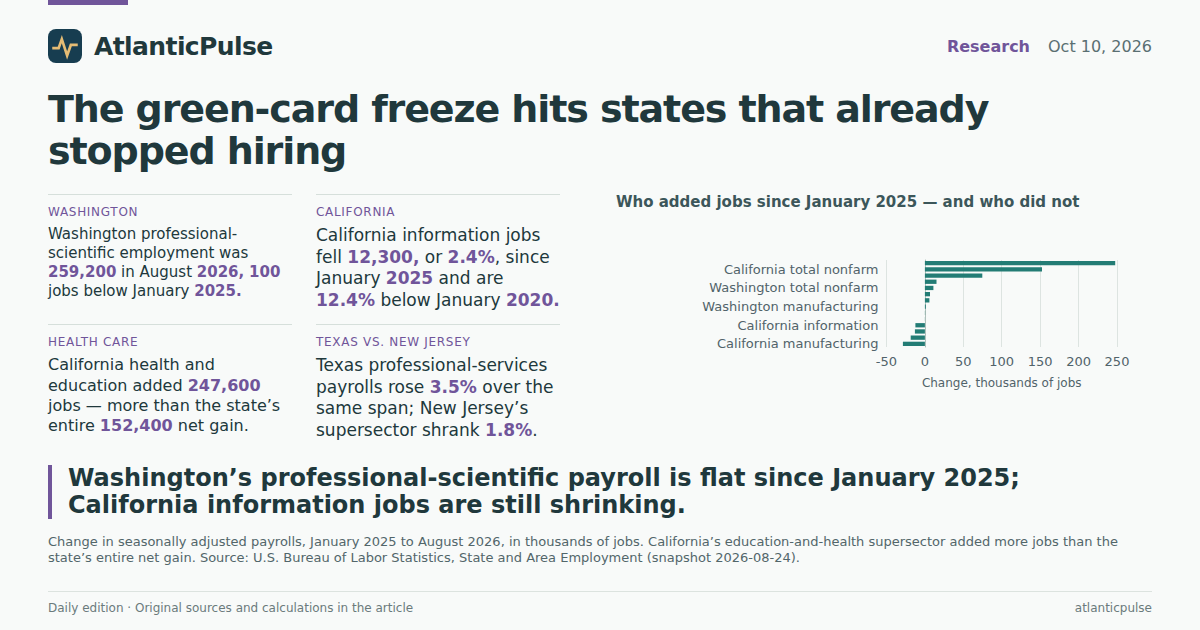
In Microsoft’s home state, the professional, scientific and technical payroll was 259,200 in August 2026, seasonally adjusted — 100 jobs below January 2025, a rounding error on a 259,000-person industry. Information employment was 164,100, up 300 jobs, or 0.2 percent, over the same stretch. The broader professional-and-business-services supersector did a little better, adding 6,700 jobs (1.2 percent). Washington’s entire nonfarm payroll added only 11,100 jobs in those 19 months. The people still getting hired are in clinics and classrooms: private education and health services added 15,100 jobs, 2.7 percent.
That is not a collapse. It is a stall after a boom. From January 2020 to August 2026 those professional-scientific payrolls are still up 18.3 percent. The gains arrived in 2021 and 2022. Then the line went sideways. Information peaked earlier and has been jogging in place. Manufacturing is 5.6 percent below January 2020, with a one-month plunge in the official October 2024 reading that reversed the next month. If the White House wants a picture of Americans being swapped out in real time, Washington’s books do not supply it. They supply a state that already did its tech hiring, then stopped.
Washington’s tech-adjacent payrolls flattened after the boom

View exact chart values
| month | pst | information | manufacturing | ed_health | total_nonfarm |
|---|---|---|---|---|---|
| 2020-01 | 100 | 100 | 100 | 100 | 100 |
| 2020-02 | 100.4 | 100.2 | 100.1 | 100.1 | 100.2 |
| 2020-03 | 100.5 | 100.7 | 99 | 99.5 | 99.5 |
| 2020-04 | 97.3 | 99 | 92.3 | 90.7 | 88.3 |
| 2020-05 | 97.4 | 99 | 91.4 | 91.1 | 88 |
| 2020-06 | 97.9 | 98.7 | 92.8 | 94.1 | 90.3 |
| 2020-07 | 98.3 | 98.4 | 91.1 | 95.2 | 91.5 |
| 2020-08 | 98.6 | 99.2 | 90.5 | 95.5 | 92.5 |
| 2020-09 | 99.3 | 100.3 | 90 | 96.5 | 93 |
| 2020-10 | 99.9 | 100.9 | 89.6 | 96.6 | 93.2 |
| 2020-11 | 100.4 | 101.3 | 89.2 | 97 | 93.5 |
| 2020-12 | 101 | 101.6 | 88.9 | 97.1 | 92.9 |
| 2021-01 | 101.5 | 101.9 | 88.7 | 97.2 | 93 |
| 2021-02 | 101.9 | 102.6 | 88.2 | 97.4 | 93.7 |
| 2021-03 | 102.7 | 103 | 88.5 | 98 | 94.3 |
| 2021-04 | 103.6 | 103.4 | 88.4 | 98.1 | 94.9 |
| 2021-05 | 104.8 | 104 | 88.6 | 98.4 | 95.3 |
| 2021-06 | 105 | 104.6 | 88.4 | 98.9 | 95.6 |
| 2021-07 | 105.6 | 104.7 | 88.6 | 98.8 | 96.4 |
| 2021-08 | 106.3 | 105.6 | 88.6 | 99.2 | 96.9 |
| 2021-09 | 107.2 | 107.4 | 88.9 | 99.1 | 97.3 |
| 2021-10 | 109 | 109 | 89.6 | 99.7 | 98.3 |
| 2021-11 | 109.7 | 109.5 | 90 | 99.6 | 98.5 |
| 2021-12 | 110.5 | 110.1 | 90.2 | 99.7 | 98.7 |
| 2022-01 | 112.4 | 110.7 | 90.2 | 99.6 | 98.7 |
| 2022-02 | 113.4 | 111.3 | 91 | 99.8 | 99.6 |
| 2022-03 | 114.4 | 112.1 | 91.1 | 100.3 | 99.8 |
| 2022-04 | 114.8 | 113 | 91.3 | 100.6 | 99.9 |
| 2022-05 | 115.3 | 114.2 | 91.4 | 100.7 | 100.1 |
| 2022-06 | 115.7 | 115.6 | 91.1 | 101 | 100 |
| 2022-07 | 117.2 | 116.9 | 92.2 | 101.4 | 101 |
| 2022-08 | 117.5 | 117.7 | 92.6 | 102 | 101.4 |
| 2022-09 | 117.7 | 117.3 | 92.7 | 101.8 | 101.3 |
| 2022-10 | 117.9 | 117.3 | 92.9 | 102 | 101.5 |
| 2022-11 | 118.1 | 117.1 | 93.1 | 102.2 | 101.5 |
| 2022-12 | 118.2 | 117.2 | 93 | 102.2 | 101.5 |
| 2023-01 | 118.2 | 117.2 | 93.2 | 102.9 | 102.1 |
| 2023-02 | 118.2 | 116.9 | 93.2 | 103.3 | 102.3 |
| 2023-03 | 118.2 | 116.2 | 93.3 | 103.2 | 102.2 |
| 2023-04 | 118.1 | 115.2 | 93.4 | 103.5 | 102.3 |
| 2023-05 | 118.2 | 113.8 | 93.7 | 103.9 | 102.4 |
| 2023-06 | 118.3 | 113 | 94 | 104 | 102.7 |
| 2023-07 | 118.1 | 112.3 | 93.7 | 104.1 | 102.3 |
| 2023-08 | 118.1 | 111.5 | 94 | 104.6 | 102.4 |
| 2023-09 | 117.8 | 110.9 | 94.2 | 105.3 | 102.5 |
| 2023-10 | 117.9 | 110.3 | 94.1 | 105.3 | 102.4 |
| 2023-11 | 117.8 | 109.9 | 94.4 | 105.7 | 102.6 |
| 2023-12 | 117.8 | 109.9 | 94.4 | 105.8 | 102.7 |
| 2024-01 | 118 | 109.8 | 94.6 | 105.9 | 102.6 |
| 2024-02 | 118.1 | 109.7 | 94.7 | 106.6 | 102.9 |
| 2024-03 | 118 | 109.7 | 94.6 | 106.9 | 103 |
| 2024-04 | 117.9 | 110 | 94.8 | 107 | 103 |
| 2024-05 | 118.1 | 110.1 | 94.9 | 107.2 | 103.1 |
| 2024-06 | 118.4 | 110 | 94.9 | 107.4 | 103.1 |
| 2024-07 | 118.8 | 109.8 | 94.9 | 107.5 | 103.3 |
| 2024-08 | 118.6 | 109.8 | 94.9 | 108 | 103.3 |
| 2024-09 | 118.8 | 109.9 | 95 | 109 | 103.7 |
| 2024-10 | 117.4 | 109.9 | 84.4 | 108.7 | 102.6 |
| 2024-11 | 118 | 110.1 | 94.2 | 109 | 103.4 |
| 2024-12 | 118.3 | 110.4 | 94.2 | 109.5 | 103.7 |
| 2025-01 | 118.3 | 109.9 | 94 | 109.9 | 103.7 |
| 2025-02 | 118.2 | 109.7 | 94.3 | 109.8 | 103.5 |
| 2025-03 | 118.7 | 109.9 | 93.4 | 109.9 | 103.5 |
| 2025-04 | 118.8 | 109.9 | 93.2 | 110.7 | 103.7 |
| 2025-05 | 119.2 | 109.9 | 92.9 | 110.9 | 103.9 |
| 2025-06 | 119 | 109.7 | 92.7 | 111.2 | 103.8 |
| 2025-07 | 118.8 | 109.3 | 92.5 | 111.2 | 103.7 |
| 2025-08 | 118.7 | 108.4 | 92.1 | 110.9 | 103.6 |
| 2025-09 | 118.9 | 109.5 | 91.9 | 111 | 103.5 |
| 2025-10 | 119.2 | 110.9 | 92.2 | 111.7 | 103.6 |
| 2025-11 | 119.1 | 111.2 | 91.7 | 112.1 | 103.7 |
| 2025-12 | 118.6 | 111.1 | 92.3 | 112.7 | 103.8 |
| 2026-01 | 120.1 | 110.6 | 92.7 | 112.5 | 103.8 |
| 2026-02 | 121.4 | 110.1 | 92.8 | 111.9 | 103.7 |
| 2026-03 | 120.8 | 110.1 | 93.3 | 112.1 | 103.8 |
| 2026-04 | 120.2 | 109.9 | 93.7 | 112 | 103.8 |
| 2026-05 | 118.8 | 110.5 | 94 | 111.8 | 103.9 |
| 2026-06 | 118.9 | 110.9 | 93.9 | 112.2 | 103.8 |
| 2026-07 | 119 | 110.5 | 94.4 | 112.8 | 104 |
| 2026-08 | 118.3 | 110.1 | 94.4 | 112.8 | 104 |
Professional and business services payrolls, indexed to January 2020

View exact chart values
| month | washington | california | texas | new_jersey |
|---|---|---|---|---|
| 2020-01 | 100 | 100 | 100 | 100 |
| 2020-02 | 100.1 | 100 | 100.3 | 99.8 |
| 2020-03 | 100.2 | 98.9 | 100 | 99.9 |
| 2020-04 | 93.8 | 89.3 | 92.2 | 88 |
| 2020-05 | 93.7 | 90.6 | 92.8 | 89 |
| 2020-06 | 94.8 | 91.6 | 93.8 | 89.7 |
| 2020-07 | 95.4 | 91.9 | 94.7 | 92 |
| 2020-08 | 96.1 | 92.5 | 95.6 | 93.1 |
| 2020-09 | 97 | 93 | 95.8 | 93.6 |
| 2020-10 | 98.8 | 94.1 | 97.1 | 95.2 |
| 2020-11 | 99.4 | 94.6 | 98.1 | 95.6 |
| 2020-12 | 100.1 | 95.1 | 99 | 96.4 |
| 2021-01 | 99.5 | 95.8 | 99.5 | 97.9 |
| 2021-02 | 99.9 | 96.2 | 99.4 | 98 |
| 2021-03 | 100.5 | 96.8 | 100.9 | 98.1 |
| 2021-04 | 100.3 | 97 | 101.5 | 98.8 |
| 2021-05 | 100.7 | 97.4 | 102.4 | 99.2 |
| 2021-06 | 100.7 | 97.1 | 103 | 99.1 |
| 2021-07 | 101.6 | 98.2 | 104.2 | 100.9 |
| 2021-08 | 102.1 | 98.2 | 104.8 | 100.5 |
| 2021-09 | 102.9 | 98.4 | 105.9 | 100.3 |
| 2021-10 | 105 | 100.8 | 108.3 | 103.7 |
| 2021-11 | 105.5 | 101.4 | 108.9 | 104.3 |
| 2021-12 | 106.2 | 101.8 | 109.6 | 104.5 |
| 2022-01 | 109.3 | 102.2 | 109.4 | 104.4 |
| 2022-02 | 110.7 | 102.8 | 110.8 | 104.9 |
| 2022-03 | 111.4 | 103 | 111.2 | 105.1 |
| 2022-04 | 111.9 | 103.7 | 112.2 | 104.9 |
| 2022-05 | 112.2 | 103.6 | 112.6 | 105 |
| 2022-06 | 112.3 | 103.8 | 112.8 | 104.3 |
| 2022-07 | 112.6 | 103.9 | 114.1 | 106.1 |
| 2022-08 | 112.7 | 103.9 | 114.5 | 105.7 |
| 2022-09 | 112.5 | 104 | 114.7 | 105 |
| 2022-10 | 113 | 103.8 | 115 | 104.8 |
| 2022-11 | 112.8 | 103.3 | 115 | 105.3 |
| 2022-12 | 112.6 | 103 | 115 | 105.2 |
| 2023-01 | 112.8 | 102.4 | 115.3 | 105.2 |
| 2023-02 | 112.7 | 101.9 | 115.3 | 104.9 |
| 2023-03 | 112.3 | 101.5 | 115.2 | 104.9 |
| 2023-04 | 112 | 101.2 | 115.3 | 103.6 |
| 2023-05 | 111.8 | 101.2 | 115.1 | 104.5 |
| 2023-06 | 112.1 | 101.2 | 115.2 | 104.6 |
| 2023-07 | 111.6 | 100.6 | 115.1 | 104.3 |
| 2023-08 | 111.3 | 100.4 | 114.8 | 104.3 |
| 2023-09 | 111.3 | 100.5 | 114.8 | 104.8 |
| 2023-10 | 111.3 | 99.9 | 114.8 | 103.8 |
| 2023-11 | 111.5 | 99.6 | 115 | 103.5 |
| 2023-12 | 111.5 | 99.6 | 114.9 | 103.4 |
| 2024-01 | 111.2 | 100.9 | 114.9 | 103.5 |
| 2024-02 | 111.1 | 100.2 | 114.9 | 103.3 |
| 2024-03 | 111.2 | 100 | 115 | 103.4 |
| 2024-04 | 111 | 99.3 | 114.8 | 103 |
| 2024-05 | 111.3 | 99.2 | 115 | 103 |
| 2024-06 | 111.4 | 99 | 115.2 | 103.1 |
| 2024-07 | 111.5 | 99.2 | 114.5 | 102.5 |
| 2024-08 | 111.6 | 98.9 | 115.3 | 102.8 |
| 2024-09 | 111.7 | 98.7 | 115.4 | 103 |
| 2024-10 | 111.1 | 99 | 115.6 | 103.3 |
| 2024-11 | 110.8 | 98.7 | 115.7 | 103.2 |
| 2024-12 | 111.1 | 98.1 | 115.8 | 103.4 |
| 2025-01 | 111.1 | 98.4 | 115.6 | 103.4 |
| 2025-02 | 110.8 | 98.2 | 115.4 | 103.5 |
| 2025-03 | 110.9 | 98.2 | 115.3 | 103.5 |
| 2025-04 | 111.1 | 98.4 | 115.9 | 103.4 |
| 2025-05 | 111.7 | 98.4 | 116.1 | 103.6 |
| 2025-06 | 111.5 | 98.1 | 115.9 | 103.3 |
| 2025-07 | 111.6 | 98.1 | 115.9 | 102.8 |
| 2025-08 | 111.8 | 98.3 | 116.1 | 102.7 |
| 2025-09 | 111.6 | 98.2 | 115.9 | 102.9 |
| 2025-10 | 111.8 | 98.4 | 115.4 | 102.5 |
| 2025-11 | 111.6 | 98.2 | 115.8 | 102.2 |
| 2025-12 | 111.1 | 98.2 | 116.2 | 102.7 |
| 2026-01 | 111.4 | 98.6 | 116.8 | 102.9 |
| 2026-02 | 112.2 | 98.7 | 117.2 | 102.7 |
| 2026-03 | 112.5 | 98.6 | 117.9 | 103 |
| 2026-04 | 112.7 | 98.4 | 118.2 | 103.7 |
| 2026-05 | 112.4 | 98 | 118.3 | 103.7 |
| 2026-06 | 112.7 | 98.2 | 119.4 | 103.7 |
| 2026-07 | 113.2 | 97.8 | 119.4 | 102 |
| 2026-08 | 112.4 | 97.7 | 119.6 | 101.5 |
California lost information jobs. Health care more than replaced them.
Adobe’s home state is a different machine. California’s information payroll fell to 510,700 in August 2026, down 12,300 jobs, or 2.4 percent, since January 2025 — and down 12.4 percent from January 2020. Manufacturing lost 28,600 jobs over the same 19 months. The professional-and-business-services supersector, the bucket that includes both high-end consulting and the temp desk, is 18,500 jobs smaller than in January 2025 and still 2.3 percent below January 2020. Professional, scientific and technical services itself eked out 5,900 jobs, 0.4 percent. That is not a hiring surge. It is a rounding error next to what hospitals did.
Private education and health services in California added 247,600 jobs from January 2025 to August 2026, a 7.3 percent jump. The state’s entire nonfarm payroll rose 152,400. Health care did not merely lead the expansion. It more than accounted for it, covering losses in information, factories and the professional-services supersector and then some. Index the series to January 2020 and the split is cartoonish: education and health at 127.1, information at 87.6, manufacturing at 93.1. California is still adding jobs. It is not adding them in the industries a Microsoft-and-Adobe freeze is built to police.
California’s hiring engine is health care, not tech

View exact chart values
| month | pst | information | manufacturing | ed_health | total_nonfarm |
|---|---|---|---|---|---|
| 2020-01 | 100 | 100 | 100 | 100 | 100 |
| 2020-02 | 100.5 | 101 | 99.8 | 100.4 | 100.1 |
| 2020-03 | 99.8 | 101 | 99.3 | 100 | 99.1 |
| 2020-04 | 93.3 | 88.1 | 90.2 | 90 | 84.6 |
| 2020-05 | 94.5 | 88.1 | 92 | 91.4 | 85.7 |
| 2020-06 | 94.5 | 87.2 | 93.8 | 94.1 | 88.6 |
| 2020-07 | 94.2 | 88.7 | 93.1 | 94.4 | 88.8 |
| 2020-08 | 94.4 | 89.4 | 93.5 | 94.8 | 89.4 |
| 2020-09 | 94.8 | 89.7 | 93.9 | 95.3 | 90.2 |
| 2020-10 | 95.9 | 91.1 | 94.2 | 95.9 | 91.4 |
| 2020-11 | 95.9 | 92.6 | 94.3 | 96.1 | 91.8 |
| 2020-12 | 96.3 | 93.1 | 94.4 | 96.6 | 91.3 |
| 2021-01 | 96.7 | 91.1 | 94.1 | 96.2 | 90.7 |
| 2021-02 | 97 | 91.3 | 94.6 | 96.7 | 91.9 |
| 2021-03 | 97.6 | 93.4 | 95.1 | 97.1 | 92.7 |
| 2021-04 | 98.2 | 95.6 | 95.2 | 97.9 | 93.5 |
| 2021-05 | 98.8 | 97.6 | 95.4 | 98.3 | 94.2 |
| 2021-06 | 98.5 | 97.2 | 95.5 | 98.6 | 94.6 |
| 2021-07 | 99.5 | 97.5 | 96 | 99 | 95.7 |
| 2021-08 | 99.8 | 101.8 | 96.1 | 99.2 | 96.2 |
| 2021-09 | 100.1 | 99.3 | 96.1 | 98.9 | 96.2 |
| 2021-10 | 102 | 101.5 | 97.3 | 99.8 | 97.6 |
| 2021-11 | 102.3 | 102.4 | 97.8 | 100.2 | 98 |
| 2021-12 | 102.7 | 102.1 | 98.2 | 100.5 | 98.4 |
| 2022-01 | 103.2 | 103.6 | 98.5 | 100 | 98.4 |
| 2022-02 | 104 | 104.9 | 99.1 | 100.4 | 99.2 |
| 2022-03 | 104.5 | 105.2 | 99.4 | 101 | 99.5 |
| 2022-04 | 105.2 | 105.7 | 99.8 | 101.6 | 99.9 |
| 2022-05 | 105.3 | 106.6 | 99.9 | 102 | 100 |
| 2022-06 | 105.9 | 107.1 | 100.1 | 102.5 | 100.3 |
| 2022-07 | 106.1 | 107.7 | 100.5 | 102.8 | 100.6 |
| 2022-08 | 106.3 | 108 | 100.7 | 103.2 | 100.8 |
| 2022-09 | 106.5 | 106.7 | 100.6 | 103.9 | 100.9 |
| 2022-10 | 106.2 | 106.1 | 100.7 | 104.2 | 100.8 |
| 2022-11 | 106.2 | 105.2 | 100.7 | 104.7 | 100.9 |
| 2022-12 | 106.2 | 104.7 | 100.6 | 105.1 | 100.9 |
| 2023-01 | 105.7 | 103 | 100.6 | 105.2 | 100.7 |
| 2023-02 | 105.5 | 101 | 100.5 | 105.8 | 100.8 |
| 2023-03 | 105.3 | 100.2 | 100.3 | 106.2 | 100.8 |
| 2023-04 | 104.9 | 98.3 | 100 | 107 | 100.7 |
| 2023-05 | 105.1 | 97.5 | 99.8 | 108.1 | 101 |
| 2023-06 | 105.2 | 95.8 | 99.6 | 108.5 | 101.2 |
| 2023-07 | 104.5 | 94.3 | 98.9 | 108.8 | 100.9 |
| 2023-08 | 104.5 | 92.6 | 98.8 | 109.5 | 101.1 |
| 2023-09 | 104.7 | 92.2 | 98.9 | 110.6 | 101.4 |
| 2023-10 | 104.2 | 91.7 | 98.8 | 110.4 | 101.2 |
| 2023-11 | 103.9 | 91.9 | 98.2 | 111 | 101.3 |
| 2023-12 | 104.1 | 92.9 | 98.1 | 111.9 | 101.5 |
| 2024-01 | 105.9 | 93 | 98.2 | 112.5 | 102.2 |
| 2024-02 | 105.3 | 92.9 | 97.6 | 113.1 | 101.8 |
| 2024-03 | 104.9 | 93.7 | 97.4 | 113.7 | 101.9 |
| 2024-04 | 103.9 | 93.2 | 97.1 | 114 | 101.7 |
| 2024-05 | 103.7 | 92.9 | 96.9 | 114.5 | 101.7 |
| 2024-06 | 103.5 | 92.5 | 96.8 | 115 | 101.6 |
| 2024-07 | 103.9 | 92.7 | 96.4 | 115.7 | 101.8 |
| 2024-08 | 103.2 | 92.9 | 96.2 | 116.3 | 101.9 |
| 2024-09 | 103.1 | 92.7 | 96.1 | 116.7 | 102 |
| 2024-10 | 103.7 | 92 | 95.8 | 117.4 | 102.3 |
| 2024-11 | 103.1 | 92.3 | 95.6 | 117.9 | 102.3 |
| 2024-12 | 102.1 | 91.1 | 95.4 | 118.1 | 102.1 |
| 2025-01 | 102.7 | 89.7 | 95.3 | 118.5 | 102.2 |
| 2025-02 | 102.6 | 91 | 95 | 119.3 | 102.1 |
| 2025-03 | 102.4 | 89.8 | 94.8 | 119.7 | 102.1 |
| 2025-04 | 102.7 | 90.9 | 94.6 | 120.5 | 102.4 |
| 2025-05 | 102.7 | 91.1 | 94.5 | 121 | 102.4 |
| 2025-06 | 102.5 | 91.1 | 94.2 | 121.1 | 102.3 |
| 2025-07 | 102.7 | 91.3 | 93.9 | 121.8 | 102.2 |
| 2025-08 | 102.9 | 91.5 | 93.8 | 122.5 | 102.3 |
| 2025-09 | 102.7 | 91 | 93.6 | 123.1 | 102.2 |
| 2025-10 | 103 | 89.9 | 93.9 | 123.5 | 102.2 |
| 2025-11 | 103.1 | 89.5 | 93.7 | 124 | 102.4 |
| 2025-12 | 103 | 89.6 | 93.8 | 124.1 | 102.4 |
| 2026-01 | 103.6 | 89.2 | 93.9 | 125.1 | 102.9 |
| 2026-02 | 103.8 | 89.6 | 93.7 | 124.3 | 102.8 |
| 2026-03 | 103.7 | 89.5 | 93.5 | 125.4 | 103 |
| 2026-04 | 103.6 | 88.1 | 93.3 | 125.7 | 103 |
| 2026-05 | 103.5 | 88.2 | 93.3 | 126 | 102.9 |
| 2026-06 | 103.7 | 88.2 | 93 | 126.4 | 102.9 |
| 2026-07 | 103.2 | 87.8 | 93 | 126.5 | 102.8 |
| 2026-08 | 103.1 | 87.6 | 93.1 | 127.1 | 103.1 |
Who added jobs since January 2025 — and who did not

View exact chart values
| label | change_thousands | aug2026 | jan2025 | pct |
|---|---|---|---|---|
| California manufacturing | -28.6 | 1203.8 | 1232.4 | -2.3 |
| California PBS supersector | -18.5 | 2739.2 | 2757.7 | -0.7 |
| New Jersey PBS supersector | -13 | 699.7 | 712.7 | -1.8 |
| California information | -12.3 | 510.7 | 523 | -2.4 |
| Washington professional/scientific | -0.1 | 259.2 | 259.3 | 0 |
| Washington information | 0.3 | 164.1 | 163.8 | 0.2 |
| Washington manufacturing | 1.2 | 276 | 274.8 | 0.4 |
| California professional/scientific | 5.9 | 1395.1 | 1389.2 | 0.4 |
| Washington PBS supersector | 6.7 | 546.6 | 539.9 | 1.2 |
| Washington total nonfarm | 11.1 | 3647 | 3635.9 | 0.3 |
| Washington education & health | 15.1 | 574.2 | 559.1 | 2.7 |
| Texas PBS supersector | 74.7 | 2190.6 | 2115.9 | 3.5 |
| California total nonfarm | 152.4 | 18177.2 | 18024.8 | 0.8 |
| California education & health | 247.6 | 3635.1 | 3387.5 | 7.3 |
Texas is still hiring. New Jersey is not.
The Indian IT majors on the Labor Department’s list have large footprints in Texas and New Jersey as well as on the coasts. Those two states are not having the same decade. Texas professional and business services rose to 2.19 million jobs in August 2026, up 74,700, or 3.5 percent, since January 2025, and up 19.6 percent since January 2020. Texas nonfarm employment is 11.8 percent above January 2020. New Jersey’s professional-and-business-services payroll fell 13,000 jobs, or 1.8 percent, from January 2025 to August 2026, and is only 1.5 percent above January 2020. A national freeze treats Microsoft in Redmond and a staffing pipeline in Dallas as the same problem. The payrolls do not.
Shares of the job market tell the same split. Professional and business services were 15.0 percent of Washington employment and 15.1 percent of California’s and Texas’s in August 2026. Washington and Texas have seen that share drift up since 2020; California’s has drifted down, from 15.9 percent to 15.1 percent, as health care took more of the state. The freeze is a federal instrument. The labor market it lands on is already regional.
The output kept rising anyway
Jobs are not the same thing as output. BEA GDP in computer systems design and related services — the industry line that covers custom software, systems integration and on-site IT operations — was $569.2 billion nationwide in 2025, in current dollars. California accounted for $123.2 billion, 21.6 percent of the U.S. total. Texas was $60.4 billion (10.6 percent). Washington, Microsoft’s home, was $24.7 billion (4.3 percent), still ahead of New Jersey’s $17.8 billion. Those are 2025 annual figures, published in BEA’s September 30, 2026 state GDP release; they are not August 2026 observations, and they are not inflation-adjusted.
Washington’s computer-systems GDP more than doubled from 2019, up 125.5 percent in nominal terms, while its professional-scientific payroll has been flat for a year and a half. California’s computer-systems output rose 53.8 percent over the same span even as information employment shrank. Texas’s computer-systems GDP was up 70.8 percent. A freeze that treats headcount as the scoreboard is aiming at the lagging indicator. The dollars kept moving after the hiring did not. That does not prove automation, offshoring, or visa substitution. It does show that “American workers first” is arriving in states where the American workers in these industries have already stopped being added, and where the work, measured in output, did not stop with them.
Computer-systems output kept rising even as hiring cooled

View exact chart values
| year | us_billions | california_billions | texas_billions | new_jersey_billions | washington_billions | us_share_ca | us_share_tx | us_share_wa | us_share_nj |
|---|---|---|---|---|---|---|---|---|---|
| 2015 | 286.7 | 55.2 | 23.6 | 11.6 | 7.3 | 19.3 | 8.2 | 2.5 | 4 |
| 2016 | 307.6 | 59.9 | 25.3 | 12.2 | 8.2 | 19.5 | 8.2 | 2.7 | 4 |
| 2017 | 326.4 | 65.9 | 26.9 | 12.1 | 9 | 20.2 | 8.2 | 2.7 | 3.7 |
| 2018 | 358.5 | 74 | 30.3 | 12.9 | 10.4 | 20.6 | 8.5 | 2.9 | 3.6 |
| 2019 | 378.6 | 80.1 | 35.4 | 13.2 | 11 | 21.1 | 9.3 | 2.9 | 3.5 |
| 2020 | 393.5 | 87.7 | 34.2 | 12.9 | 11.9 | 22.3 | 8.7 | 3 | 3.3 |
| 2021 | 436.2 | 99.3 | 40.5 | 14 | 15.5 | 22.8 | 9.3 | 3.5 | 3.2 |
| 2022 | 460.5 | 90.8 | 47.7 | 16.2 | 17.5 | 19.7 | 10.4 | 3.8 | 3.5 |
| 2023 | 496.8 | 95.8 | 52.1 | 17.3 | 20.2 | 19.3 | 10.5 | 4.1 | 3.5 |
| 2024 | 529.3 | 107.9 | 57.4 | 17.5 | 20.1 | 20.4 | 10.9 | 3.8 | 3.3 |
| 2025 | 569.2 | 123.2 | 60.4 | 17.8 | 24.7 | 21.6 | 10.6 | 4.3 | 3.1 |
Sources and methods
Payroll figures are seasonally adjusted State and Area Employment estimates from the U.S. Bureau of Labor Statistics, in thousands of jobs, from a snapshot dated 2026-08-24. The latest month in the extract is August 2026. They are not the national CES totals in the October 2 jobs report, and they are not current-day observations.
Professional and business services is a supersector. Professional, scientific and technical services is a tighter industry group inside it. Information includes software publishers and, in California, motion pictures. None of these series identifies visa status, employer, or H-1B holders. State totals cannot be read as Microsoft, Adobe, or any named IT-services firm.
GDP figures are BEA annual GDP by state for NAICS 5415, computer systems design and related services, in millions of current dollars, converted to billions by dividing by 1,000. The series is nominal, not inflation-adjusted, and the latest year in the extract is 2025 (BEA regional release 2026-09-30). Output is not employment.
January 2020 is used as an index base because it is the last full pre-pandemic January in the window, not because it is a policy start date. January 2025 to August 2026 is the span overlapping the current administration’s second year and the PERM action. Null values were skipped, not treated as zero. No duplicate period rows appeared in these extracts.
This is a descriptive comparison of published estimates. It does not estimate the effect of the PERM suspension, of H-1B fees, or of any company’s layoffs.
Research completed 2026-10-11, for the October 10, 2026 news edition. The available source data may cover earlier periods; see the observation periods and source vintages above.