Research
Michigan’s hospital bill isn’t the outlier. The insurance line is.
The lawsuit, and the books it does not cite
Michigan Attorney General Dana Nessel went to federal court this week calling Blue Cross Blue Shield of Michigan an illegal monopoly — 65 percent of the state’s health-insurance products, 79 percent of the PPO market, a “Blue Conspiracy” of territorial deals, and a business model that, in her telling, has raised premiums while driving provider rates so low that labor wards close. The complaint is a market-structure argument. It is not a spending spreadsheet. The official spreadsheet is sitting in the Commerce Department’s state consumption accounts, and it tells a more awkward story than either “Michigan’s care is uniquely expensive” or “the hospitals are fine.”
BEA’s state consumption accounts put Michigan households’ health-care services — outpatient, hospital and nursing-home care, including amounts insurers and government paid on their behalf — at $9,725 per person in 2025. The U.S. figure was $10,442. Michigan has been at or a little below the national average for most of the past decade, and the gap widened after 2020. In current dollars, that per-person bill has more than tripled since 1997, when it was $2,871 in Michigan and $2,901 nationwide. The increase is large. It is not a Michigan-only spike.
Two caveats before anyone treats those dollars as a premium invoice. First, they are current dollars, not inflation-adjusted. Second, “health care” here is the consumption of care, not the check written to Blue Cross. Insurance shows up on a different line. That split is the whole point of looking.
Michigan’s health-care spending per person rose, but stayed below the U.S. average

View exact chart values
| year | michigan | united_states |
|---|---|---|
| 1997 | 2871 | 2901 |
| 1998 | 2913 | 3016 |
| 1999 | 2992 | 3095 |
| 2000 | 3138 | 3255 |
| 2001 | 3296 | 3497 |
| 2002 | 3520 | 3765 |
| 2003 | 3724 | 3978 |
| 2004 | 3990 | 4231 |
| 2005 | 4277 | 4469 |
| 2006 | 4532 | 4665 |
| 2007 | 4806 | 4907 |
| 2008 | 5032 | 5115 |
| 2009 | 5234 | 5322 |
| 2010 | 5490 | 5493 |
| 2011 | 5683 | 5635 |
| 2012 | 5848 | 5794 |
| 2013 | 5894 | 5884 |
| 2014 | 6050 | 6094 |
| 2015 | 6371 | 6400 |
| 2016 | 6641 | 6674 |
| 2017 | 6778 | 6875 |
| 2018 | 6950 | 7137 |
| 2019 | 7275 | 7487 |
| 2020 | 6777 | 7100 |
| 2021 | 7504 | 7956 |
| 2022 | 7875 | 8438 |
| 2023 | 8391 | 9098 |
| 2024 | 9088 | 9786 |
| 2025 | 9725 | 10442 |
The hospital line is the cheap one
Nessel’s filing dwells on closed maternity units, Sturgis Hospital’s shutdown, and a 2026 fight in which Blue Cross proposed a 30 percent cut in rates to Michigan Medicine. If that squeeze were already emptying the state’s hospital economy, you would expect Michigan’s hospital consumption per person to sit at the top of the Midwest. It does not.
Divide BEA’s 2025 hospital consumption by midyear resident population and Michigan spent about $4,733 per person on hospital services. That is the lowest reading among the six states in this comparison: Minnesota $4,741, Wisconsin $4,939, Illinois $5,287, Ohio $5,291, Indiana $5,908. Michigan’s hospital line was $47.9 billion in 2025, or 8.3 percent of the state’s $580.8 billion in personal consumption. In 1997 it was $1,389 per person. The hospital bill grew. Relative to the neighbors Nessel herself named as healthier insurance markets — Indiana, Minnesota, Wisconsin — Michigan is not the expensive hospital state.
That is not a verdict on quality, access, or whether a rural emergency room should have stayed open. Consumption per person can be low because prices are low, because people use less care, because they leave the state for treatment, or because the data allocate spending to where patients live. It is a descriptive fact: the hospital ledger, on a per-person basis, does not show Michigan as the region’s high spender.
Michigan’s hospital bill per person is the lowest among nearby states

View exact chart values
| state | dollars_per_person | millions |
|---|---|---|
| Michigan | 4733 | 47931.8 |
| Minnesota | 4741 | 27644.4 |
| Wisconsin | 4939 | 29499.4 |
| Illinois | 5287 | 67251.1 |
| Ohio | 5291 | 62969.6 |
| Indiana | 5908 | 41201.4 |
The insurance line is the expensive one
The number that does jump off the page is BEA’s “net health insurance” series. That is not the premium on a benefits statement. In the consumption accounts it is the insurance service charge — the intermediation margin after benefits. Treat it as a thermometer for how large the insurance layer is in the state’s measured consumption, not as what a family paid Blue Cross last year.
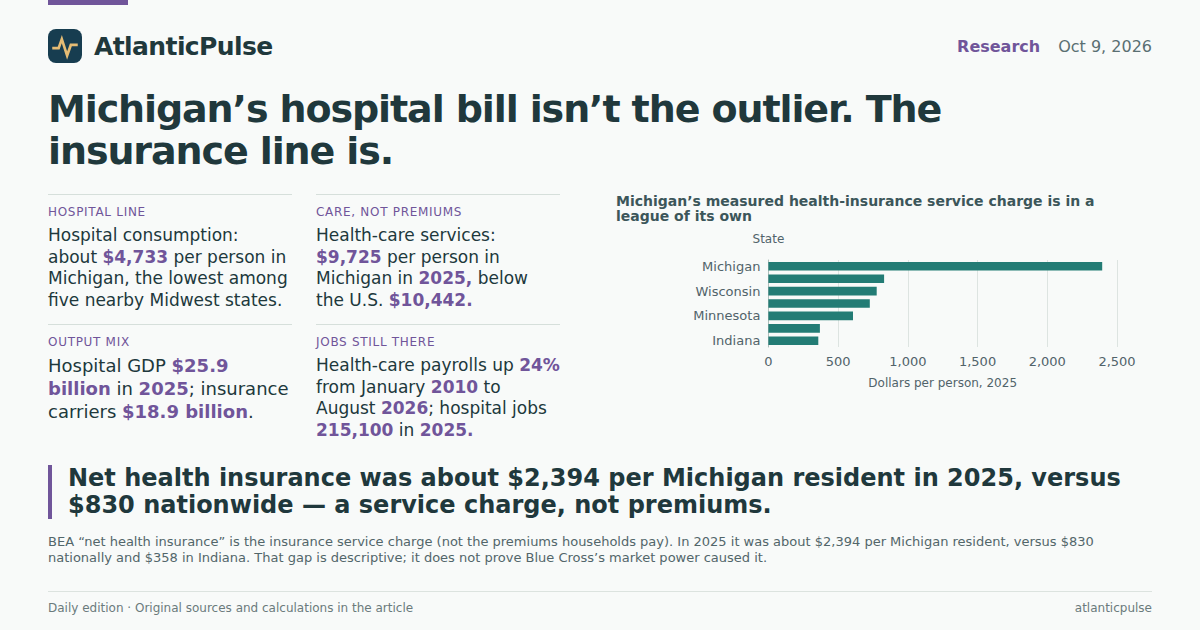
In 2025 that service charge was about $2,394 per Michigan resident, or $24.2 billion. The U.S. figure was $830. Indiana was $358, Illinois $369, Minnesota $607, Ohio $727, Wisconsin $777. Michigan is not a little high. It is in a different distribution. The gap opened in the 2010s: Michigan was $291 per person in 1997, close to the U.S. $270, then climbed past $1,000 in 2012 and kept going. As a share of Michigan consumption, net health insurance rose from 1.5 percent in 1997 to 4.2 percent in 2025. Health-care services themselves were 21.0 percent of consumption, up from 16.9 percent. Put the two together and a quarter of what Michigan consumes, on these books, is care plus the insurance layer.
None of that proves Nessel’s monopoly theory. A fat service-charge line can reflect richer employer coverage, different mix of plans, or the way BEA allocates national insurance across states. A thin hospital line can reflect lower prices or less use. The coincidence is still the story the lawsuit is asking a court to explain: the insurance intermediation layer looks huge in Michigan, and the hospital consumption layer does not.
Michigan’s measured health-insurance service charge is in a league of its own

View exact chart values
| state | dollars_per_person | millions |
|---|---|---|
| Indiana | 358 | 2498.7 |
| Illinois | 369 | 4695.6 |
| Minnesota | 607 | 3537.5 |
| Ohio | 727 | 8656.7 |
| Wisconsin | 777 | 4641.2 |
| United States | 830 | 283828.2 |
| Michigan | 2394 | 24245.6 |
The jobs did not vanish. The output mix shifted.
On the industry side of the same market, BEA’s GDP accounts do not show a hospital sector that has been erased. Michigan hospital GDP was $25.9 billion in 2025, up from $7.0 billion in 1997. Insurance carriers and related activities were $18.9 billion, up from $6.2 billion, with a much bumpier path — including a 2008 plunge and a dip as recently as 2024. Hospitals still produce more output than the insurance-carrier industry in the state. The lawsuit’s picture of a dominant payer squeezing providers is a story about relative power, not about which NAICS code is larger.
Payrolls tell a similar mixed story. BLS state employment puts Michigan hospital jobs at 215,100 in 2025, annual average, up from 169,800 in 2001. That is growth, not a collapse, with a pandemic dip from 210,400 in 2019 to 200,100 in 2022 before the recovery. Broader health care and social assistance employment, seasonally adjusted, rose from 534,200 in January 2010 to 661,900 in August 2026, a 24 percent increase. Finance and insurance — a wider bucket than Blue Cross — rose 30 percent over the same span, from 140,400 to 182,700. Total nonfarm payrolls were up 17 percent. Health care’s share of the state’s job market went from 13.9 percent to 14.7 percent. The workers are still there. They have not been the fastest-growing file in the cabinet.
If you came to these tables looking for a simple morality play — greedy insurer, vanishing hospitals — you will not find it. What you will find is a state whose measured consumption of hospital care is modest by Midwest standards, whose measured insurance service charge is not, and whose hospital and health-care payrolls kept adding people even as the attorney general described a system being hollowed out.
Hospital output in Michigan still outruns the insurance-carrier industry

View exact chart values
| year | insurance_carriers | hospitals |
|---|---|---|
| 1997 | 6169.7 | 7027.2 |
| 1998 | 6711.8 | 7244.7 |
| 1999 | 6723.3 | 7800.5 |
| 2000 | 8087.4 | 8122.2 |
| 2001 | 7364.2 | 8425.5 |
| 2002 | 7311.8 | 9166.4 |
| 2003 | 8010.9 | 9726.5 |
| 2004 | 10171.4 | 10310.5 |
| 2005 | 12463.3 | 10975.5 |
| 2006 | 14682.4 | 11683.4 |
| 2007 | 14368.2 | 12309.3 |
| 2008 | 9269.8 | 13241 |
| 2009 | 11905.7 | 13854.6 |
| 2010 | 11825.2 | 13978 |
| 2011 | 11227.1 | 14553.4 |
| 2012 | 11504.4 | 15248.7 |
| 2013 | 10176.6 | 15435.2 |
| 2014 | 12984.8 | 15793.8 |
| 2015 | 16201.9 | 16873.9 |
| 2016 | 16070.3 | 17730.9 |
| 2017 | 13383.2 | 18279.1 |
| 2018 | 13871.7 | 19095.7 |
| 2019 | 14961.9 | 19632.3 |
| 2020 | 14766.7 | 19787.6 |
| 2021 | 14520.7 | 20501.5 |
| 2022 | 16129.4 | 21242.8 |
| 2023 | 18119.3 | 22415 |
| 2024 | 16546.6 | 24229.3 |
| 2025 | 18909.3 | 25878.8 |
Health-care jobs in Michigan grew. They did not outrun finance and insurance.

View exact chart values
| month | health_care_index | finance_insurance_index |
|---|---|---|
| 2010-01 | 100 | 100 |
| 2010-07 | 100.6 | 99.3 |
| 2011-01 | 101.9 | 101.6 |
| 2011-07 | 103.7 | 103 |
| 2012-01 | 104.8 | 104.3 |
| 2012-07 | 105.5 | 105.9 |
| 2013-01 | 106 | 108.2 |
| 2013-07 | 106.8 | 110.2 |
| 2014-01 | 107 | 110.3 |
| 2014-07 | 107 | 110 |
| 2015-01 | 107.8 | 110.4 |
| 2015-07 | 108.7 | 112.1 |
| 2016-01 | 110.6 | 114 |
| 2016-07 | 111.8 | 115.7 |
| 2017-01 | 112.5 | 118.1 |
| 2017-07 | 113.6 | 118.2 |
| 2018-01 | 114.4 | 117.9 |
| 2018-07 | 114.4 | 118.9 |
| 2019-01 | 114.6 | 119.1 |
| 2019-07 | 115.1 | 121.4 |
| 2020-01 | 115.5 | 123.3 |
| 2020-07 | 105.4 | 123.3 |
| 2021-01 | 109.3 | 128.1 |
| 2021-07 | 108.7 | 128.6 |
| 2022-01 | 108.9 | 127.5 |
| 2022-07 | 110 | 126.4 |
| 2023-01 | 112.4 | 125.5 |
| 2023-07 | 115.1 | 126.2 |
| 2024-01 | 116.9 | 126.6 |
| 2024-07 | 118.8 | 127.2 |
| 2025-01 | 121 | 129.6 |
| 2025-07 | 122.4 | 130 |
| 2026-01 | 122.9 | 130.2 |
| 2026-07 | 123.6 | 129.7 |
| 2026-08 | 123.9 | 130.1 |
Sources and methods
BEA Personal Consumption Expenditures by State, annual calendar years 1997–2025, current dollars, from the September 30, 2026 SAPCE release. These are not current-day observations. Per-capita health-care services are BEA’s published series (outpatient, hospital and nursing-home services). Hospital dollars per person and net-health-insurance dollars per person are calculated as BEA millions of current dollars times 1,000,000, divided by BEA midyear resident population (SAINC30). Net health insurance is the consumption-account service charge, not premiums paid. Hospital and health PCE include third-party payments on behalf of residents. Aggregates are not household averages.
BEA annual GDP by state, current dollars, 1997–2025, same September 30, 2026 regional release, for NAICS insurance carriers and related activities and hospitals. Output is not the same as premiums, claims, or household spending.
BLS State and Area Employment, all-history files, snapshot dated August 24, 2026. Hospital employment is the not-seasonally-adjusted annual average (thousands). Health care and social assistance, finance and insurance, and total nonfarm are seasonally adjusted monthly payrolls in thousands; the latest month used is August 2026. Indexes use January 2010 = 100. NSA annual hospital series and SA monthly series are not mixed in the same comparison. Missing values were not treated as zero. No duplicate year keys were found in the annual extracts.
Peer states are Indiana, Ohio, Illinois, Wisconsin and Minnesota — the Midwest markets named in the underlying reporting as retention or competition comparators — plus the United States where the series exists. Dictionary presence was not treated as proof of observations; each series-geography pair was extracted. No causal effect is inferred from these descriptive comparisons. Provider/refresh lag in the pinned catalogue is normal.
Research completed 2026-10-10, for the October 9, 2026 news edition. The available source data may cover earlier periods; see the observation periods and source vintages above.