Research
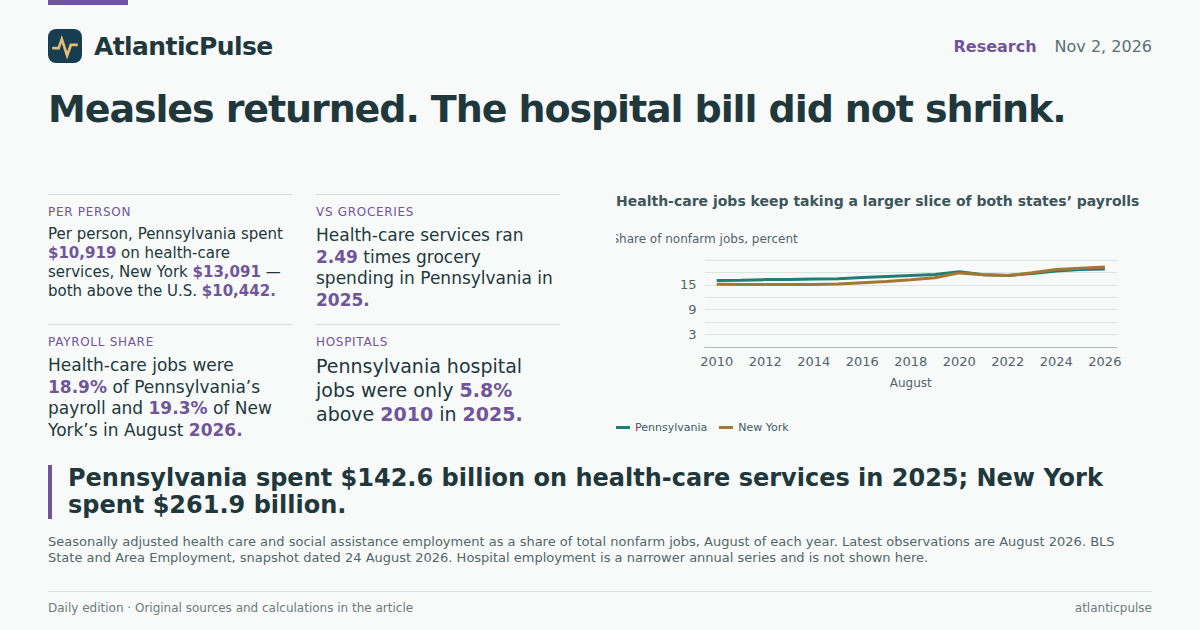
Measles came back. The hospital bill never left.
A preventable disease in an expensive system
Pennsylvania has logged more than 1,350 measles cases this year, over a third of them in Lancaster County, with measles-associated deaths in that county and elsewhere in the state. Community leaders say even that count is low, because many Plain families never see a doctor. New York recorded its first measles-related death in 30 years, a child in Lewis County, after 168 cases statewide. Those facts are grim. They are not evidence that either state ran out of hospitals.
The official consumption books say the opposite. In calendar 2025, Pennsylvania households spent $142.6 billion on health-care services — outpatient care plus hospitals and nursing homes — and New York households spent $261.9 billion, according to the Bureau of Economic Analysis’s state consumer-spending accounts. That is current-dollar spending, not an inflation-adjusted volume, and it stops at 2025, months before this autumn’s case counts. It is still the right scale check. A disease that public-health agencies declared eliminated in the United States in 2000 is spreading in two of the country’s largest medical economies, not in a blank spot on the hospital map.
Health-care service spending in Pennsylvania and New York

View exact chart values
| year | pa_health_bil | ny_health_bil | pa_pcap | ny_pcap | us_pcap | pa_food_pcap | us_food_pcap | pa_hosp_jobs_thous | ny_hosp_jobs_thous |
|---|---|---|---|---|---|---|---|---|---|
| 2010 | 78.62 | 123.08 | 6182 | 6338 | 5493 | 2606 | 2543 | 265.3 | 347.8 |
| 2011 | 81.97 | 125.9 | 6418 | 6423 | 5635 | 2651 | 2628 | 267.3 | 350.3 |
| 2012 | 84.01 | 128.08 | 6555 | 6482 | 5794 | 2715 | 2692 | 271 | 353.8 |
| 2013 | 85.72 | 132.44 | 6672 | 6658 | 5884 | 2750 | 2749 | 272.1 | 356.2 |
| 2014 | 88.43 | 138.24 | 6866 | 6912 | 6094 | 2822 | 2852 | 270.4 | 355.8 |
| 2015 | 92.4 | 142.99 | 7163 | 7118 | 6400 | 2885 | 2927 | 268.3 | 357.5 |
| 2016 | 96.33 | 151.79 | 7456 | 7534 | 6674 | 2944 | 2989 | 268.4 | 367 |
| 2017 | 98.77 | 158.45 | 7630 | 7849 | 6875 | 3023 | 3094 | 271.6 | 374.3 |
| 2018 | 104.84 | 167.32 | 8077 | 8275 | 7137 | 3083 | 3179 | 273.6 | 378.9 |
| 2019 | 107.98 | 180.47 | 8311 | 8925 | 7487 | 3176 | 3280 | 274.5 | 386.3 |
| 2020 | 102.16 | 175.33 | 7861 | 8713 | 7100 | 3440 | 3624 | 268.3 | 382.5 |
| 2021 | 110.63 | 191.76 | 8499 | 9668 | 7956 | 3688 | 3889 | 263.4 | 376.6 |
| 2022 | 117.5 | 202.38 | 9049 | 10266 | 8438 | 4061 | 4174 | 263.4 | 373.3 |
| 2023 | 124.81 | 222.48 | 9594 | 11244 | 9098 | 4165 | 4271 | 270.6 | 387.4 |
| 2024 | 134.54 | 243.89 | 10313 | 12194 | 9786 | 4258 | 4349 | 278.1 | 400 |
| 2025 | 142.6 | 261.85 | 10919 | 13091 | 10442 | 4378 | 4459 | 280.7 | 408.5 |
Per person, New York is the expensive one
Divide those bills by population and the picture sharpens. Pennsylvanians spent $10,919 per person on health-care services in 2025, 4.6 percent above the U.S. figure of $10,442. New Yorkers spent $13,091, a quarter above the national average. Among a comparison set that includes Texas, Florida, Ohio, Wisconsin, New Jersey and California — outbreak neighbours plus the country’s biggest states, not a full 50-state ranking — New York sits at the top and Texas at the bottom.
That ranking is not a measles league table. Texas’s lower per-person service bill does not mean Texans are healthier, and New York’s higher bill does not mean New Yorkers are over-doctored. It does mean that if measles were mainly a story about missing clinics, you would not expect it to concentrate in states that already spend at or above the national average. Wisconsin, which has also reported local measles spread this year, spent $10,920 per person — a dollar from Pennsylvania.
New Yorkers spend the most per person on health-care services among these states

View exact chart values
| state | per_capita |
|---|---|
| Texas | 8294 |
| United States | 10442 |
| Florida | 10574 |
| Ohio | 10900 |
| Pennsylvania | 10919 |
| Wisconsin | 10920 |
| New Jersey | 11278 |
| California | 11681 |
| New York | 13091 |
The grocery cart did not catch the clinic
Health-care services in Pennsylvania ran 2.49 times grocery spending in 2025; in New York the multiple was 2.98; nationwide it was 2.34. Groceries here are food and beverages bought for use at home, including alcohol and farm food, not restaurant meals. From 2010 to 2025, Pennsylvania’s per-person health-care service bill rose 76.6 percent in current dollars. The grocery bill rose 68 percent. The U.S. health-care service bill rose faster still, 90.1 percent per person.
Index the same series to 2010 and the pandemic shows up as a kink, not a regime change. Pennsylvania health-care spending per person dipped in 2020, then climbed to 176.6 on a 2010=100 scale by 2025. Groceries jumped during the lockdown year, when people cooked at home, and finished at 168. The U.S. health-care index reached 190. None of those lines is inflation-adjusted, so some of the rise is prices. The comparison still holds: the clinic bill is larger than the grocery bill, and it has been for the entire period in these books.
Pennsylvania health-care bills outran groceries — after a pandemic pause

View exact chart values
| year | health_index | food_index | us_health_index |
|---|---|---|---|
| 2010 | 100 | 100 | 100 |
| 2011 | 103.8 | 101.7 | 102.6 |
| 2012 | 106 | 104.2 | 105.5 |
| 2013 | 107.9 | 105.5 | 107.1 |
| 2014 | 111.1 | 108.3 | 110.9 |
| 2015 | 115.9 | 110.7 | 116.5 |
| 2016 | 120.6 | 113 | 121.5 |
| 2017 | 123.4 | 116 | 125.2 |
| 2018 | 130.7 | 118.3 | 129.9 |
| 2019 | 134.4 | 121.9 | 136.3 |
| 2020 | 127.2 | 132 | 129.3 |
| 2021 | 137.5 | 141.5 | 144.8 |
| 2022 | 146.4 | 155.8 | 153.6 |
| 2023 | 155.2 | 159.8 | 165.6 |
| 2024 | 166.8 | 163.4 | 178.2 |
| 2025 | 176.6 | 168 | 190.1 |
Jobs grew around hospitals more than inside them
The payroll files tell a more interesting story than the dollar totals. Seasonally adjusted health care and social assistance employment in Pennsylvania reached 1,170,400 in August 2026, 29.5 percent above August 2010, while all nonfarm jobs rose 10.1 percent. New York’s health-care and social-assistance payroll hit 1,921,700, up 48.8 percent, against 16.6 percent growth in total jobs. Those categories are 18.9 percent of Pennsylvania’s nonfarm employment and 19.3 percent of New York’s, up from 16.0 and 15.1 percent in August 2010, according to BLS State and Area Employment.
Hospital jobs are the narrower slice, and they barely moved in Pennsylvania. Annual, not-seasonally-adjusted hospital employment there was 280,700 in 2025, only 5.8 percent above 2010. New York’s hospital payroll reached 408,500, up 17.5 percent. The growth in “health care and social assistance” is therefore not mostly extra hospital beds. It is clinics, home care, social assistance and the rest of the sector filling in around a hospital workforce that, in Pennsylvania, looks almost stuck.
Split Pennsylvania’s 2025 dollars the same way and you see the same tilt. Outpatient services accounted for $66 billion, hospital services $61.5 billion, and a residual that corresponds to nursing homes $15.1 billion. Add pharmaceutical products ($34.4 billion) and net health insurance for medical care ($11.7 billion) — separate PCE lines, not part of the $142.6 billion services total — and the constructed household health bill reaches about $189 billion. That addition is a reader’s convenience, not an official BEA aggregate. It still leaves measles looking like a failure of shots, not of spending.
Health-care jobs keep taking a larger slice of both states’ payrolls

View exact chart values
| year | pa_hcsa | ny_hcsa | pa_share | ny_share |
|---|---|---|---|---|
| 2010 | 903.5 | 1291.7 | 16.02 | 15.14 |
| 2011 | 916.3 | 1310.1 | 16.12 | 15.07 |
| 2012 | 930.9 | 1329.6 | 16.28 | 15.08 |
| 2013 | 935.5 | 1349.5 | 16.29 | 15.06 |
| 2014 | 951.3 | 1384.5 | 16.41 | 15.12 |
| 2015 | 962.3 | 1414.5 | 16.46 | 15.18 |
| 2016 | 986.7 | 1466.9 | 16.76 | 15.51 |
| 2017 | 1013.6 | 1514.2 | 17.04 | 15.81 |
| 2018 | 1039.8 | 1574.1 | 17.28 | 16.22 |
| 2019 | 1062.9 | 1636.1 | 17.48 | 16.72 |
| 2020 | 1008.1 | 1533.9 | 18.16 | 17.88 |
| 2021 | 1009.5 | 1583.2 | 17.43 | 17.42 |
| 2022 | 1037.6 | 1652.9 | 17.26 | 17.24 |
| 2023 | 1081.7 | 1744 | 17.74 | 17.91 |
| 2024 | 1127.1 | 1847.7 | 18.34 | 18.69 |
| 2025 | 1155 | 1892.2 | 18.71 | 19.02 |
| 2026 | 1170.4 | 1921.7 | 18.86 | 19.32 |
Where Pennsylvania’s 2025 health bill actually sits

View exact chart values
| category | billions |
|---|---|
| Hospital services | 61.5 |
| Outpatient services | 66 |
| Nursing homes (residual) | 15.1 |
| Pharmaceutical products | 34.4 |
| Net health insurance | 11.7 |
What these books cannot say
None of this measures vaccination. The BEA does not publish a measles line, and the BLS does not count epidemiologists as a separate statewide series in the files used here. Lancaster County’s 88 percent kindergarten MMR rate, cited in the outbreak reporting, lives in school-immunization data that are not in this catalogue. A large hospital payroll cannot substitute for two doses of MMR in a community that has not historically taken them.
The vintage matters. Consumer spending is annual through 2025; the latest jobs snapshot is August 2026. Hospital employment is an annual, not-seasonally-adjusted series through 2025. Health-care services exclude prescription drugs. Per-person figures are official BEA per capita spending, not household averages cooked from the aggregates. Comparison states were chosen because they are large or because they appear in this week’s measles reporting — not because they exhaust the map.
The reader payoff is unsentimental. Pennsylvania and New York are not struggling to find a health-care industry. They are struggling to keep a disease that should be a historical footnote from moving through communities that mix, shop and share schools with everyone else. The books show a fat, growing medical sector. The case counts show what that sector cannot buy if the shots do not go in.
Sources and methods
BEA state personal consumption expenditures (SAPCE) are annual current-dollar estimates through calendar 2025 from the 30 September 2026 regional release. Observation years are not the research edition date of 2 November 2026.
Health-care services (SAPCE3 line for outpatient plus hospital and nursing-home care) exclude pharmaceutical products, which are goods, and net health insurance, which sits in the financial-services function table. Combining those lines is a constructed total, disclosed as such.
Nursing-home dollars in the Pennsylvania composition chart are a residual: health-care services minus hospitals minus outpatient services. Residuals inherit any classification noise in the components.
Per-person figures are official BEA per capita PCE, not household means derived from aggregates. The state comparison set is outbreak-adjacent and large states plus the United States, not a complete ranking.
BLS State and Area Employment health care and social assistance and total nonfarm series are seasonally adjusted monthly statewide figures through August 2026 (snapshot 24 August 2026). August-to-August comparisons avoid seasonal mixing. Hospital employment is a narrower annual, not-seasonally-adjusted series through 2025.
No series in these extracts measures measles incidence or vaccination coverage. Descriptive spending and payroll comparisons are not causal claims about the outbreak.
Research completed 2026-11-03, for the November 2, 2026 news edition. The available source data may cover earlier periods; see the observation periods and source vintages above.