Research
Massachusetts never got its jobs back
The August drop is later than the official books
Massachusetts lost 7,100 jobs in August, according to state labor figures reported Monday, almost wiping out a year’s gains and handing Republicans a talking point six weeks from Election Day. The state’s own economist, Mark Rembert, pointed to relatively low unemployment among workers aged 25 to 54 compared with Texas, New Jersey, New York and California. That is a household survey talking about joblessness. The question the payroll survey can answer is cruder and, for a governor, ruder: has Massachusetts actually been adding jobs?
The Bureau of Labor Statistics snapshot available here ends in July 2026, one month before that August print, and it is seasonally adjusted. It does not show a sudden stall. It shows a state that never quite recaptured the jobs it had on the eve of the pandemic. Massachusetts nonfarm payrolls were 3.713 million in July 2026, up only 5,800, or 0.16 percent, from a year earlier — slower than the United States (0.20 percent), New York (0.21 percent), Florida (0.41 percent), California (0.63 percent) and Texas (1.16 percent). New Jersey actually shrank over the year. The Bay State’s year-to-date gain from December 2025 was 6,800 jobs. July itself was down 4,600 from June. The August loss reported locally is a later observation, not a contradiction of this file.
Payrolls still below the 2020 peak in Massachusetts

View exact chart values
| month | Massachusetts | New York | New Jersey | Texas | California | Florida | United States |
|---|---|---|---|---|---|---|---|
| 2019-01 | 98.33 | 99.21 | 99.11 | 97.86 | 98.07 | 97.94 | 98.53 |
| 2019-02 | 98.53 | 99.28 | 99.1 | 98.12 | 98.14 | 98.16 | 98.54 |
| 2019-03 | 98.65 | 99.43 | 99.23 | 98.21 | 98.27 | 98.3 | 98.69 |
| 2019-04 | 99.05 | 99.55 | 99.31 | 98.42 | 98.3 | 98.39 | 98.88 |
| 2019-05 | 99.15 | 99.55 | 99.25 | 98.66 | 98.44 | 98.45 | 98.9 |
| 2019-06 | 99.26 | 99.63 | 99.42 | 98.86 | 98.65 | 98.6 | 99.04 |
| 2019-07 | 99.13 | 99.49 | 99.55 | 99.04 | 98.7 | 98.74 | 99.11 |
| 2019-08 | 99.18 | 99.49 | 99.43 | 99.26 | 98.89 | 99.04 | 99.26 |
| 2019-09 | 99.27 | 99.68 | 99.43 | 99.38 | 98.96 | 98.98 | 99.39 |
| 2019-10 | 99.29 | 99.58 | 99.48 | 99.4 | 99.08 | 99.36 | 99.45 |
| 2019-11 | 99.41 | 99.75 | 99.77 | 99.67 | 99.43 | 99.62 | 99.59 |
| 2019-12 | 99.63 | 99.73 | 99.69 | 99.7 | 99.52 | 99.82 | 99.67 |
| 2020-01 | 99.72 | 99.93 | 99.86 | 99.87 | 99.87 | 99.9 | 99.83 |
| 2020-02 | 100 | 100 | 100 | 100 | 100 | 100 | 100 |
| 2020-03 | 99 | 98.84 | 99.3 | 99.59 | 99 | 99.34 | 99.08 |
| 2020-04 | 81.6 | 79.85 | 82.87 | 88.84 | 84.49 | 85.92 | 85.64 |
| 2020-05 | 83.05 | 81.45 | 83.21 | 90.71 | 85.55 | 88.56 | 87.36 |
| 2020-06 | 85.1 | 83.89 | 84.64 | 92.52 | 88.49 | 91.72 | 90.4 |
| 2020-07 | 87.42 | 85.08 | 87.69 | 92.54 | 88.72 | 92.18 | 91.44 |
| 2020-08 | 89.05 | 87.19 | 89.46 | 93.39 | 89.25 | 92.63 | 92.47 |
| 2020-09 | 90.31 | 89.26 | 91.58 | 93.96 | 90.11 | 93.34 | 93.09 |
| 2020-10 | 91.16 | 89.94 | 92.31 | 94.64 | 91.26 | 94.17 | 93.54 |
| 2020-11 | 91.6 | 90.06 | 92.42 | 95 | 91.65 | 94.56 | 93.72 |
| 2020-12 | 91.52 | 89.77 | 92.52 | 95.39 | 91.19 | 95.01 | 93.6 |
| 2021-01 | 91.9 | 89.77 | 93.15 | 95.72 | 90.63 | 95.48 | 93.81 |
| 2021-02 | 92.26 | 90.03 | 93.29 | 95.41 | 91.78 | 95.89 | 94.15 |
| 2021-03 | 92.69 | 90.6 | 93.68 | 96.39 | 92.54 | 96.44 | 94.71 |
| 2021-04 | 93.29 | 91.05 | 94.28 | 96.78 | 93.42 | 96.51 | 94.94 |
| 2021-05 | 93.54 | 91.26 | 94.55 | 97.22 | 94.05 | 97.22 | 95.25 |
| 2021-06 | 93.88 | 91.47 | 94.77 | 97.75 | 94.45 | 97.81 | 95.75 |
| 2021-07 | 94.96 | 92.15 | 95.87 | 98.65 | 95.57 | 98.77 | 96.37 |
| 2021-08 | 95.22 | 92.37 | 96.04 | 98.85 | 96.1 | 98.99 | 96.73 |
| 2021-09 | 95.07 | 93.05 | 96.4 | 99.3 | 96.07 | 99.52 | 97.03 |
| 2021-10 | 95.98 | 94.32 | 97.78 | 100.41 | 97.46 | 100.56 | 97.56 |
| 2021-11 | 96.27 | 94.71 | 98.16 | 100.82 | 97.83 | 100.97 | 97.99 |
| 2021-12 | 96.55 | 95.13 | 98.66 | 101.38 | 98.22 | 101.32 | 98.37 |
| 2022-01 | 96.75 | 94.97 | 98.7 | 101.37 | 98.26 | 101.5 | 98.5 |
| 2022-02 | 97.3 | 95.69 | 99.6 | 102.11 | 99.05 | 102.15 | 99.04 |
| 2022-03 | 97.44 | 95.9 | 99.83 | 102.4 | 99.42 | 102.36 | 99.36 |
| 2022-04 | 97.84 | 95.97 | 100 | 103.1 | 99.75 | 103.08 | 99.56 |
| 2022-05 | 97.78 | 96.24 | 100.11 | 103.39 | 99.89 | 103.46 | 99.76 |
| 2022-06 | 98.06 | 96.55 | 100.06 | 103.61 | 100.16 | 103.64 | 100.04 |
| 2022-07 | 98.48 | 97.25 | 100.84 | 104.54 | 100.44 | 104.46 | 100.51 |
| 2022-08 | 98.52 | 97.48 | 101.02 | 104.91 | 100.65 | 104.81 | 100.7 |
| 2022-09 | 98.6 | 97.45 | 100.95 | 105.3 | 100.74 | 105.29 | 100.85 |
| 2022-10 | 98.43 | 97.62 | 100.97 | 105.51 | 100.67 | 105.24 | 101.08 |
| 2022-11 | 98.65 | 97.76 | 101.23 | 105.72 | 100.76 | 105.32 | 101.28 |
| 2022-12 | 98.51 | 97.73 | 101.32 | 105.89 | 100.81 | 105.7 | 101.35 |
| 2023-01 | 98.97 | 98.13 | 101.74 | 106.46 | 100.54 | 106.19 | 101.63 |
| 2023-02 | 99.01 | 98.17 | 101.81 | 106.63 | 100.69 | 106.4 | 101.82 |
| 2023-03 | 99.1 | 98.26 | 101.85 | 106.9 | 100.64 | 106.66 | 101.87 |
| 2023-04 | 98.93 | 98.25 | 101.49 | 106.95 | 100.58 | 106.95 | 102.02 |
| 2023-05 | 99.01 | 98.59 | 102.03 | 107.16 | 100.9 | 107.24 | 102.21 |
| 2023-06 | 99.17 | 98.92 | 102.3 | 107.63 | 101.06 | 107.67 | 102.36 |
| 2023-07 | 99.22 | 98.93 | 102.18 | 107.43 | 100.81 | 107.66 | 102.46 |
| 2023-08 | 99.32 | 98.98 | 102.35 | 107.67 | 100.99 | 107.82 | 102.61 |
| 2023-09 | 99.33 | 99.11 | 102.66 | 107.94 | 101.24 | 108.15 | 102.71 |
| 2023-10 | 99.33 | 99.11 | 102.43 | 107.97 | 101.04 | 108.41 | 102.81 |
| 2023-11 | 99.3 | 99.17 | 102.57 | 108.06 | 101.12 | 108.48 | 102.9 |
| 2023-12 | 99.5 | 99.47 | 102.78 | 108.23 | 101.41 | 108.65 | 103 |
| 2024-01 | 99.45 | 99.58 | 102.72 | 108.43 | 102.07 | 108.82 | 103.11 |
| 2024-02 | 99.44 | 99.71 | 102.85 | 108.58 | 101.67 | 108.94 | 103.25 |
| 2024-03 | 99.63 | 100 | 102.97 | 108.73 | 101.74 | 109.14 | 103.4 |
| 2024-04 | 99.37 | 100.29 | 102.93 | 108.8 | 101.56 | 109.25 | 103.44 |
| 2024-05 | 99.56 | 100.42 | 102.98 | 109.02 | 101.54 | 109.34 | 103.49 |
| 2024-06 | 99.73 | 100.72 | 103.18 | 109.22 | 101.52 | 109.39 | 103.55 |
| 2024-07 | 99.47 | 100.44 | 102.91 | 108.92 | 101.63 | 109.48 | 103.58 |
| 2024-08 | 99.49 | 100.5 | 102.97 | 109.47 | 101.72 | 109.65 | 103.59 |
| 2024-09 | 99.49 | 100.86 | 103.32 | 109.62 | 101.86 | 109.94 | 103.69 |
| 2024-10 | 99.47 | 100.8 | 103.4 | 109.74 | 102.22 | 108.73 | 103.71 |
| 2024-11 | 99.39 | 100.94 | 103.44 | 109.9 | 102.2 | 109.81 | 103.8 |
| 2024-12 | 99.39 | 101.07 | 103.55 | 110.04 | 101.95 | 109.86 | 103.95 |
| 2025-01 | 99.39 | 101.26 | 103.52 | 110.1 | 102.06 | 110.04 | 103.92 |
| 2025-02 | 99.24 | 101.33 | 103.6 | 110.21 | 101.94 | 110.15 | 103.95 |
| 2025-03 | 99.17 | 101.51 | 103.6 | 110.25 | 101.97 | 110.26 | 103.99 |
| 2025-04 | 99.17 | 100.97 | 103.68 | 110.45 | 102.25 | 110.28 | 104.07 |
| 2025-05 | 99.16 | 101.18 | 103.93 | 110.52 | 102.28 | 110.23 | 104.07 |
| 2025-06 | 98.81 | 101.13 | 103.64 | 110.29 | 102.13 | 110.12 | 104.06 |
| 2025-07 | 98.95 | 101.04 | 103.6 | 110.37 | 102.04 | 110.05 | 104.1 |
| 2025-08 | 98.71 | 101.1 | 103.41 | 110.43 | 102.14 | 110.01 | 104.06 |
| 2025-09 | 98.63 | 101.16 | 103.51 | 110.41 | 102.05 | 109.93 | 104.11 |
| 2025-10 | 98.8 | 101.1 | 103.51 | 110.33 | 102.06 | 109.46 | 104.02 |
| 2025-11 | 98.81 | 101.21 | 103.55 | 110.41 | 102.25 | 109.51 | 104.04 |
| 2025-12 | 98.93 | 101.48 | 103.67 | 110.66 | 102.27 | 109.58 | 104.03 |
| 2026-01 | 98.98 | 101.65 | 103.76 | 110.84 | 102.74 | 109.73 | 104.14 |
| 2026-02 | 98.79 | 101.41 | 103.56 | 110.79 | 102.63 | 109.7 | 104.03 |
| 2026-03 | 98.98 | 101.43 | 103.64 | 111.08 | 102.84 | 110 | 104.17 |
| 2026-04 | 99.18 | 101.42 | 103.8 | 111.14 | 102.84 | 110.38 | 104.27 |
| 2026-05 | 99.07 | 101.59 | 103.84 | 111.33 | 102.75 | 110.33 | 104.31 |
| 2026-06 | 99.23 | 101.47 | 103.74 | 111.64 | 102.79 | 110.45 | 104.33 |
| 2026-07 | 99.11 | 101.25 | 103.13 | 111.65 | 102.67 | 110.5 | 104.31 |
The missing 33,000
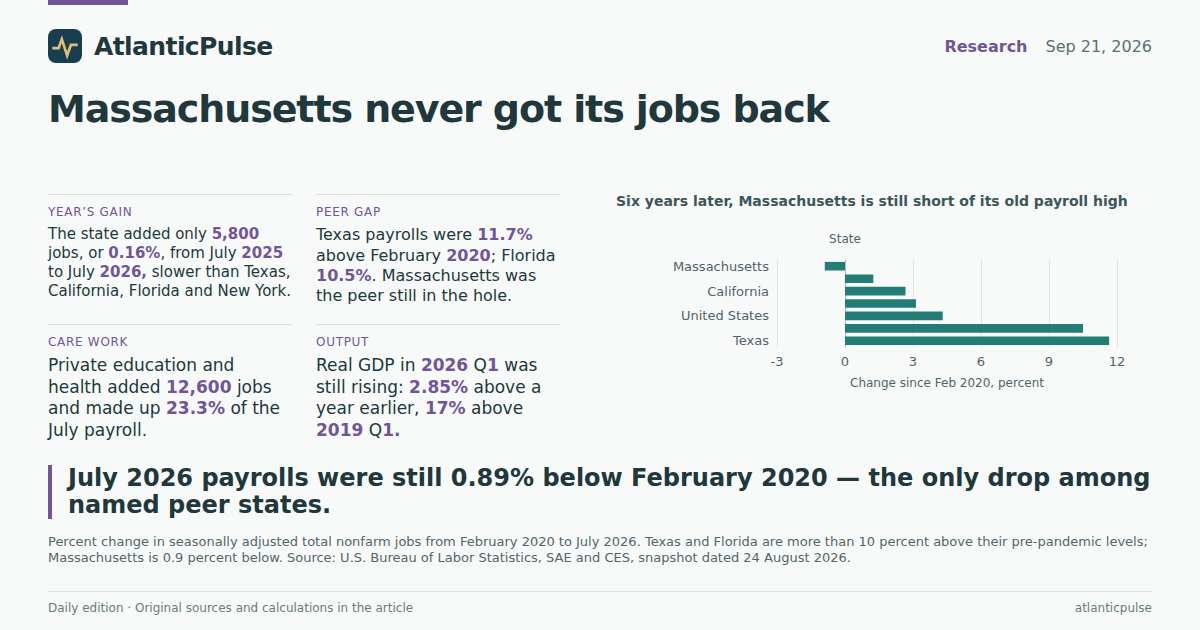
Index the same series to February 2020 and Massachusetts is the outlier among the states Rembert named. Texas payrolls in July 2026 were 11.7 percent above that pre-pandemic month. Florida was 10.5 percent higher. The United States was up 4.3 percent, New Jersey 3.1 percent, California 2.7 percent and New York 1.3 percent. Massachusetts was 0.89 percent below — about 33,000 jobs short of 3.746 million. Against July 2019, seven years earlier, the count is essentially unchanged: 3.713 million then, 3.713 million now.
That is not a one-month story. The index sat under 100 for the entire stretch from March 2020 through July 2026. Other large states dipped in the lockdown spring and then climbed through it. Massachusetts recovered some of the 652,000 jobs it lost in April 2020 and then flattened. By 2024 and 2025 the monthly changes were already oscillating around zero. If Healey’s critics wanted a chart that does not depend on August, this is it: the Bay State’s payroll recovery ended early, and it ended short.
Six years later, Massachusetts is still short of its old payroll high

View exact chart values
| state | vs_feb2020_pct | jul2026 | feb2020 |
|---|---|---|---|
| Texas | 11.65 | 14468 | 12958.1 |
| Florida | 10.5 | 10037.3 | 9083.6 |
| United States | 4.31 | 158858 | 152293 |
| New Jersey | 3.13 | 4357.6 | 4225.3 |
| California | 2.67 | 18133 | 17660.9 |
| New York | 1.25 | 9960.7 | 9837.9 |
| Massachusetts | -0.89 | 3712.5 | 3745.9 |
One industry is carrying the rest
The industry mix explains how a state can feel busy and still not add jobs. Private education and health services — hospitals, colleges, home care — added 12,600 jobs from July 2025 to July 2026 and accounted for 23.3 percent of the July 2026 payroll. Construction added 3,300, manufacturing 2,200, professional and business services 2,200 and government 900. Everything else leaked. Trade, transportation and utilities lost 5,700 jobs over the year. Financial activities lost 3,700, information 3,500, leisure and hospitality 2,100. Supersectors do not sum exactly to the total, because mining and logging sit in a thin leftover, but the shape is not subtle: care work expanded, offices and shops did not.
Relative to February 2020 the holes are older. Information payrolls were still 9.5 percent below that month. Manufacturing was 6.1 percent lower, leisure 5.9 percent lower, trade 4.5 percent lower. Professional and business services, the sector that ate August’s state-reported losses, was only 0.7 percent above its pre-pandemic level in July, after a 2022 peak. Nationally, the same sector in the Current Employment Statistics was 4.8 percent above February 2020. Massachusetts did not merely miss a boom. Its white-collar engine cooled earlier and harder than the country’s.
Health care is hiring. The rest of the Bay State is not

View exact chart values
| industry | jul2019 | feb2020 | jul2025 | dec2025 | jul2026 | yoy_thousands | yoy_pct | ytd_thousands | vs_feb2020_pct |
|---|---|---|---|---|---|---|---|---|---|
| Trade, transportation, and utilities | 581.5 | 581.7 | 561.4 | 561.2 | 555.7 | -5.7 | -1.02 | -5.5 | -4.47 |
| Financial activities | 227.3 | 226.8 | 223.8 | 223 | 220.1 | -3.7 | -1.65 | -2.9 | -2.95 |
| Information | 95.7 | 95.6 | 90 | 88.7 | 86.5 | -3.5 | -3.89 | -2.2 | -9.52 |
| Leisure and hospitality | 379.7 | 384.8 | 364.1 | 369.4 | 362 | -2.1 | -0.58 | -7.4 | -5.93 |
| Other services | 140.3 | 141.8 | 139.6 | 138.6 | 139.1 | -0.5 | -0.36 | 0.5 | -1.9 |
| Government | 457.5 | 466 | 474.5 | 472.3 | 475.4 | 0.9 | 0.19 | 3.1 | 2.02 |
| Professional and business services | 604.8 | 607.3 | 609.2 | 607.7 | 611.4 | 2.2 | 0.36 | 3.7 | 0.68 |
| Manufacturing | 244.3 | 242.9 | 225.9 | 227.3 | 228.1 | 2.2 | 0.97 | 0.8 | -6.09 |
| Construction | 163.1 | 165.9 | 166 | 165.2 | 169.3 | 3.3 | 1.99 | 4.1 | 2.05 |
| Private education and health | 818.2 | 832.1 | 851.2 | 851.2 | 863.8 | 12.6 | 1.48 | 12.6 | 3.81 |
The output books kept climbing
Jobs are not the whole economy. Bureau of Economic Analysis quarterly accounts, which run through 2026 Q1, show Massachusetts real GDP at a $654 billion seasonally adjusted annual rate in chained 2017 dollars, up 2.85 percent from a year earlier and 17 percent above 2019 Q1. That is slower than California (3.32 percent year over year) and Texas (3.27 percent), faster than New York, Florida and New Jersey. Output in the Bay State did not stall. Payrolls did. Every peer state in this set added more real GDP than jobs over those mismatched windows; Massachusetts simply ran the gap at the extreme, pairing 2.9 percent output growth with 0.16 percent payroll growth.
That pattern is what a high-wage, high-education economy looks like when it substitutes hours, prices and mix for headcount — or when firms keep revenue while they stop hiring. The data cannot say which. They can say the political fight over “scarce job growth” is not an August hallucination. Through July 2026, on the official seasonally adjusted books, Massachusetts had not recovered its February 2020 payroll, had barely moved in a year, and was leaning on education and health to keep the total from falling. The August print, when the BLS file catches up, will be a revision to that sentence, not a new one.
Output kept rising while the job count stalled

View exact chart values
| quarter | real_gdp_millions_chained_2017 |
|---|---|
| 2019Q1 | 559139.1 |
| 2019Q2 | 562866.6 |
| 2019Q3 | 569870.3 |
| 2019Q4 | 573431.2 |
| 2020Q1 | 573469.4 |
| 2020Q2 | 526485.9 |
| 2020Q3 | 564617 |
| 2020Q4 | 577010.9 |
| 2021Q1 | 581795 |
| 2021Q2 | 594783.2 |
| 2021Q3 | 604845.1 |
| 2021Q4 | 608256.7 |
| 2022Q1 | 603109.6 |
| 2022Q2 | 605391.1 |
| 2022Q3 | 604341.1 |
| 2022Q4 | 617040.7 |
| 2023Q1 | 609329.1 |
| 2023Q2 | 611693 |
| 2023Q3 | 616341.5 |
| 2023Q4 | 621780.9 |
| 2024Q1 | 623365.8 |
| 2024Q2 | 629680.6 |
| 2024Q3 | 632839.7 |
| 2024Q4 | 629261.6 |
| 2025Q1 | 635775.7 |
| 2025Q2 | 642813.7 |
| 2025Q3 | 648082.1 |
| 2025Q4 | 650043.7 |
| 2026Q1 | 653909.8 |
Jobs lagged output in every peer state — Massachusetts most of all

View exact chart values
| state | payroll_yoy_pct | gdp_q1_yoy_pct |
|---|---|---|
| Massachusetts | 0.16 | 2.85 |
| New York | 0.21 | 2.54 |
| New Jersey | -0.45 | 1.98 |
| Texas | 1.16 | 3.27 |
| California | 0.63 | 3.32 |
| Florida | 0.41 | 2.39 |
Sources and methods
Payroll figures are seasonally adjusted total nonfarm employment from the BLS State and Area Employment program (state series) and Current Employment Statistics (U.S. total), from a 24 August 2026 snapshot whose latest month is July 2026. They are in thousands of jobs. August 2026 Massachusetts losses reported in the day’s news come from a later state release and are not in this file.
Industry detail uses SAE supersectors. They do not sum exactly to total nonfarm. Private education and health is the SAE education-and-health supersector (private). Mining and logging is omitted as a thin residual.
Indexes use February 2020 as 100. Percent changes compare July 2019, February 2020, July 2025, September 2025, December 2025 and July 2026. Missing is not treated as zero. No duplicate observations were dropped because none appeared.
Real GDP is BEA quarterly state GDP, all-industry total, millions of chained 2017 dollars at a seasonally adjusted annual rate, 25 June 2026 release through 2026 Q1. Annual 2025 GDP is a separate vintage and was not mixed into the quarterly comparisons.
Payroll growth (through July 2026) and GDP growth (through 2026 Q1) are different windows and do not imply a causal productivity story. SAE and CES are establishment surveys, not the household unemployment rates Massachusetts officials cited for ages 25 to 54.
Research completed 2026-09-22, for the September 21, 2026 news edition. The available source data may cover earlier periods; see the observation periods and source vintages above.