Research
Louisiana’s $100 billion spaceport, measured against the economy already there
A pledge the size of a small state
SpaceX’s Louisiana announcement is designed to sound planetary. The company says it will spend $100 billion on Starbase Louisiana, a 125,000-acre complex on Pecan Island in Vermilion Parish, with construction aimed at 2027 and a first launch as early as 2029. Elon Musk has talked about more than a dozen launch towers and more than 30 Starship flights a day. Louisiana officials, not to be outdone, call it potentially the world’s largest spaceport and tally more than 3,000 direct jobs at an average $92,600, plus about 8,100 indirect jobs.
Those are marketing numbers. The books already on the shelf are smaller, slower, and a lot less sci-fi. In 2025, Louisiana’s current-dollar gross domestic product was $340.1 billion, according to the Bureau of Economic Analysis. Texas, where SpaceX already launches, produced $2.90 trillion. The United States produced $30.76 trillion. Louisiana was 1.1 percent of national output; Texas was 9.4 percent. A $100 billion capital pledge is not a year’s GDP, and it will not land in one fiscal year even if every pad is poured on schedule. It is still equal to 29 percent of everything Louisiana produced in 2025, and only 3.4 percent of Texas.
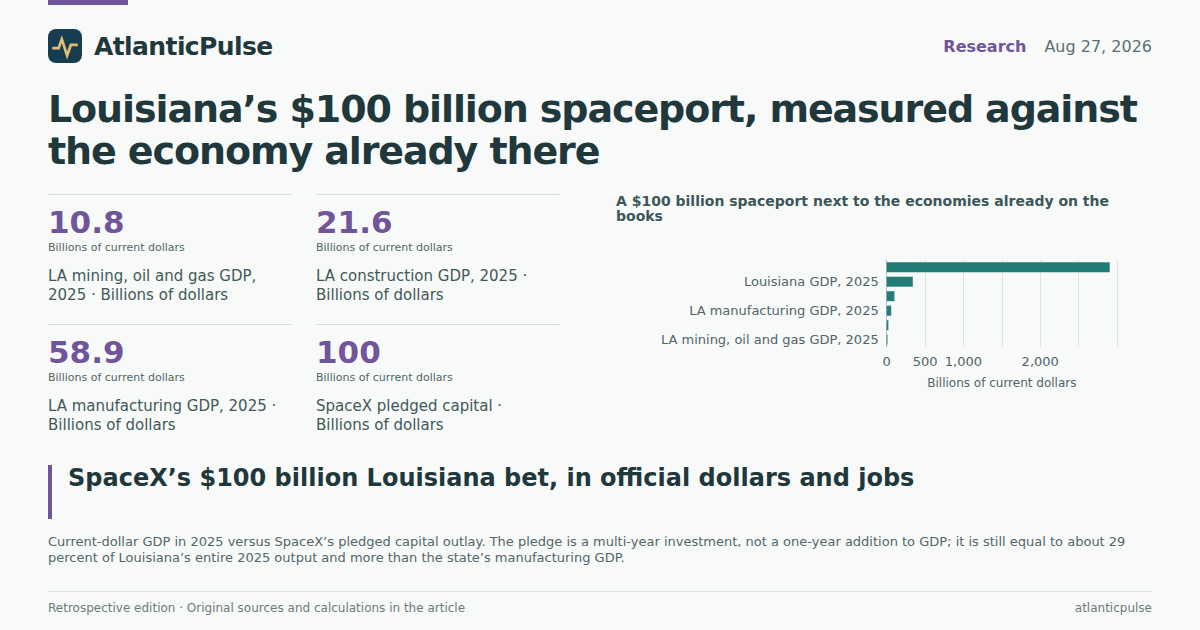
Put another way, the promised outlay is larger than Louisiana’s entire manufacturing sector ($58.9 billion in 2025) and larger than Mississippi’s whole economy ($165.1 billion). It is in the same neighborhood as Alabama ($341.2 billion). Florida, the other big Gulf state, is in another league at $1.83 trillion. The useful comparison is not Baikonur’s acreage. It is whether a $100 billion IOU is landing in an economy that has room to absorb it, or in one that has been jogging in place.
A $100 billion spaceport next to the economies already on the books

View exact chart values
| item | billions |
|---|---|
| LA mining, oil and gas GDP, 2025 | 10.8 |
| LA construction GDP, 2025 | 21.6 |
| LA manufacturing GDP, 2025 | 58.9 |
| SpaceX pledged capital | 100 |
| Louisiana GDP, 2025 | 340.1 |
| Texas GDP, 2025 | 2904.4 |
The real economy barely moved
Nominal dollars flatter Louisiana because oil, gas and refined products swing with prices. Inflation-adjusted GDP tells a colder story. From 2000 to 2025, Louisiana’s real output rose 26 percent. The United States rose 69 percent. Texas rose 130 percent. Since 2015 — a fairer recent baseline — Louisiana is up 8.5 percent in real terms. Texas is up 39 percent. The country is up 27 percent.
The quarterly figures are not a boom either, just a late catch-up. Louisiana’s seasonally adjusted annual-rate GDP was $354 billion in the first quarter of 2026, up from the mid-$300 billions through 2024. That is real money. It is not a trajectory that makes a $100 billion campus look like the next increment in an already-steep climb. Population barely helped. Louisiana had 4.47 million residents in 2000 and 4.62 million in 2025, a 3.3 percent rise over a quarter-century in which Texas was busy adding metros.
None of that means the spaceport cannot be built. It means the state is not arriving at this announcement on a tear. The last time Louisiana’s real GDP jumped around, energy prices were doing the jumping. A launch complex that takes years to permit, years to pour, and years to staff will be measured against that sluggish baseline, not against Musk’s daily-flight arithmetic.
Louisiana’s real economy has lagged Texas and the U.S. since 2015

View exact chart values
| year | louisiana | texas | united_states |
|---|---|---|---|
| 2000 | 86.2 | 60.6 | 75 |
| 2001 | 87.9 | 62.5 | 75.7 |
| 2002 | 89.7 | 63.8 | 77 |
| 2003 | 93.3 | 64.4 | 79.1 |
| 2004 | 97.9 | 68 | 82.2 |
| 2005 | 104.2 | 70 | 85 |
| 2006 | 103.2 | 75 | 87.4 |
| 2007 | 97.8 | 78.9 | 89.2 |
| 2008 | 98.9 | 78.8 | 89.3 |
| 2009 | 101 | 78.7 | 87 |
| 2010 | 105.8 | 81 | 89.3 |
| 2011 | 100.7 | 83.8 | 90.7 |
| 2012 | 101.2 | 88 | 92.8 |
| 2013 | 98.7 | 92.5 | 94.7 |
| 2014 | 101.4 | 95.4 | 97.1 |
| 2015 | 100 | 100 | 100 |
| 2016 | 98.3 | 100 | 101.8 |
| 2017 | 100.1 | 102 | 104.3 |
| 2018 | 102.4 | 106.9 | 107.4 |
| 2019 | 103 | 110.6 | 110.2 |
| 2020 | 94.2 | 109.1 | 107.9 |
| 2021 | 101.3 | 116.6 | 114.5 |
| 2022 | 100.2 | 120.9 | 117.4 |
| 2023 | 103.9 | 130.8 | 120.9 |
| 2024 | 107.3 | 136 | 124.2 |
| 2025 | 108.5 | 139.4 | 126.9 |
The jobs are already there. They just are not Starship jobs.
Louisiana does not lack a workforce so much as it lacks a fast-growing one. In July 2026 the state had 2.02 million nonfarm jobs, seasonally adjusted, according to the Bureau of Labor Statistics. Construction employed 151,100 people. Manufacturing employed 143,300. Mining and logging — the old Gulf paycheck — employed 27,600. Texas, for scale, had 14.5 million nonfarm jobs and 922,000 in construction.
SpaceX’s 3,000 direct jobs are 0.15 percent of Louisiana’s payroll and about 2 percent of the construction payroll. Even the fuller 11,100 direct-plus-indirect figure is half a percent of statewide employment. That is not an insult to the people who will pour concrete in Vermilion Parish. It is a reminder that headline job counts on economic-development press releases are almost always small next to the existing market. A plant that hires 3,000 people over a decade can still transform a parish. It does not transform a state of two million paychecks.
The longer payroll history is less flattering. Annual average manufacturing employment fell from about 177,000 in 2000 to about 141,000 in 2025. Mining and logging fell from about 48,000 to about 28,000. Construction recovered toward its 2018 peak and then some in the 2026 monthly readings, but it did not build a new industrial middle class. The state’s goods-producing core has been shrinking or sideways for a generation. A spaceport is a construction story first, a launch story later, and a manufacturing story only if the promised vehicle-processing and propellant work actually shows up on the CES payroll.
Louisiana factory and mine payrolls never recovered their old peaks

View exact chart values
| year | construction | manufacturing | mining_logging |
|---|---|---|---|
| 2000 | 128.9 | 177.4 | 47.7 |
| 2001 | 124.6 | 171.8 | 52.4 |
| 2002 | 119 | 160.8 | 49.2 |
| 2003 | 118.9 | 155.9 | 47.9 |
| 2004 | 116.4 | 153.3 | 45.5 |
| 2005 | 118.8 | 152.2 | 46.2 |
| 2006 | 130.7 | 152.7 | 49.6 |
| 2007 | 133 | 157.2 | 52.7 |
| 2008 | 134.7 | 152.8 | 56 |
| 2009 | 130 | 142.1 | 52.4 |
| 2010 | 121.4 | 137.9 | 53 |
| 2011 | 122 | 139.8 | 54.9 |
| 2012 | 126.2 | 142.3 | 56.1 |
| 2013 | 130.9 | 144.7 | 55.8 |
| 2014 | 138.9 | 147.6 | 55.9 |
| 2015 | 140.5 | 144 | 47.9 |
| 2016 | 140.6 | 136 | 38.2 |
| 2017 | 147 | 134.7 | 35.8 |
| 2018 | 151.9 | 135.7 | 36.6 |
| 2019 | 142 | 137.9 | 36.7 |
| 2020 | 122.4 | 131.5 | 30.9 |
| 2021 | 129.5 | 129.5 | 29.9 |
| 2022 | 129 | 134.7 | 31 |
| 2023 | 131.1 | 139.4 | 31.3 |
| 2024 | 140.2 | 140.5 | 29.5 |
| 2025 | 138 | 140.7 | 28.3 |
Three thousand jobs is a rounding error on Louisiana’s payroll

View exact chart values
| label | jobs |
|---|---|
| SpaceX direct jobs pledged | 3000 |
| SpaceX direct plus indirect pledged | 11100 |
| Louisiana mining and logging jobs | 27600 |
| Louisiana manufacturing jobs | 143300 |
| Louisiana construction jobs | 151100 |
Chemicals still pay the rent
Before Starship, Louisiana’s high-value output was already industrial. Manufacturing was 17.3 percent of 2025 GDP. Chemical manufacturing alone was $25.3 billion, or 7.4 percent of the state. Petroleum and coal products — refineries, in English — added $16.6 billion. Mining, quarrying, and oil and gas extraction added $10.8 billion. Construction, the sector that would actually build a spaceport, was $21.6 billion, or 6.3 percent.
Those shares matter because they describe the labor market SpaceX would hire from: millwrights, pipefitters, turnaround crews, and coastal construction firms that already know how to work in wetlands and hurricanes. They also describe the competition. A $100 billion campus that needs power, gas, and water is walking into a state whose existing plants already bid for the same inputs. Louisiana Economic Development has said natural gas is part of the site’s appeal. That is a polite way of saying the spaceport wants to plug into the same Gulf Coast energy system that already dominates the state’s value added.
The income numbers are consistent with a cheaper, slower state rather than a booming one. Per capita personal income in 2025 was $63,940 in Louisiana, $72,364 in Texas, and $76,393 in the United States. Louisiana is cheaper, too: the 2024 all-items regional price parity was 88.2, against 97.1 in Texas (U.S. = 100), per BEA’s regional price parities. SpaceX’s pledged $92,600 average salary is well above the state’s implied construction pay. Louisiana construction workers averaged $1,385 a week in July 2026, not seasonally adjusted — about $72,000 if that week were typical for a year. A $92,600 offer would clear the local construction market. It would not, by itself, lift statewide per capita income very far.
Louisiana incomes remain below Texas and the national average

View exact chart values
| year | louisiana | texas | united_states |
|---|---|---|---|
| 2000 | 23907 | 28253 | 30551 |
| 2001 | 25630 | 29601 | 31548 |
| 2002 | 26281 | 29481 | 31801 |
| 2003 | 26987 | 30176 | 32659 |
| 2004 | 27983 | 31097 | 34183 |
| 2005 | 29970 | 33136 | 35669 |
| 2006 | 33627 | 35422 | 37843 |
| 2007 | 36208 | 36879 | 39588 |
| 2008 | 38328 | 39841 | 40854 |
| 2009 | 36803 | 37234 | 39307 |
| 2010 | 38067 | 38911 | 40557 |
| 2011 | 38966 | 41941 | 42650 |
| 2012 | 40662 | 43869 | 44238 |
| 2013 | 40996 | 44403 | 44402 |
| 2014 | 42533 | 46747 | 46289 |
| 2015 | 42484 | 46767 | 48062 |
| 2016 | 42132 | 45868 | 48974 |
| 2017 | 43486 | 48524 | 51006 |
| 2018 | 45465 | 51346 | 53311 |
| 2019 | 47015 | 53271 | 55567 |
| 2020 | 50181 | 54825 | 59151 |
| 2021 | 55112 | 60396 | 64692 |
| 2022 | 55297 | 63758 | 66303 |
| 2023 | 58859 | 67522 | 70013 |
| 2024 | 61667 | 69762 | 73227 |
| 2025 | 63940 | 72364 | 76393 |
What the official books cannot promise
Two confusions are worth killing now. First, capital spending is not GDP. A $100 billion outlay spread across a decade is a cash-flow claim, not a $100 billion bump to 2027 output. Some of it will leak to out-of-state contractors, some will be delayed, and some may never be spent. The local payment-in-lieu-of-taxes package described in the company’s announcement — $20 million up front and at least $25 million a year for 25 years — is a fiscal footnote next to a $340 billion economy, not proof the project pencils out for parish schools.
Second, these figures cannot tell you whether Starbase Louisiana will “work.” They can tell you the scale of the bet relative to the economy that has to host it. Louisiana has not been a growth machine. Its real GDP has lagged. Its factories and oilfield payrolls are smaller than they were. Its incomes sit below Texas and the national average even after adjusting, loosely, for lower prices. Into that setting, SpaceX is proposing a project whose pledged capital is nearly a third of annual state output and whose pledged headcount is a rounding error on the statewide payroll.
That combination is less paradoxical than it sounds. Giant capital projects are often job-light. Rocket factories and launch pads are expensive precisely because they are full of steel, propellant, and software rather than people. If Louisiana wants the tax base, the spectacle, and a few thousand well-paid jobs on the coast, the official data say the state is small enough that the project would loom large. If it wants a new growth model, it will need the rest of the economy to do something it has not done for twenty-five years: expand in real terms at something like the national pace, not the Gulf Coast’s.
Sources and methods
This is retrospective enrichment using pinned catalogue snapshots available to the researcher, not a reconstruction of what was knowable on the edition date of 2026-08-27. Later releases and revisions may be present in the snapshots.
Research date: 2026-09-11. Historical edition date: 2026-08-27.
BEA annual state GDP and personal income: product bea_regional_state_annual, release bea-regional-state-annual-2026-04-09, snapshot created 2026-08-31. Current-dollar and real (chained 2017 dollars) GDP, GDP by industry, per capita personal income, and population are annual calendar-year estimates. Latest annual year used is 2025.
BEA quarterly state GDP: product bea_regional_state_quarterly, release bea-regional-state-quarterly-2026-06-25, snapshot created 2026-08-31. Figures are seasonally adjusted annual rates in millions of current dollars. Latest quarter used is 2026 Q1.
BEA regional price parities: product bea_regional_prices, release bea-rpp-2026-02-19, snapshot created 2026-08-31. All-items RPPs, U.S. = 100, annual, 2008–2024. Latest year used is 2024.
BLS State and Area Employment: product bls_sae, release bls-sm-snapshot-2026-08-24, snapshot created 2026-08-24. Statewide seasonally adjusted all-employees series in thousands, monthly, through July 2026. Construction average weekly earnings of all employees are not seasonally adjusted. Chemical manufacturing employment was requested as monthly and returned no observations (the series is stored as annual); it was not used.
SpaceX capital, job, salary, acreage, and timeline figures are from the 2026-08-27 Fortune report cited in the article, not from BEA or BLS. They are treated as announced pledges, not realized spending or hires.
Calculations used last chronological non-null observation in each extract. Missing values were not treated as zero. Annual employment averages are the mean of monthly seasonally adjusted levels in that calendar year. Implied construction annual pay is latest weekly earnings times 52; that is not an official annual salary series and is not a SpaceX wage. Manufacturing GDP already includes chemicals and petroleum products; those components were not added to manufacturing when describing industry size. The $100 billion pledge is a multi-year capital claim and is not added to annual GDP. No causal effect of the spaceport on future GDP or jobs is inferred from these descriptive comparisons.
Research completed 2026-09-11, for the August 27, 2026 news edition. This is retrospective analysis, not a reconstruction of information available that day.