Research
Indiana’s Medicaid money didn’t crash. It stalled — while the health bill kept growing.
The dollar books have not crashed. They have stalled.
The news from Indiana is about people, not ledgers. More than 500,000 residents have lost Medicaid since the start of 2025 under stepped-up eligibility checks, including a nearly 20 percent drop in children’s coverage, and work requirements are due on January 1 — before those rules even take effect (WFYI, via LPM). Advocates warn the state could fall back toward pre-Affordable Care Act uninsurance; hospital consultants worry the uninsured will show up in emergency rooms. The official economic books cannot count those 500,000 people. They can show whether the money attached to Medicaid has already turned down.
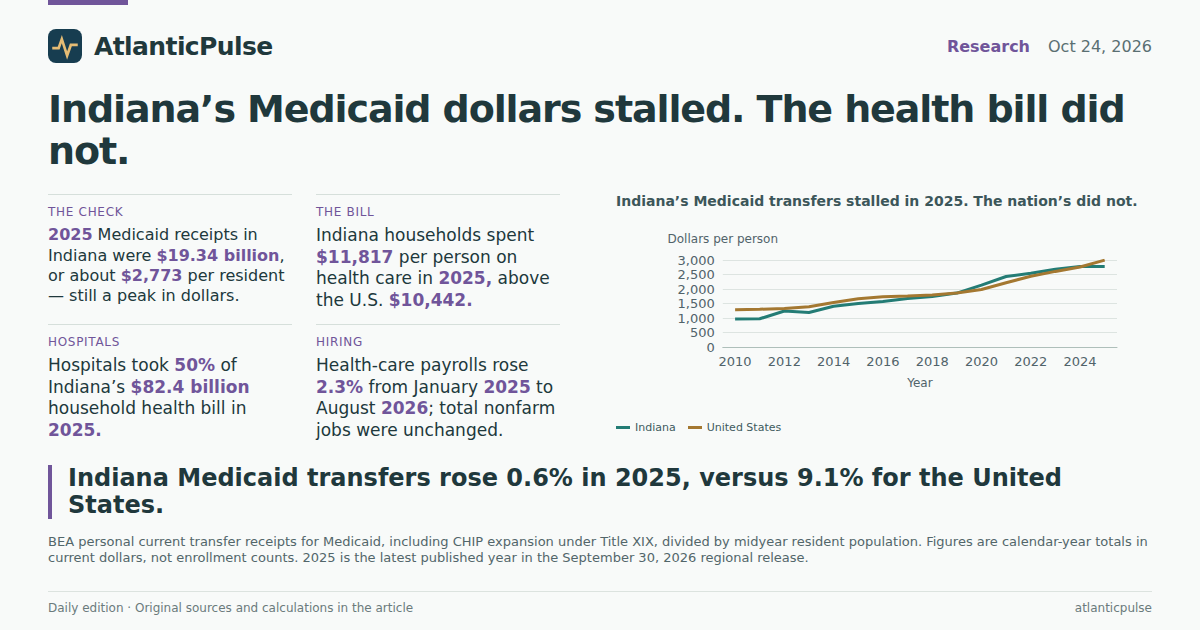
It has not fallen. In calendar year 2025, BEA Medicaid transfer receipts in Indiana were $19.34 billion, still the highest annual total in the 2010–2025 series. That works out to about $2,773 per resident. What changed is the slope. Indiana’s Medicaid dollars rose 0.6 percent in 2025 after a 4.3 percent increase in 2024. The United States, on the same series, rose 9.1 percent. Per person, Indiana had caught the national average in 2019 ($1,858 versus $1,859) and even run a little ahead through 2024. In 2025 the Indiana line went almost sideways, from $2,771 to $2,773, while the U.S. line jumped from $2,760 to $2,996.
Indiana’s Medicaid transfers stalled in 2025. The nation’s did not.

View exact chart values
| year | indiana_billions | us_billions | indiana_per_capita | us_per_capita | indiana_index_2019 | us_index_2019 |
|---|---|---|---|---|---|---|
| 2010 | 6.29 | 396.9 | 969 | 1283 | 50.1 | 64.6 |
| 2011 | 6.35 | 406 | 974 | 1302 | 50.6 | 66.1 |
| 2012 | 8.14 | 417.5 | 1243 | 1328 | 64.8 | 68 |
| 2013 | 7.82 | 440 | 1189 | 1389 | 62.3 | 71.7 |
| 2014 | 9.28 | 490.9 | 1405 | 1538 | 73.9 | 79.9 |
| 2015 | 9.98 | 535.9 | 1505 | 1665 | 79.4 | 87.3 |
| 2016 | 10.45 | 562.8 | 1569 | 1735 | 83.2 | 91.7 |
| 2017 | 11.2 | 573.7 | 1675 | 1757 | 89.1 | 93.4 |
| 2018 | 11.73 | 589.8 | 1744 | 1795 | 93.4 | 96 |
| 2019 | 12.56 | 614 | 1858 | 1859 | 100 | 100 |
| 2020 | 14.51 | 657.6 | 2136 | 1983 | 115.5 | 107.1 |
| 2021 | 16.57 | 736.5 | 2432 | 2218 | 131.9 | 119.9 |
| 2022 | 17.39 | 814.4 | 2542 | 2438 | 138.4 | 132.6 |
| 2023 | 18.43 | 878.1 | 2678 | 2608 | 146.7 | 143 |
| 2024 | 19.21 | 938.4 | 2771 | 2760 | 153 | 152.8 |
| 2025 | 19.34 | 1024 | 2773 | 2996 | 153.9 | 166.8 |
A thinner Medicaid check, next to neighbors who still spend more
Put 2025 on a bar chart and Indiana is not the Medicaid heavyweight of the old Northwest Territory. Kentucky’s transfers came to $4,618 per person. Ohio was at $3,118, Illinois $2,907, the United States $2,996. Michigan, at $2,758, was the only neighbor slightly below Indiana. Those are dollar transfers to individuals, including CHIP expansion under Title XIX, not caseloads. A state can spend less per resident because it covers fewer people, pays less per enrollee, or both. The BEA series does not say which.
The comparison still matters for the work-requirement fight. Indiana’s Medicaid book is 4.2 percent of personal income — real money, not a rounding error — but it is not an outlier that dwarfs the region. If the eligibility machine keeps chewing, the official transfers have room to fall from a peak that, in 2025, had already stopped compounding. That is the opposite of a crash. It is also the opposite of a boom.
Among Great Lakes neighbors, Indiana’s Medicaid check is the thinner one

View exact chart values
| state | medicaid_per_capita | health_pce_per_capita | medicaid_as_share_of_health_pce_pct |
|---|---|---|---|
| Kentucky | 4618 | 10804 | 42.7 |
| Ohio | 3118 | 10900 | 28.6 |
| United States | 2996 | 10442 | 28.7 |
| Illinois | 2907 | 10681 | 27.2 |
| Indiana | 2773 | 11817 | 23.5 |
| Michigan | 2758 | 9725 | 28.4 |
The household health bill did not stall with the Medicaid check
Households, meanwhile, are not waiting for the state dashboard. In 2025 Indiana’s household health-care consumption was $11,817 per person, 21.8 percent of total personal consumption expenditures of $54,273. The U.S. health-care figure was $10,442. Among the same neighbors, Indiana’s health bill is the fat one: Ohio $10,900, Illinois $10,681, Kentucky $10,804, Michigan $9,725. Medicaid transfers equaled 23.5 percent of that Indiana health bill, versus 42.7 percent in Kentucky. The coverage program is thinner, relative to what people actually spend, than the hospital invoice.
Hospitals take half. Of Indiana’s $82.4 billion household health bill in 2025, hospital services were $41.2 billion (50 percent), physician services $19.0 billion (23 percent), other outpatient and paramedical care $12.0 billion, nursing homes $6.9 billion, and home health $3.3 billion. On the production side, hospitals accounted for $14.3 billion of Indiana GDP in 2025 — 2.6 percent of a $542.5 billion state economy — and health care and social assistance as a whole $45.6 billion, or 8.4 percent. That is the industry FSSA Secretary Mitch Roob is telling to treat insurance as a “responsibility,” and the industry hospital officials say will eat uncompensated care if the rolls keep shrinking.
Half of Indiana’s household health bill is hospitals

View exact chart values
| category | millions | share_pct |
|---|---|---|
| Hospitals | 41201.4 | 50 |
| Physician services | 18997.6 | 23.1 |
| Nursing homes | 6931.3 | 8.4 |
| Home health care | 3280 | 4 |
| Other outpatient and paramedical | 11994.1 | 14.6 |
Indexed to 2019, the U.S. Medicaid book kept compounding. Indiana’s did not.
Nominal dollars flatter a stall. Indexed to 2019, Indiana’s Medicaid transfers stand at 154 in 2025; the U.S. index is 167. From 2019 to 2024 the two lines ran almost together. The split is a one-year story: 2025. That is the same calendar year the state says eligibility checks removed hundreds of thousands of people. It is not proof the checks caused the stall. Remaining enrollees can be more expensive, prices can rise, and a calendar-year total can hide a drop that started in the spring. It is evidence that the first year of the purge did not produce a collapse in the official transfer series — and that Indiana stopped keeping up with the country.
Indexed to 2019, Indiana’s Medicaid book stopped compounding

View exact chart values
| year | indiana_billions | us_billions | indiana_per_capita | us_per_capita | indiana_index_2019 | us_index_2019 |
|---|---|---|---|---|---|---|
| 2010 | 6.29 | 396.9 | 969 | 1283 | 50.1 | 64.6 |
| 2011 | 6.35 | 406 | 974 | 1302 | 50.6 | 66.1 |
| 2012 | 8.14 | 417.5 | 1243 | 1328 | 64.8 | 68 |
| 2013 | 7.82 | 440 | 1189 | 1389 | 62.3 | 71.7 |
| 2014 | 9.28 | 490.9 | 1405 | 1538 | 73.9 | 79.9 |
| 2015 | 9.98 | 535.9 | 1505 | 1665 | 79.4 | 87.3 |
| 2016 | 10.45 | 562.8 | 1569 | 1735 | 83.2 | 91.7 |
| 2017 | 11.2 | 573.7 | 1675 | 1757 | 89.1 | 93.4 |
| 2018 | 11.73 | 589.8 | 1744 | 1795 | 93.4 | 96 |
| 2019 | 12.56 | 614 | 1858 | 1859 | 100 | 100 |
| 2020 | 14.51 | 657.6 | 2136 | 1983 | 115.5 | 107.1 |
| 2021 | 16.57 | 736.5 | 2432 | 2218 | 131.9 | 119.9 |
| 2022 | 17.39 | 814.4 | 2542 | 2438 | 138.4 | 132.6 |
| 2023 | 18.43 | 878.1 | 2678 | 2608 | 146.7 | 143 |
| 2024 | 19.21 | 938.4 | 2771 | 2760 | 153 | 152.8 |
| 2025 | 19.34 | 1024 | 2773 | 2996 | 153.9 | 166.8 |
The clinics kept hiring after the coverage checks began
Payrolls are more current than the annual transfer books, and they point the other way from a system in retreat. Indiana health care and social assistance employment was 469,300 in August 2026, seasonally adjusted, or 14.4 percent of nonfarm jobs. That is 13.3 percent above January 2019. Total nonfarm employment was up 3.2 percent over the same span. From January 2025 — the year the coverage losses piled up — through August 2026, health-care payrolls rose 2.3 percent; total nonfarm employment was unchanged. Neighboring states kept adding health-care jobs too. Indiana’s August 2024 to August 2025 gain was 2.1 percent, in the same band as Kentucky (1.9 percent) and a little slower than Ohio, Michigan and Illinois.
Hospital jobs, counted on a not-seasonally-adjusted snapshot, were 133,400 in August 2026, up from 128,200 in August 2024. That is not a collapse in the industry that would absorb uninsured patients. It is a reminder that “health care” on a payroll survey is mostly people with jobs at clinics, hospitals and nursing homes, not a count of who has a Medicaid card. The two can move in opposite directions for a while. The open question, which 2025 annual transfers cannot answer, is how long that lasts once work requirements join the paperwork.
Health-care payrolls kept growing after the coverage checks began

View exact chart values
| period | health_care_index | nonfarm_index | health_care_thousands |
|---|---|---|---|
| 2019-08 | 101.3 | 99.9 | 419.3 |
| 2020-08 | 98.2 | 94.7 | 406.7 |
| 2021-08 | 99.2 | 97.8 | 410.6 |
| 2022-08 | 101.5 | 101.3 | 420.5 |
| 2023-08 | 106.2 | 102.5 | 439.9 |
| 2024-08 | 109.5 | 103.1 | 453.4 |
| 2025-08 | 111.8 | 103.7 | 463.1 |
| 2026-08 | 113.3 | 103.2 | 469.3 |
Sources and methods
All figures are from pinned AtlanticPulse snapshots of BEA annual state personal income and GDP (release bea-regional-state-annual-2026-09-30), BEA state PCE (bea-sapce-2026-09-30), and BLS State and Area Employment (bls-sm-snapshot-2026-08-24). Observation years are calendar years or survey months, not the day of this edition; 2025 annual accounts and August 2026 payrolls are the latest in those files.
BEA “Medicaid” transfer receipts include Medicaid and CHIP expansion under Title XIX. They are current-dollar calendar-year totals received by individuals, not enrollment, not state budget outlays, and not a household average. Per-person figures divide those totals by BEA midyear resident population. Missing values were not treated as zero.
Household health spending is BEA personal consumption expenditures on health care (outpatient services plus hospital and nursing home services). It is not limited to Medicaid patients and does not include net health-insurance premiums, which BEA records elsewhere. The “other outpatient and paramedical” slice is a residual after hospitals, physician services, nursing homes and home health care.
Indiana health-care and total nonfarm jobs are seasonally adjusted statewide payrolls; hospital jobs are not seasonally adjusted. Indexes use January 2019 as 100. Neighbor comparisons use the same series definitions. No figure infers that eligibility checks caused the 2025 transfer stall or that hiring will continue after work requirements take effect.
Research completed 2026-10-25, for the October 24, 2026 news edition. The available source data may cover earlier periods; see the observation periods and source vintages above.