Research
Illinois is short 142,000 homes. Its housing prices are still below America’s.
The shortage, on a bill that is not the country’s highest
Five years after Gov. JB Pritzker launched Home Illinois, a new state report says overall homelessness fell 6 percent from 2025 to 2026 while chronic homelessness — repeated homelessness plus a disabling condition — rose 28 percent. The same report puts the housing gap at about 142,000 homes, with rents up 27 percent and home prices up 54 percent from 2019 to 2024. That is the political argument for spending almost $620 million in fiscal 2027. It is also a claim that can be checked against the official books, which do not count tents but do count what households spend on shelter.
Those books do not show Illinois as America’s housing outlier. In 2024, Illinois residents spent $9,570 per person on housing and household utilities, according to Bureau of Economic Analysis state consumption accounts. The U.S. average was $10,595. Illinois was higher than Indiana, Ohio, Iowa, Missouri and Kentucky, and close to Wisconsin and Michigan. It was not higher than the country. The state’s housing price parity — BEA’s index of tenant-housing prices relative to the national average — was 93.9 in 2024, against 100.6 for the United States. Illinois housing is expensive for the people who cannot pay it. It is not expensive by the national yardstick.
Illinois housing-and-utilities bills rose, but stayed below the U.S. average

View exact chart values
| year | tenant_rent_mil | owner_imputed_mil | housing_pce_mil | tenant_per_capita | housing_share_of_pce | pc_housing_utils | pc_pce | us_pc_housing_utils | population |
|---|---|---|---|---|---|---|---|---|---|
| 2010 | 13342 | 52826.8 | 66930.2 | 1039 | 15.3 | 6165 | 34161 | 6296 | 12845460 |
| 2011 | 13741.3 | 53534.4 | 68015.9 | 1066 | 14.9 | 6220 | 35291 | 6360 | 12892409 |
| 2012 | 14501 | 54252.4 | 69532 | 1122 | 14.9 | 6273 | 36010 | 6409 | 12927420 |
| 2013 | 15338.1 | 54815.3 | 70980.6 | 1184 | 14.9 | 6398 | 36752 | 6585 | 12959880 |
| 2014 | 15548.3 | 56133.6 | 72506.9 | 1199 | 14.7 | 6584 | 38013 | 6722 | 12968905 |
| 2015 | 16367.7 | 57090.3 | 74302.5 | 1263 | 14.6 | 6686 | 39180 | 6824 | 12963110 |
| 2016 | 16769.4 | 58702.2 | 76352.8 | 1295 | 14.6 | 6850 | 40356 | 6996 | 12944999 |
| 2017 | 16236.7 | 60542 | 77675 | 1256 | 14.4 | 7002 | 41754 | 7196 | 12922894 |
| 2018 | 17041.3 | 62229 | 80149.3 | 1322 | 14.3 | 7290 | 43629 | 7486 | 12887397 |
| 2019 | 17803.5 | 62822.3 | 81617.5 | 1386 | 14.2 | 7414 | 44729 | 7758 | 12849440 |
| 2020 | 18713.3 | 65219.5 | 84857.5 | 1463 | 15.1 | 7706 | 43940 | 8106 | 12795348 |
| 2021 | 18928.7 | 67835.5 | 87693 | 1490 | 13.9 | 8043 | 49605 | 8560 | 12703354 |
| 2022 | 20379.8 | 72055.1 | 93426.1 | 1616 | 13.5 | 8776 | 54715 | 9324 | 12609577 |
| 2023 | 22136.9 | 77083.7 | 100300.6 | 1752 | 13.7 | 9217 | 57841 | 10022 | 12633389 |
| 2024 | 23124.4 | 80692.1 | 104976.1 | 1820 | 13.6 | 9570 | 60612 | 10595 | 12703033 |
Among nearby states, Illinois’s 2024 housing bill is high — but not the country’s

View exact chart values
| state | pc_housing_utils_2024 | pc_housing_utils_2019 | pct_change_2019_2024 |
|---|---|---|---|
| United States | 10595 | 7758 | 36.6 |
| Illinois | 9570 | 7414 | 29.1 |
| Wisconsin | 9184 | 6930 | 32.5 |
| Michigan | 9175 | 7209 | 27.3 |
| Missouri | 8388 | 6507 | 28.9 |
| Ohio | 8357 | 6383 | 30.9 |
| Indiana | 8248 | 6327 | 30.4 |
| Iowa | 8245 | 6450 | 27.8 |
| Kentucky | 7659 | 5918 | 29.4 |
Rents rose. The typical renter’s check is not the whole ledger.
The part of the ledger that looks most like a rent check is tenant-occupied nonfarm housing. Illinois households spent $23.1 billion on that in 2024, up 29.9 percent from $17.8 billion in 2019. That is in the same neighborhood as the Home Illinois rent figure, and it happened while the state’s population fell 1.1 percent, from 12.85 million to 12.70 million. Divided by every resident, not just renters, tenant rent came to $1,820 per person in 2024, up from $1,386 in 2019. The U.S. figure rose from $1,578 to $2,177. Illinois tenants, in the aggregate, still spend less per resident than the country.
Most of Illinois’s housing bill is not a lease. Owner-occupied imputed rent — what BEA says homeowners could have charged a tenant — was $80.7 billion in 2024, 76.9 percent of the $105.0 billion housing total. Tenant rent was 22.0 percent. Housing’s share of all personal consumption in Illinois actually slipped, from 14.2 percent in 2019 to 13.6 percent in 2024, because other spending bounced harder after 2020. Housing and utilities were still 15.8 percent of per-person consumption in 2024. Real per capita personal income, in 2017 dollars, rose 7.4 percent from 2019 to 2024. Per-person housing-and-utilities spending, in current dollars, rose 29.1 percent. The shelter line outran the paycheck even as it lagged the national shelter line.
Tenant rent per person rose in Illinois — and rose faster nationwide

View exact chart values
| year | il_tenant_per_capita | us_tenant_per_capita |
|---|---|---|
| 2010 | 1039 | 1167 |
| 2011 | 1066 | 1213 |
| 2012 | 1122 | 1271 |
| 2013 | 1184 | 1305 |
| 2014 | 1199 | 1345 |
| 2015 | 1263 | 1384 |
| 2016 | 1295 | 1420 |
| 2017 | 1256 | 1430 |
| 2018 | 1322 | 1493 |
| 2019 | 1386 | 1578 |
| 2020 | 1463 | 1619 |
| 2021 | 1490 | 1715 |
| 2022 | 1616 | 1863 |
| 2023 | 1752 | 2046 |
| 2024 | 1820 | 2177 |
The crews showed up. The buildings, in real terms, did not.
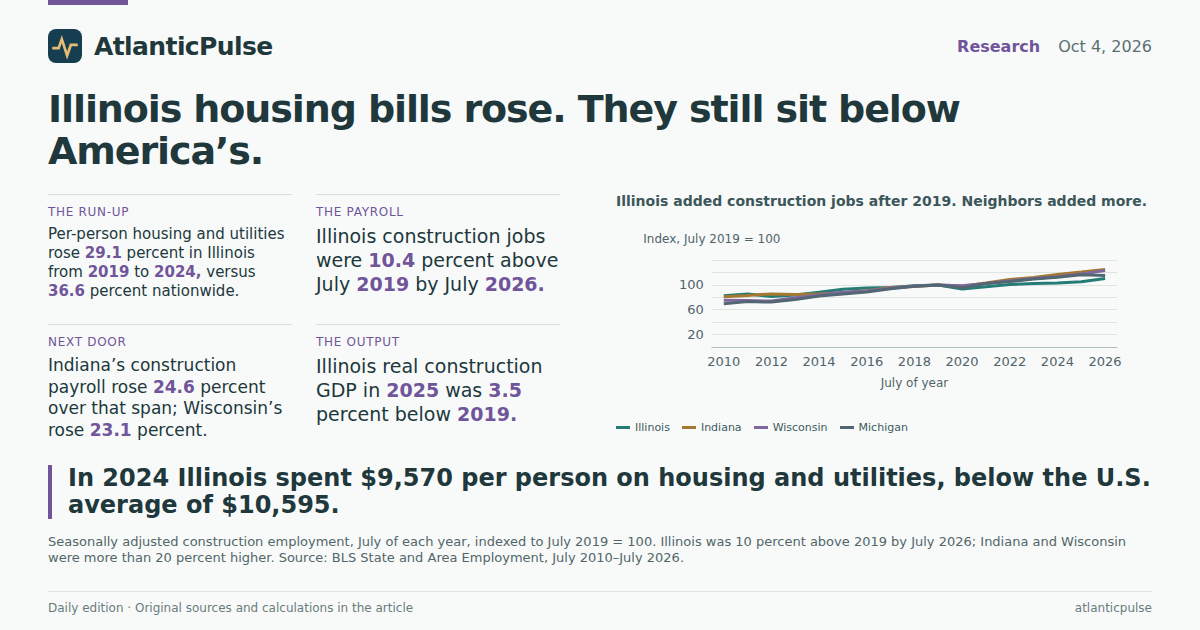
If the problem is missing homes, the next question is whether Illinois has been hiring people to build them. Seasonally adjusted construction employment — a broader bucket than homebuilding, covering highways and nonresidential work as well as houses — was 253,800 in July 2026, up 10.4 percent from 229,800 in July 2019, according to BLS state payrolls. Construction’s share of Illinois nonfarm jobs rose from 3.75 percent to 4.11 percent. That is not a disappearing industry. It is also not a boom next door. Over the same July-to-July span, Indiana’s construction payroll rose 24.6 percent, Wisconsin’s 23.1 percent, and Michigan’s 15.2 percent.
Jobs and output parted company. Illinois real construction GDP, in chained 2017 dollars, was $28.3 billion in 2025, 3.5 percent below 2019 and only 4.5 percent above 2010. The U.S. construction industry was 0.5 percent above 2019 and 35 percent above 2010. Adding workers while real output slips is a reminder that a construction job is not a finished apartment. It is also a reminder that this series is all construction, not a housing-starts count. The official record can say Illinois hired more construction workers than it had before the pandemic. It cannot say those workers closed a 142,000-home gap.
Illinois added construction jobs after 2019. Neighbors added more.

View exact chart values
| year | il_construction_thousands | il_nonfarm_thousands | il_construction_share_pct | in_construction_thousands | wi_construction_thousands | mi_construction_thousands | il_index_2019 | in_index_2019 | wi_index_2019 | mi_index_2019 |
|---|---|---|---|---|---|---|---|---|---|---|
| 2010 | 189.9 | 5590.2 | 3.4 | 117.5 | 93.6 | 121 | 82.6 | 80.9 | 75.1 | 69.5 |
| 2011 | 196.3 | 5681.9 | 3.45 | 120.7 | 93.1 | 127.4 | 85.4 | 83.1 | 74.7 | 73.1 |
| 2012 | 186.9 | 5746.3 | 3.25 | 124.2 | 92.1 | 126 | 81.3 | 85.5 | 73.9 | 72.3 |
| 2013 | 191.8 | 5801.3 | 3.31 | 123 | 99 | 133.3 | 83.5 | 84.7 | 79.4 | 76.5 |
| 2014 | 202.6 | 5880.1 | 3.45 | 124.2 | 104.2 | 142.6 | 88.2 | 85.5 | 83.6 | 81.9 |
| 2015 | 213.6 | 5981.5 | 3.57 | 126.7 | 109.8 | 148.2 | 93 | 87.3 | 88.1 | 85.1 |
| 2016 | 218.4 | 6014.5 | 3.63 | 131.4 | 112.2 | 153.9 | 95 | 90.5 | 90 | 88.3 |
| 2017 | 219.9 | 6053.7 | 3.63 | 138.9 | 118.1 | 163 | 95.7 | 95.7 | 94.7 | 93.6 |
| 2018 | 226.8 | 6109 | 3.71 | 141.4 | 122.7 | 170.3 | 98.7 | 97.4 | 98.4 | 97.8 |
| 2019 | 229.8 | 6132.9 | 3.75 | 145.2 | 124.7 | 174.2 | 100 | 100 | 100 | 100 |
| 2020 | 214.4 | 5567.5 | 3.85 | 141.8 | 122.8 | 166.1 | 93.3 | 97.7 | 98.5 | 95.4 |
| 2021 | 222.7 | 5820.9 | 3.83 | 149.6 | 127.4 | 177.9 | 96.9 | 103 | 102.2 | 102.1 |
| 2022 | 231.4 | 6061.9 | 3.82 | 157.6 | 132.6 | 183.6 | 100.7 | 108.5 | 106.3 | 105.4 |
| 2023 | 234.5 | 6125 | 3.83 | 162.5 | 137.3 | 190.3 | 102 | 111.9 | 110.1 | 109.2 |
| 2024 | 237.1 | 6154.4 | 3.85 | 169.8 | 141 | 195.8 | 103.2 | 116.9 | 113.1 | 112.4 |
| 2025 | 241.1 | 6164.5 | 3.91 | 175.1 | 146.4 | 202.5 | 104.9 | 120.6 | 117.4 | 116.2 |
| 2026 | 253.8 | 6176.4 | 4.11 | 180.9 | 153.5 | 200.7 | 110.4 | 124.6 | 123.1 | 115.2 |
Illinois’s real construction output never recaptured its 2010s peak

View exact chart values
| year | il_real_gdp_mil | us_real_gdp_mil | il_index_2010 | us_index_2010 |
|---|---|---|---|---|
| 2010 | 27059.7 | 656758 | 100 | 100 |
| 2011 | 26109.3 | 648944 | 96.5 | 98.8 |
| 2012 | 24566.3 | 670176 | 90.8 | 102 |
| 2013 | 27384.9 | 697567 | 101.2 | 106.2 |
| 2014 | 28120.3 | 721220 | 103.9 | 109.8 |
| 2015 | 29831.4 | 764407 | 110.2 | 116.4 |
| 2016 | 30121.7 | 804359 | 111.3 | 122.5 |
| 2017 | 30646.9 | 840220 | 113.3 | 127.9 |
| 2018 | 29497.9 | 863755 | 109 | 131.5 |
| 2019 | 29319.2 | 882288 | 108.4 | 134.3 |
| 2020 | 27997.6 | 863440 | 103.5 | 131.5 |
| 2021 | 29006.1 | 885064 | 107.2 | 134.8 |
| 2022 | 26456.9 | 830520 | 97.8 | 126.5 |
| 2023 | 26310.8 | 831082 | 97.2 | 126.5 |
| 2024 | 27414.6 | 871521 | 101.3 | 132.7 |
| 2025 | 28289.8 | 886831 | 104.5 | 135 |
A cheaper-than-America housing market can still fail the people in it
Put the pieces together and the Home Illinois numbers look less like a state that forgot to build and more like a state that builds slowly, in a market that is costly for low incomes and merely average for the country. Illinois’s housing-and-utilities bill rose 29 percent per person from 2019 to 2024; the U.S. bill rose 37 percent. Tenant rent per resident rose, and stayed below the national figure. Housing prices, on BEA’s tenant-based parity, drifted further below the U.S. average. Construction payrolls grew, just not as fast as Indiana’s or Wisconsin’s. Real construction output shrank. Population shrank too.
None of that measures homelessness, and none of it proves that a water-tower check or a zoning bill would have changed the point-in-time count. It does change the diagnosis. If Illinois were simply the victim of coastal-style prices, the consumption accounts would show it. They show a Great Lakes housing market that got more expensive for the people living in it, lagged the national run-up, and still did not produce enough cheap units to keep chronic homelessness from rising. The 142,000-home gap is a quantity problem sitting on top of a price problem that is real locally and unremarkable nationally. That is a harder political story than “we are the expensive state.” It is also the one the books support.
Sources and methods
This package uses pinned, read-only snapshots of BEA state personal consumption expenditures (annual through 2024; source release bea-sapce-2025-09-26), BEA annual state GDP and population (GDP through 2025 and population through 2025; source release bea-regional-state-annual-2026-04-09), BEA regional price parities and real personal income (through 2024; source release bea-rpp-2026-02-19), and BLS State and Area Employment (monthly through July 2026; snapshot 2026-08-24). Observation years are not publication dates; 2024 consumption and 2025 GDP are the latest complete years in those snapshots, not current-day readings.
Housing and utilities PCE includes tenant rent, imputed rent on owner-occupied dwellings, farm and group housing, and household utilities. It is not a typical household’s monthly check, and it is not a median rent. Tenant-occupied nonfarm rent is closer to actual rent payments in the aggregate; dividing it by total population is not a renter-only average. BEA housing regional price parities estimate price levels for tenant-occupied housing only. Construction employment and real construction GDP cover the entire construction industry, not housing starts or residential building alone.
July values are used for construction employment to compare like months on the seasonally adjusted series. Percent changes treat missing observations as missing, not zero. Neighbor comparisons are limited to states with extracted series; they are not a 50-state ranking. No causal effect is inferred from the descriptive gaps between Illinois, its neighbors, and the United States.
Research completed 2026-10-05, for the October 4, 2026 news edition. The available source data may cover earlier periods; see the observation periods and source vintages above.