Research
Illinois hospitals are a $34 billion industry. The Medicaid squeeze is not a rounding error.
A cut aimed at the places that already live on Medicaid
Illinois hospital lobbyists spent this week putting a number on a policy most voters have never heard of. A Capitol News Illinois report on a KFF analysis of the 2025 federal budget law said new caps on Medicaid “state directed payments” — the extra rates states tell managed-care plans to pay certain hospitals — would reduce federal hospital payments in Illinois by about $4 billion. The Illinois Health and Hospital Association’s own estimate is about $3 billion over five years, starting in 2028. IHA officials warned that without a congressional reversal, roughly half the state’s hospitals, especially rural critical-access and urban safety-net facilities, could cut staff, drop services or close.
Those are forecasts of a future payment rule, not a cash register that has already rung. They also sit on top of a second, related squeeze: a lower cap on hospital provider taxes that states use to draw federal Medicaid matching funds. The governor’s budget office has put the combined Medicaid hit, once fully phased in, in the billions of dollars a year. The useful question for readers is more basic. How large is the industry that would absorb that?
The official books say it is not a rounding error. In 2024, the latest year with a complete industry split, Illinois hospitals produced $34.2 billion of gross domestic product — value added, not total billings — or 3.0 percent of the state’s $1.15 trillion economy. That is a larger hospital slice than California or Texas, and it is almost 5 percent of U.S. hospital GDP. Households in Illinois already spent about $4,900 a person on hospital services that year. Hospital payrolls, far from shrinking in anticipation, were still rising through July 2026.
Output nearly quadrupled. Real work did not.
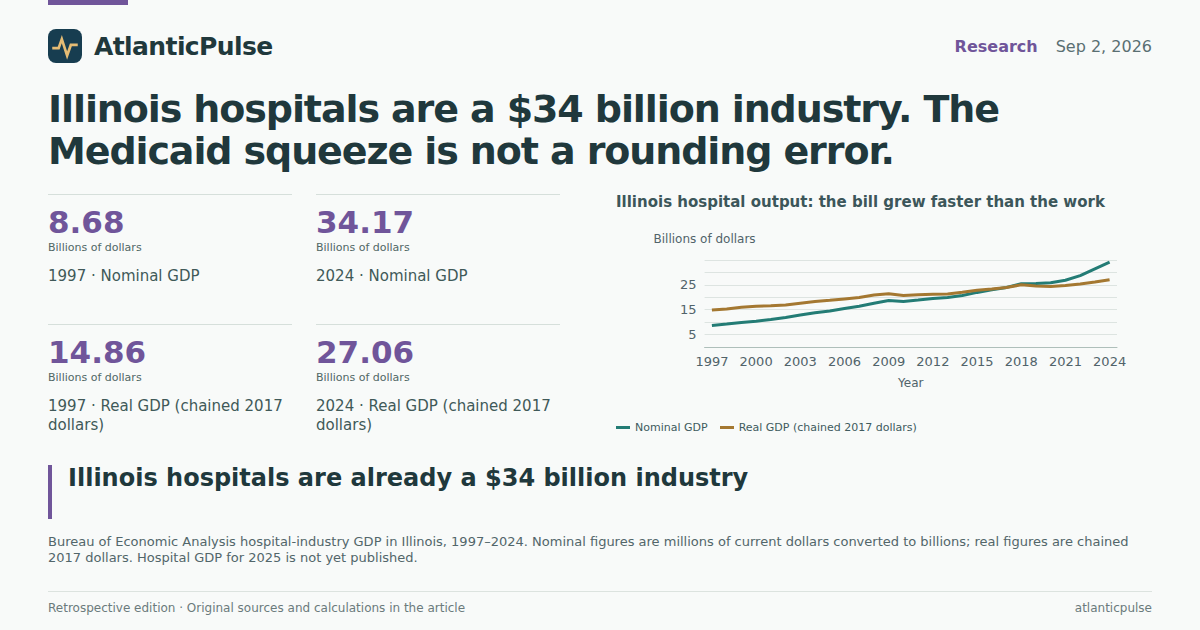
Nominal hospital GDP in Illinois rose from $8.7 billion in 1997 to $34.2 billion in 2024, a fourfold increase. Strip out prices and the story is slower: real hospital output, in chained 2017 dollars, went from $14.9 billion to $27.1 billion, an 82 percent gain. Prices did a lot of the talking. After 2014 the real gain was a more modest 23 percent.
The hospital share of the Illinois economy still drifted up, from 2.1 percent in 1997 to 3.0 percent in 2024. The Great Recession and the first pandemic year both nudged that share higher, because other industries shrank faster than hospitals did. The 2020 peak, 3.0 percent, looks a lot like 2024. Hospitals did not boom so much as they failed to recede.
Nationally, hospitals were 2.4 percent of GDP in 2024. Illinois is not an outlier among its neighbors. It is the Midwestern pattern. That matters for a Medicaid fight sold as a Washington accounting tweak: in Illinois, hospitals are already a thicker part of the state economy than they are in the Sun Belt giants.
Bureau of Economic Analysis industry GDP for 2025 is not yet published; all-industry Illinois GDP is, at $1.20 trillion. Nothing in the 2025 total tells you whether hospitals kept their 3 percent slice. Treat 2024 as the last hard industry year.
Illinois hospital output: the bill grew faster than the work

View exact chart values
| year | real_index_1997 | real_index_2014 | nom_index_1997 | real_gdp_bil | nom_gdp_bil |
|---|---|---|---|---|---|
| 1997 | 100 | 67.5 | 100 | 14.86 | 8.68 |
| 1998 | 103.1 | 69.6 | 106.6 | 15.32 | 9.26 |
| 1999 | 107.6 | 72.7 | 113.6 | 16 | 9.86 |
| 2000 | 110.3 | 74.5 | 118.9 | 16.4 | 10.32 |
| 2001 | 111.6 | 75.3 | 128 | 16.58 | 11.11 |
| 2002 | 113.6 | 76.7 | 137.1 | 16.88 | 11.91 |
| 2003 | 118.6 | 80.1 | 148 | 17.63 | 12.84 |
| 2004 | 123.2 | 83.2 | 158.2 | 18.31 | 13.74 |
| 2005 | 126.4 | 85.4 | 166.6 | 18.79 | 14.47 |
| 2006 | 130.3 | 88 | 177.8 | 19.37 | 15.44 |
| 2007 | 133.9 | 90.4 | 188.5 | 19.9 | 16.36 |
| 2008 | 140.5 | 94.9 | 202.8 | 20.88 | 17.6 |
| 2009 | 144.4 | 97.5 | 215.2 | 21.46 | 18.68 |
| 2010 | 139.2 | 94 | 211.4 | 20.68 | 18.35 |
| 2011 | 141.4 | 95.5 | 217.9 | 21.02 | 18.92 |
| 2012 | 142.7 | 96.4 | 225.3 | 21.22 | 19.56 |
| 2013 | 143.4 | 96.8 | 229.4 | 21.31 | 19.91 |
| 2014 | 148.1 | 100 | 238.6 | 22.01 | 20.72 |
| 2015 | 153.7 | 103.8 | 253.1 | 22.85 | 21.97 |
| 2016 | 157.2 | 106.1 | 265.3 | 23.36 | 23.03 |
| 2017 | 161.3 | 108.9 | 276.2 | 23.97 | 23.97 |
| 2018 | 168.3 | 113.6 | 293.1 | 25.01 | 25.44 |
| 2019 | 165.1 | 111.5 | 294.4 | 24.54 | 25.55 |
| 2020 | 163.9 | 110.7 | 298.1 | 24.36 | 25.88 |
| 2021 | 166.2 | 112.2 | 309.8 | 24.71 | 26.89 |
| 2022 | 170.8 | 115.4 | 330.8 | 25.39 | 28.72 |
| 2023 | 175.5 | 118.5 | 362.4 | 26.09 | 31.46 |
| 2024 | 182 | 122.9 | 393.6 | 27.06 | 34.17 |
Hospitals became a larger slice of Illinois’s economy

View exact chart values
| year | hosp_gdp_mil | real_hosp_gdp_mil | total_gdp_mil | hosp_share_pct | hosp_comp_bil | pce_hosp_mil | pce_hosp_per_capita | pcap_health | hosp_emp_ann_thous |
|---|---|---|---|---|---|---|---|---|---|
| 1997 | 8680.9 | 14862.4 | 416015.1 | 2.09 | 7.5 | 17307.7 | 1420 | 2872 | 198.3 |
| 1998 | 9257 | 15316.3 | 436533.4 | 2.12 | 8.05 | 17794.8 | 1450 | 2988 | 208.8 |
| 1999 | 9864.3 | 15996 | 459971.6 | 2.14 | 8.55 | 18221.8 | 1474 | 3076 | 212.6 |
| 2000 | 10319.3 | 16399.9 | 486089.7 | 2.12 | 8.97 | 19163.2 | 1541 | 3260 | 214.5 |
| 2001 | 11110.2 | 16584.1 | 499618.4 | 2.22 | 9.56 | 20369.7 | 1631 | 3496 | 215.8 |
| 2002 | 11905.2 | 16883.9 | 511485.9 | 2.33 | 10.18 | 22034.7 | 1759 | 3742 | 218.8 |
| 2003 | 12843.4 | 17626.7 | 528577 | 2.43 | 10.91 | 23050.8 | 1836 | 3927 | 221.1 |
| 2004 | 13735.8 | 18307.8 | 560079.8 | 2.45 | 11.56 | 24478 | 1944 | 4158 | 222.1 |
| 2005 | 14465.5 | 18791.1 | 589153.7 | 2.46 | 12.12 | 26110.4 | 2071 | 4420 | 224.9 |
| 2006 | 15438.6 | 19369.9 | 624068.1 | 2.47 | 12.86 | 27823.9 | 2201 | 4641 | 226.2 |
| 2007 | 16362.5 | 19898 | 649307.4 | 2.52 | 13.59 | 30551.8 | 2406 | 4961 | 229.3 |
| 2008 | 17603.1 | 20881.6 | 649677.3 | 2.71 | 14.31 | 31259.6 | 2452 | 5116 | 232.6 |
| 2009 | 18677.4 | 21456 | 645843.2 | 2.89 | 15.2 | 32676.5 | 2553 | 5301 | 232.4 |
| 2010 | 18354.3 | 20684.3 | 663929 | 2.76 | 14.87 | 34140.8 | 2658 | 5532 | 230.3 |
| 2011 | 18919 | 21022.2 | 691805.5 | 2.73 | 15.66 | 35038.4 | 2718 | 5668 | 231.6 |
| 2012 | 19561.7 | 21215.4 | 725478 | 2.7 | 16.1 | 35911.4 | 2778 | 5801 | 232.9 |
| 2013 | 19914.1 | 21314 | 742890.9 | 2.68 | 16.38 | 37335.7 | 2881 | 5901 | 231 |
| 2014 | 20715.7 | 22012.8 | 772291.7 | 2.68 | 16.71 | 39081.4 | 3013 | 6133 | 230.4 |
| 2015 | 21973.1 | 22845.4 | 802592 | 2.74 | 17.61 | 39882.8 | 3077 | 6337 | 232.1 |
| 2016 | 23030.3 | 23359.4 | 813561.6 | 2.83 | 18.29 | 42027.1 | 3247 | 6654 | 237.6 |
| 2017 | 23973 | 23973 | 832826.8 | 2.88 | 19.04 | 43017 | 3329 | 6825 | 241 |
| 2018 | 25439.7 | 25012.6 | 871024.2 | 2.92 | 20.16 | 44253.7 | 3434 | 7064 | 242.9 |
| 2019 | 25554.7 | 24538.4 | 895601.8 | 2.85 | 20.19 | 46488.5 | 3618 | 7355 | 242.5 |
| 2020 | 25877.3 | 24359.7 | 860807.8 | 3.01 | 20.81 | 44752.3 | 3498 | 7059 | 234.8 |
| 2021 | 26889.1 | 24708.6 | 947223.9 | 2.84 | 21.02 | 49602.8 | 3905 | 7825 | 232.2 |
| 2022 | 28719.3 | 25392.3 | 1037735.9 | 2.77 | 22.6 | 52506.7 | 4164 | 8445 | 233.3 |
| 2023 | 31456.1 | 26088.4 | 1100794.1 | 2.86 | 24.36 | 57298.1 | 4535 | 9184 | 244 |
| 2024 | 34166.5 | 27056.3 | 1148106.1 | 2.98 | 26.3 | 61959.4 | 4878 | 9895 | 252.3 |
Michigan, Ohio and Pennsylvania are even more hospital-heavy
Compare Illinois with seven other large states in 2024 and the Midwest clustering is obvious. Michigan’s hospital industry was 3.5 percent of state GDP, Pennsylvania 3.3 percent, Ohio 3.2 percent. Illinois, at 3.0 percent, sits with that group. New York was 2.6 percent. Florida was 2.4 percent. California was 1.7 percent and Texas 1.6 percent — large hospital industries in dollar terms ($67 billion and $44 billion) sitting inside much larger economies.
Illinois hospitals, at $34.2 billion, were smaller than New York’s ($59.3 billion) and a bit smaller than Florida’s ($40.9 billion), and they were 4.9 percent of U.S. hospital GDP of $691.5 billion. The state is not the country’s hospital capital. It is a place where hospitals are a bigger share of local output than the national average, which is exactly the profile of a Medicaid-heavy safety-net system.
That comparison is not a verdict on quality or on who “deserves” federal money. It is a reminder that a uniform federal cap lands differently where hospitals already account for more of the economy. Texas’s separate fight over extra Medicaid hospital funding is a cousin of this story, not a substitute for it. Illinois expanded Medicaid under the Affordable Care Act; the 2025 law’s tighter directed-payment cap applies to expansion states at 100 percent of Medicare rates. Non-expansion states get a slightly higher cap. Illinois is on the tighter side of a rule written in Washington.
In the Midwest, hospitals already punch above their national weight

View exact chart values
| state | hosp_gdp_bil | total_gdp_bil | hosp_share_pct |
|---|---|---|---|
| Michigan | 24.34 | 702.5 | 3.46 |
| Pennsylvania | 32.77 | 1007.9 | 3.25 |
| Ohio | 29.51 | 923.1 | 3.2 |
| Illinois | 34.17 | 1148.1 | 2.98 |
| New York | 59.35 | 2322.1 | 2.56 |
| Florida | 40.94 | 1726.7 | 2.37 |
| California | 67.04 | 4048.1 | 1.66 |
| Texas | 43.52 | 2769.8 | 1.57 |
The jobs are still growing, which is the awkward part
If hospitals were already in retreat, the Medicaid warning would read like an obituary. The payroll numbers do not. Illinois hospital employment, as an annual average, rose from 198,300 jobs in 1997 to 252,300 in 2024 — a 27 percent increase, far slower than real output. Hospitals produced more with relatively fewer additional people. That is productivity, mix, or both; the data do not say which.
The monthly snapshot is even less helpful to the closure narrative. Using July each year, so summer hiring does not look like a boom, hospital jobs dipped from 242,300 in July 2019 to 231,200 in July 2020, then climbed to 266,600 in July 2026. That is 4.3 percent of Illinois nonfarm employment, up from 4.0 percent just before the pandemic. The broader health-care and social-assistance sector, which includes doctors’ offices and nursing homes, employed 881,500 people in July 2026, 14.3 percent of the state’s jobs.
Compensation of hospital employees — wages plus benefits — reached $26.3 billion in 2024. Spread IHA’s $3 billion five-year estimate evenly and you get about $600 million a year, or roughly 2 percent of that compensation bill and under 2 percent of 2024 hospital GDP. A 2 percent haircut is survivable for a system with fat. Safety-net and critical-access hospitals, which IHA says live on Medicaid and Medicare for more than half their revenue, do not have fat. The association’s “half of hospitals” warning is about those balance sheets, not about whether Illinois as a whole will stop employing a quarter-million hospital workers.
KFF’s $4 billion federal-share figure is larger and is not a one-year cash number. Taken as a lump against 2024 output it is about 12 percent of hospital GDP and 15 percent of compensation — enough to show that even a multi-year federal reduction is large relative to the industry, not a footnote. It is not a prediction of a 12 percent payroll cut. Do not read it that way.
Illinois hospital payrolls kept climbing after the pandemic dip

View exact chart values
| year | hosp_july_thous | hc_july_thous | nf_july_thous | hosp_share_jobs_pct | hc_share_jobs_pct |
|---|---|---|---|---|---|
| 2000 | 215.7 | 574.7 | 6041.5 | 3.57 | 9.51 |
| 2001 | 216.6 | 589.6 | 5991.7 | 3.62 | 9.84 |
| 2002 | 219.9 | 599.5 | 5873.1 | 3.74 | 10.21 |
| 2003 | 222.4 | 604.4 | 5802.9 | 3.83 | 10.42 |
| 2004 | 222.9 | 611.9 | 5822.5 | 3.83 | 10.51 |
| 2005 | 226 | 624.2 | 5875 | 3.85 | 10.62 |
| 2006 | 227 | 637.3 | 5935.7 | 3.82 | 10.74 |
| 2007 | 230.2 | 650.5 | 5983 | 3.85 | 10.87 |
| 2008 | 233.6 | 666.9 | 5962 | 3.92 | 11.19 |
| 2009 | 233.2 | 676.2 | 5620.5 | 4.15 | 12.03 |
| 2010 | 230.9 | 687.3 | 5590.2 | 4.13 | 12.29 |
| 2011 | 233 | 699.8 | 5681.9 | 4.1 | 12.32 |
| 2012 | 234.1 | 712.7 | 5746.3 | 4.07 | 12.4 |
| 2013 | 231.2 | 720.2 | 5801.3 | 3.99 | 12.41 |
| 2014 | 230 | 732 | 5880.1 | 3.91 | 12.45 |
| 2015 | 232.7 | 745.8 | 5981.5 | 3.89 | 12.47 |
| 2016 | 237.9 | 757.8 | 6014.5 | 3.96 | 12.6 |
| 2017 | 241.6 | 765.2 | 6053.7 | 3.99 | 12.64 |
| 2018 | 243.7 | 773.8 | 6109 | 3.99 | 12.67 |
| 2019 | 242.3 | 785.1 | 6132.9 | 3.95 | 12.8 |
| 2020 | 231.2 | 733 | 5567.5 | 4.15 | 13.17 |
| 2021 | 233.2 | 758.9 | 5820.9 | 4.01 | 13.04 |
| 2022 | 235.1 | 779.3 | 6061.9 | 3.88 | 12.86 |
| 2023 | 245 | 813.5 | 6125 | 4 | 13.28 |
| 2024 | 251.9 | 839.8 | 6154.4 | 4.09 | 13.65 |
| 2025 | 261.1 | 867.9 | 6164.5 | 4.24 | 14.08 |
| 2026 | 266.6 | 881.5 | 6176.4 | 4.32 | 14.27 |
Households already write a hospital check
GDP measures what Illinois hospital establishments add. Household spending measures what people, through insurers and copays, pay for hospital care. They are not the same number, and the spending number is bigger. Illinois personal consumption expenditures on hospital services were $62.0 billion in 2024, or about $4,878 per person, up from $1,420 in 1997. Broader health-care consumption — outpatient services plus hospital and nursing-home care — was $9,895 per person, a hair above the U.S. figure of $9,747.
National hospital consumption was $1.49 trillion in 2024. Illinois, with 12.7 million residents, is not an extravagant outlier. It is a state whose hospital bill grew in the usual American way: faster than population, faster than jobs, and faster than real output. Population only rose from 12.2 million in 1997 to 12.7 million in 2024. The extra spending is prices and intensity, not a million new neighbors.
If hospitals close obstetric units or emergency rooms, that $4,878 does not vanish. It migrates — longer drives, delayed care, or a bigger bill at the next county over. The Medicaid directed-payment fight is, among other things, an argument about whether Illinois can keep buying the hospital capacity it already has. The official accounts say that capacity is large, still adding jobs, and already a Midwestern-sized share of the state’s economy. They do not say the coming caps are harmless. They say there is not much unused hospital sitting around to absorb them.
Illinois households now spend almost $4,900 a year on hospital care

View exact chart values
| year | hosp_gdp_mil | real_hosp_gdp_mil | total_gdp_mil | hosp_share_pct | hosp_comp_bil | pce_hosp_mil | pce_hosp_per_capita | pcap_health | hosp_emp_ann_thous |
|---|---|---|---|---|---|---|---|---|---|
| 1997 | 8680.9 | 14862.4 | 416015.1 | 2.09 | 7.5 | 17307.7 | 1420 | 2872 | 198.3 |
| 1998 | 9257 | 15316.3 | 436533.4 | 2.12 | 8.05 | 17794.8 | 1450 | 2988 | 208.8 |
| 1999 | 9864.3 | 15996 | 459971.6 | 2.14 | 8.55 | 18221.8 | 1474 | 3076 | 212.6 |
| 2000 | 10319.3 | 16399.9 | 486089.7 | 2.12 | 8.97 | 19163.2 | 1541 | 3260 | 214.5 |
| 2001 | 11110.2 | 16584.1 | 499618.4 | 2.22 | 9.56 | 20369.7 | 1631 | 3496 | 215.8 |
| 2002 | 11905.2 | 16883.9 | 511485.9 | 2.33 | 10.18 | 22034.7 | 1759 | 3742 | 218.8 |
| 2003 | 12843.4 | 17626.7 | 528577 | 2.43 | 10.91 | 23050.8 | 1836 | 3927 | 221.1 |
| 2004 | 13735.8 | 18307.8 | 560079.8 | 2.45 | 11.56 | 24478 | 1944 | 4158 | 222.1 |
| 2005 | 14465.5 | 18791.1 | 589153.7 | 2.46 | 12.12 | 26110.4 | 2071 | 4420 | 224.9 |
| 2006 | 15438.6 | 19369.9 | 624068.1 | 2.47 | 12.86 | 27823.9 | 2201 | 4641 | 226.2 |
| 2007 | 16362.5 | 19898 | 649307.4 | 2.52 | 13.59 | 30551.8 | 2406 | 4961 | 229.3 |
| 2008 | 17603.1 | 20881.6 | 649677.3 | 2.71 | 14.31 | 31259.6 | 2452 | 5116 | 232.6 |
| 2009 | 18677.4 | 21456 | 645843.2 | 2.89 | 15.2 | 32676.5 | 2553 | 5301 | 232.4 |
| 2010 | 18354.3 | 20684.3 | 663929 | 2.76 | 14.87 | 34140.8 | 2658 | 5532 | 230.3 |
| 2011 | 18919 | 21022.2 | 691805.5 | 2.73 | 15.66 | 35038.4 | 2718 | 5668 | 231.6 |
| 2012 | 19561.7 | 21215.4 | 725478 | 2.7 | 16.1 | 35911.4 | 2778 | 5801 | 232.9 |
| 2013 | 19914.1 | 21314 | 742890.9 | 2.68 | 16.38 | 37335.7 | 2881 | 5901 | 231 |
| 2014 | 20715.7 | 22012.8 | 772291.7 | 2.68 | 16.71 | 39081.4 | 3013 | 6133 | 230.4 |
| 2015 | 21973.1 | 22845.4 | 802592 | 2.74 | 17.61 | 39882.8 | 3077 | 6337 | 232.1 |
| 2016 | 23030.3 | 23359.4 | 813561.6 | 2.83 | 18.29 | 42027.1 | 3247 | 6654 | 237.6 |
| 2017 | 23973 | 23973 | 832826.8 | 2.88 | 19.04 | 43017 | 3329 | 6825 | 241 |
| 2018 | 25439.7 | 25012.6 | 871024.2 | 2.92 | 20.16 | 44253.7 | 3434 | 7064 | 242.9 |
| 2019 | 25554.7 | 24538.4 | 895601.8 | 2.85 | 20.19 | 46488.5 | 3618 | 7355 | 242.5 |
| 2020 | 25877.3 | 24359.7 | 860807.8 | 3.01 | 20.81 | 44752.3 | 3498 | 7059 | 234.8 |
| 2021 | 26889.1 | 24708.6 | 947223.9 | 2.84 | 21.02 | 49602.8 | 3905 | 7825 | 232.2 |
| 2022 | 28719.3 | 25392.3 | 1037735.9 | 2.77 | 22.6 | 52506.7 | 4164 | 8445 | 233.3 |
| 2023 | 31456.1 | 26088.4 | 1100794.1 | 2.86 | 24.36 | 57298.1 | 4535 | 9184 | 244 |
| 2024 | 34166.5 | 27056.3 | 1148106.1 | 2.98 | 26.3 | 61959.4 | 4878 | 9895 | 252.3 |
Sources and methods
This is retrospective enrichment using pinned catalogue snapshots available to the researcher, not an as-known-on-the-edition-date reconstruction. The news edition date is 2026-09-02. Extracts were pulled on 2026-09-11 from the BEA annual state GDP and income snapshot dated 2026-08-31 (release bea-regional-state-annual-2026-04-09), the BEA state PCE snapshot dated 2026-08-31 (release bea-sapce-2025-09-26), and the BLS State and Area Employment snapshot dated 2026-08-24. Later revisions may exist.
Hospital GDP is BEA NAICS 622 value added for private hospital establishments, in millions of current dollars (table SAGDP2) and millions of chained 2017 dollars (SAGDP9). It is not total hospital charges or Medicaid revenue. All-industry GDP is SAGDP2 line 1. Compensation of hospital employees (SAGDP4) is in thousands of dollars and is published through 2024. Hospital industry GDP for 2025 is missing (NA) in the extract; 2024 is the latest industry year. All-industry GDP is published through 2025. Missing values were not treated as zero.
Household hospital spending is BEA SAPCE3 hospital services in millions of current dollars. Per-person hospital spending is that total divided by BEA SAINC1 population (persons). Broader per-person health-care spending is BEA SAPCE2 health care, in dollars, covering outpatient plus hospital and nursing-home services. GDP (value added) and PCE (consumption) are different concepts and were not added or equated.
Employment is BLS SAE. Annual hospital jobs are the official NSA annual series SMU17000006562200001. Monthly hospital jobs use the NSA monthly series of the same source id; July observations were selected so seasonal hiring is not mistaken for a trend. Health care and social assistance and total nonfarm jobs are seasonally adjusted statewide series, also sampled in July for a consistent calendar comparison. Units are thousands of jobs. The annual and monthly hospital series share a source id but different frequencies; both were retained and not mixed in a single growth rate.
State comparisons use 2024 hospital GDP and 2024 all-industry GDP for Illinois, California, Texas, New York, Florida, Pennsylvania, Ohio and Michigan. Shares are hospital GDP divided by all-industry GDP, in percent. Dictionary-level state presence was not treated as proof of observations; each geography was extracted. U.S. figures are the BEA national aggregate in the same tables, not a sum of the eight states.
KFF’s about-$4 billion Illinois federal hospital-payment figure and IHA’s about-$3 billion over five years come from contemporaneous reporting, not from these extracts. Ratios of those dollar amounts to 2024 hospital GDP or compensation are scale comparisons only. They are not estimates of job losses, closures, or causal effects of the 2025 law. IHA’s five-year total was also noted as roughly $0.6 billion a year if spread evenly. Observed, estimated and projected values were kept distinct; BEA 2024 industry GDP is an official estimate, not a forecast of 2028 Medicaid payments.
Research completed 2026-09-11, for the September 2, 2026 news edition. This is retrospective analysis, not a reconstruction of information available that day.