Research
Idaho’s record grocery credit buys about two weeks of food
A record refund, next to a $6.8 billion cart
Gov. Brad Little called Idaho’s 2025 grocery tax credit the largest food-tax refund in state history: about $254.8 million already processed across 813,241 claims, beating the prior year by $49 million, with more returns still in the pipeline. That is real money. It is also easy to misread. The U.S. Bureau of Economic Analysis puts Idaho household spending on food and nonalcoholic beverages bought for off-premises consumption — the closest official stand-in for groceries — at $6.784 billion in calendar 2025. The processed credit is 3.8 percent of that bill.
Spread across Idaho’s 2.03 million residents, the processed credit is about $126 a person. The same grocery series works out to about $3,342 per person. In other words, the record refund covers roughly two weeks of the state’s food-at-home bill, not a rewrite of it. Per processed claim the check is larger — about $313 — because not every resident files, and because some taxpayers itemize for a bigger grocery refund. Either way, the arithmetic is the same: Idaho is sending back a slice of a grocery tab that has kept climbing.
Little’s office said high grocery prices are squeezing family budgets and hitting seniors hard, which is why the legislature raised the annual credit toward $155 a person in fiscal 2026, with an itemized option of up to $250. A full repeal of the grocery sales tax has not made it into law. The official consumption books cannot say whether a credit of that size changes what people buy. They can say how large the cart already is.
Idaho’s grocery bill nearly doubled in 15 years

View exact chart values
| year | food_nonalc_millions | food_bev_pc | pce_pc | gas_pc | foodsvc_pc | housing_pc | pcpi | pop | us_food_bev_pc | us_pce_pc | us_pcpi | food_share_pct | us_food_share_pct | food_pc_index_2010 | us_food_pc_index_2010 | pce_pc_index_2010 | pcpi_index_2010 | gas_pc_index_2010 | housing_pc_index_2010 |
|---|---|---|---|---|---|---|---|---|---|---|---|---|---|---|---|---|---|---|---|
| 2010 | 3437.5 | 2498 | 26608 | 1387 | 1630 | 5187 | 31958 | 1571339 | 2543 | 33164 | 40557 | 9.39 | 7.67 | 100 | 100 | 100 | 100 | 100 | 100 |
| 2011 | 3568 | 2559 | 27447 | 1628 | 1690 | 5249 | 33453 | 1586880 | 2628 | 34309 | 42650 | 9.32 | 7.66 | 102.4 | 103.3 | 103.2 | 104.7 | 117.4 | 101.2 |
| 2012 | 3760 | 2669 | 28099 | 1624 | 1757 | 5299 | 34815 | 1600611 | 2692 | 35145 | 44238 | 9.5 | 7.66 | 106.8 | 105.9 | 105.6 | 108.9 | 117.1 | 102.2 |
| 2013 | 3935.9 | 2759 | 29192 | 1656 | 1787 | 5765 | 35697 | 1618841 | 2749 | 35956 | 44402 | 9.45 | 7.65 | 110.4 | 108.1 | 109.7 | 111.7 | 119.4 | 111.1 |
| 2014 | 4225.5 | 2923 | 30149 | 1631 | 1867 | 5782 | 37101 | 1641124 | 2852 | 37194 | 46289 | 9.7 | 7.67 | 117 | 112.2 | 113.3 | 116.1 | 117.6 | 111.5 |
| 2015 | 4259.5 | 2917 | 30554 | 1269 | 1971 | 5539 | 38805 | 1663458 | 2927 | 38213 | 48062 | 9.55 | 7.66 | 116.8 | 115.1 | 114.8 | 121.4 | 91.5 | 106.8 |
| 2016 | 4579.5 | 3082 | 31591 | 1112 | 2054 | 5729 | 39640 | 1697093 | 2989 | 39238 | 48974 | 9.76 | 7.62 | 123.4 | 117.5 | 118.7 | 124 | 80.2 | 110.4 |
| 2017 | 4604.9 | 3036 | 32708 | 1277 | 2126 | 5859 | 41187 | 1734888 | 3094 | 40693 | 51006 | 9.28 | 7.6 | 121.5 | 121.7 | 122.9 | 128.9 | 92.1 | 113 |
| 2018 | 4743.9 | 3057 | 33961 | 1416 | 2251 | 6241 | 43243 | 1769305 | 3179 | 42415 | 53311 | 9 | 7.49 | 122.4 | 125 | 127.6 | 135.3 | 102.1 | 120.3 |
| 2019 | 4910.4 | 3105 | 34701 | 1293 | 2347 | 6547 | 45866 | 1808378 | 3280 | 43720 | 55567 | 8.95 | 7.5 | 124.3 | 129 | 130.4 | 143.5 | 93.2 | 126.2 |
| 2020 | 5372.4 | 3350 | 34763 | 974 | 1938 | 6818 | 49715 | 1849328 | 3624 | 42920 | 59151 | 9.64 | 8.44 | 134.1 | 142.5 | 130.6 | 155.6 | 70.2 | 131.4 |
| 2021 | 5766.3 | 3515 | 39846 | 1451 | 2409 | 7525 | 55618 | 1904855 | 3889 | 48524 | 64718 | 8.82 | 8.01 | 140.7 | 152.9 | 149.8 | 174 | 104.6 | 145.1 |
| 2022 | 6251.8 | 3746 | 43784 | 1929 | 2752 | 8391 | 57050 | 1942951 | 4174 | 52907 | 66316 | 8.56 | 7.89 | 150 | 164.1 | 164.6 | 178.5 | 139.1 | 161.8 |
| 2023 | 6429.1 | 3791 | 45712 | 1718 | 2963 | 9052 | 58454 | 1970497 | 4271 | 55746 | 70191 | 8.29 | 7.66 | 151.8 | 168 | 171.8 | 182.9 | 123.9 | 174.5 |
| 2024 | 6576.1 | 3828 | 47638 | 1610 | 3089 | 9571 | 61345 | 2000872 | 4349 | 58301 | 73634 | 8.04 | 7.46 | 153.2 | 171 | 179 | 192 | 116.1 | 184.5 |
| 2025 | 6784 | 3884 | 49627 | 1522 | 3162 | 10206 | 64200 | 2029733 | 4459 | 61062 | 77028 | 7.83 | 7.3 | 155.5 | 175.3 | 186.5 | 200.9 | 109.7 | 196.8 |
The grocery bill grew. The house grew faster.
Idaho’s off-premises food-and-nonalcoholic spending has almost doubled in current dollars since 2010, from $3.44 billion to $6.78 billion. Population did some of that work: the state added more than 450,000 residents over the same stretch. Per person, spending on food and beverages bought for home use — a slightly broader series that also includes alcohol and farm food — rose from $2,498 in 2010 to $3,884 in 2025, a 55 percent increase.
That is a real grocery inflation story. It is not Idaho’s biggest household-bill story. Over the same 2010–2025 window, per-person spending on housing and utilities nearly doubled, to $10,206. Total personal consumption per person rose 87 percent, to $49,627. Per capita personal income, on the BEA state income accounts, doubled, to $64,200. Gasoline and other energy goods, the category that usually steals the political microphone, was only 10 percent above 2010 in 2025 after a long slide and a 2022 spike. Groceries outran the pump. They did not outrun the rent, the mortgage, or the paycheck.
Nationally, per-person grocery-and-beverage spending rose faster than Idaho’s, 75 percent versus 55 percent, and the U.S. still spends more per person on that cart: $4,459 in 2025 against Idaho’s $3,884. Idaho’s grocery share of total consumption is a bit higher than the country’s, 7.8 percent versus 7.3 percent, because Idaho’s overall spending basket is thinner, not because the grocery line is fatter. That distinction matters when a governor talks about affordability. A credit aimed at the supermarket does not touch the line that actually dominates the books.
Incomes and housing outran the grocery cart

View exact chart values
| year | food_nonalc_millions | food_bev_pc | pce_pc | gas_pc | foodsvc_pc | housing_pc | pcpi | pop | us_food_bev_pc | us_pce_pc | us_pcpi | food_share_pct | us_food_share_pct | food_pc_index_2010 | us_food_pc_index_2010 | pce_pc_index_2010 | pcpi_index_2010 | gas_pc_index_2010 | housing_pc_index_2010 |
|---|---|---|---|---|---|---|---|---|---|---|---|---|---|---|---|---|---|---|---|
| 2010 | 3437.5 | 2498 | 26608 | 1387 | 1630 | 5187 | 31958 | 1571339 | 2543 | 33164 | 40557 | 9.39 | 7.67 | 100 | 100 | 100 | 100 | 100 | 100 |
| 2011 | 3568 | 2559 | 27447 | 1628 | 1690 | 5249 | 33453 | 1586880 | 2628 | 34309 | 42650 | 9.32 | 7.66 | 102.4 | 103.3 | 103.2 | 104.7 | 117.4 | 101.2 |
| 2012 | 3760 | 2669 | 28099 | 1624 | 1757 | 5299 | 34815 | 1600611 | 2692 | 35145 | 44238 | 9.5 | 7.66 | 106.8 | 105.9 | 105.6 | 108.9 | 117.1 | 102.2 |
| 2013 | 3935.9 | 2759 | 29192 | 1656 | 1787 | 5765 | 35697 | 1618841 | 2749 | 35956 | 44402 | 9.45 | 7.65 | 110.4 | 108.1 | 109.7 | 111.7 | 119.4 | 111.1 |
| 2014 | 4225.5 | 2923 | 30149 | 1631 | 1867 | 5782 | 37101 | 1641124 | 2852 | 37194 | 46289 | 9.7 | 7.67 | 117 | 112.2 | 113.3 | 116.1 | 117.6 | 111.5 |
| 2015 | 4259.5 | 2917 | 30554 | 1269 | 1971 | 5539 | 38805 | 1663458 | 2927 | 38213 | 48062 | 9.55 | 7.66 | 116.8 | 115.1 | 114.8 | 121.4 | 91.5 | 106.8 |
| 2016 | 4579.5 | 3082 | 31591 | 1112 | 2054 | 5729 | 39640 | 1697093 | 2989 | 39238 | 48974 | 9.76 | 7.62 | 123.4 | 117.5 | 118.7 | 124 | 80.2 | 110.4 |
| 2017 | 4604.9 | 3036 | 32708 | 1277 | 2126 | 5859 | 41187 | 1734888 | 3094 | 40693 | 51006 | 9.28 | 7.6 | 121.5 | 121.7 | 122.9 | 128.9 | 92.1 | 113 |
| 2018 | 4743.9 | 3057 | 33961 | 1416 | 2251 | 6241 | 43243 | 1769305 | 3179 | 42415 | 53311 | 9 | 7.49 | 122.4 | 125 | 127.6 | 135.3 | 102.1 | 120.3 |
| 2019 | 4910.4 | 3105 | 34701 | 1293 | 2347 | 6547 | 45866 | 1808378 | 3280 | 43720 | 55567 | 8.95 | 7.5 | 124.3 | 129 | 130.4 | 143.5 | 93.2 | 126.2 |
| 2020 | 5372.4 | 3350 | 34763 | 974 | 1938 | 6818 | 49715 | 1849328 | 3624 | 42920 | 59151 | 9.64 | 8.44 | 134.1 | 142.5 | 130.6 | 155.6 | 70.2 | 131.4 |
| 2021 | 5766.3 | 3515 | 39846 | 1451 | 2409 | 7525 | 55618 | 1904855 | 3889 | 48524 | 64718 | 8.82 | 8.01 | 140.7 | 152.9 | 149.8 | 174 | 104.6 | 145.1 |
| 2022 | 6251.8 | 3746 | 43784 | 1929 | 2752 | 8391 | 57050 | 1942951 | 4174 | 52907 | 66316 | 8.56 | 7.89 | 150 | 164.1 | 164.6 | 178.5 | 139.1 | 161.8 |
| 2023 | 6429.1 | 3791 | 45712 | 1718 | 2963 | 9052 | 58454 | 1970497 | 4271 | 55746 | 70191 | 8.29 | 7.66 | 151.8 | 168 | 171.8 | 182.9 | 123.9 | 174.5 |
| 2024 | 6576.1 | 3828 | 47638 | 1610 | 3089 | 9571 | 61345 | 2000872 | 4349 | 58301 | 73634 | 8.04 | 7.46 | 153.2 | 171 | 179 | 192 | 116.1 | 184.5 |
| 2025 | 6784 | 3884 | 49627 | 1522 | 3162 | 10206 | 64200 | 2029733 | 4459 | 61062 | 77028 | 7.83 | 7.3 | 155.5 | 175.3 | 186.5 | 200.9 | 109.7 | 196.8 |
Full-rate grocery tax states are not one grocery story
Reporting around the Idaho credit, citing AARP, noted that only eight states still tax groceries and that only three — Idaho, Hawaii and South Dakota — tax them at the regular sales-tax rate. If that tax were the main thing stuffing the cart, those three states might be expected to sit together at the top of the grocery bill. They do not.
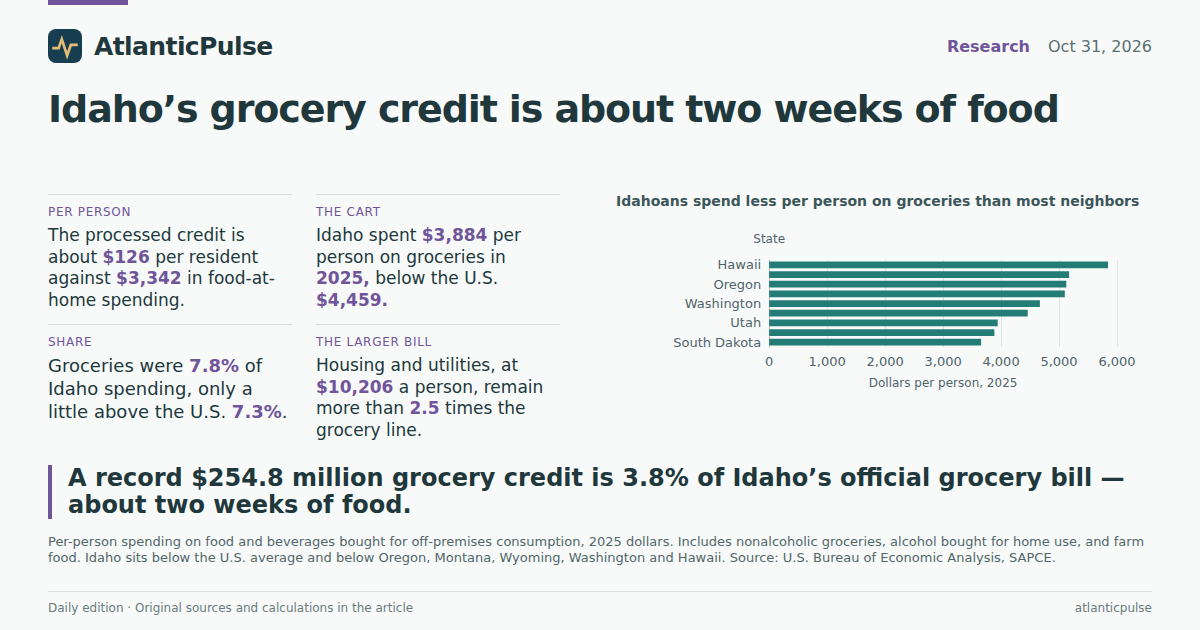
In 2025, South Dakota spent $3,655 per person on food and beverages bought for home use, the lowest figure in this comparison, and devoted only 6.4 percent of total consumption to that cart. Hawaii spent $5,844 per person, the highest here, and 9.2 percent of its basket. Idaho sat in between on the share (7.8 percent) and toward the bottom on the dollar amount. Neighbors that do not tax groceries at the full rate — Oregon, Montana, Wyoming, Washington — all spent more per person on the home-food cart than Idaho did. Utah was close to Idaho in dollars and a bit lower as a share of spending.
None of that proves the grocery tax is painless, or that a credit is pointless. Sales taxes are levied on receipts, not on BEA consumption, and a $126-a-person check is not nothing in a state whose per capita personal income still trails the national $77,028. It does mean Idaho is not an outlier because its residents buy unusually large piles of food. If anything, Idaho’s grocery cart is smaller than the country’s, and smaller than several neighbors’, while its income and its total spending are also smaller. The squeeze Little is describing is easier to see in that thinner overall budget — and in a housing-and-utilities bill more than two and a half times the grocery line — than in a claim that Idaho uniquely overpays at the supermarket.
Idahoans spend less per person on groceries than most neighbors

View exact chart values
| state | group | food_bev_pc | pce_pc | food_share_pct | pcpi |
|---|---|---|---|---|---|
| South Dakota | Full-rate grocery tax | 3655 | 56774 | 6.44 | 78999 |
| Idaho | Full-rate grocery tax | 3884 | 49627 | 7.83 | 64200 |
| Utah | Neighbor | 3942 | 54512 | 7.23 | 70323 |
| United States | National | 4459 | 61062 | 7.3 | 77028 |
| Washington | Neighbor | 4670 | 65667 | 7.11 | 88944 |
| Wyoming | Neighbor | 5099 | 62488 | 8.16 | — |
| Oregon | Neighbor | 5125 | 60667 | 8.45 | — |
| Montana | Neighbor | 5173 | 61349 | 8.43 | — |
| Hawaii | Full-rate grocery tax | 5844 | 63695 | 9.17 | 76966 |
Idaho’s grocery share is not the outlier

View exact chart values
| state | group | food_bev_pc | pce_pc | food_share_pct | pcpi |
|---|---|---|---|---|---|
| South Dakota | Full-rate grocery tax | 3655 | 56774 | 6.44 | 78999 |
| Washington | Neighbor | 4670 | 65667 | 7.11 | 88944 |
| Utah | Neighbor | 3942 | 54512 | 7.23 | 70323 |
| United States | National | 4459 | 61062 | 7.3 | 77028 |
| Idaho | Full-rate grocery tax | 3884 | 49627 | 7.83 | 64200 |
| Wyoming | Neighbor | 5099 | 62488 | 8.16 | — |
| Montana | Neighbor | 5173 | 61349 | 8.43 | — |
| Oregon | Neighbor | 5125 | 60667 | 8.45 | — |
| Hawaii | Full-rate grocery tax | 5844 | 63695 | 9.17 | 76966 |
Lower incomes, not fatter carts

View exact chart values
| state | group | food_bev_pc | pce_pc | food_share_pct | pcpi |
|---|---|---|---|---|---|
| Idaho | Full-rate grocery tax | 3884 | 49627 | 7.83 | 64200 |
| Hawaii | Full-rate grocery tax | 5844 | 63695 | 9.17 | 76966 |
| South Dakota | Full-rate grocery tax | 3655 | 56774 | 6.44 | 78999 |
| Washington | Neighbor | 4670 | 65667 | 7.11 | 88944 |
| Utah | Neighbor | 3942 | 54512 | 7.23 | 70323 |
| United States | National | 4459 | 61062 | 7.3 | 77028 |
Sources and methods
Calendar-year BEA Personal Consumption Expenditures by State (SAPCE) run through 2025 from the bea-sapce-2026-09-30 release, pinned in the AtlanticPulse research snapshot dated 2026-10-07. These are annual residence-based consumption estimates, not scanner data, taxable grocery receipts, or current-week prices. The food-and-nonalcoholic off-premises series is the closer grocery proxy; the per-person food-and-beverages series also includes alcohol bought for home use and farm food. Housing and utilities include tenant rent and the imputed rental value of owner-occupied dwellings. Gasoline and other energy goods include motor fuels and fuel oils.
State personal income and population are BEA SAINC1 annual figures through 2025 from the bea-regional-state-annual-2026-09-30 release. Per capita personal income is not household income and is not the same as the $155-per-person statutory credit. Aggregate dollars were never treated as household averages. Missing observations were left missing.
Grocery-credit dollar totals and claim counts are taken from Idaho’s 31 October 2026 announcement of processed 2025 credits, which the state said could still rise as remaining claims are paid. The credit series is a tax-administration total, not a BEA series; the 3.8 percent comparison divides processed credits by calendar-year 2025 food-and-nonalcoholic consumption. Neighbor comparisons are limited to states named in that reporting as full-rate grocery-tax peers (Hawaii, South Dakota) and contiguous or regional neighbors. The comparison does not identify all eight states that tax groceries, and it does not estimate the tax itself. No causal effect of the grocery tax or the credit is inferred from these descriptive gaps.
Research completed 2026-11-01, for the October 31, 2026 news edition. The available source data may cover earlier periods; see the observation periods and source vintages above.