Research
Idaho’s hospitals did not shrink with its OB/GYNs
The specialty is not the industry
Idahoans vote Tuesday on Proposition 1, which would repeal a near-total abortion ban, allow the procedure up to fetal viability and shield clinicians who follow the new rules. The reporting that put the measure on this page also carried a grim specialty census: a JAMA Network study found the state lost 35 percent of practicing OB/GYNs — 94 of 268 — between August 2022 and December 2024. Abortions performed in Idaho fell from 1,027 in 2022 to eight in 2025. Those figures describe a small, highly trained workforce and a procedure that has almost vanished. They do not, by themselves, tell you whether the buildings those doctors worked in emptied out.
The official payroll books say they did not. Seasonally adjusted health care and social assistance jobs in Idaho rose from 107,300 in August 2022, the month the JAMA window opens, to 128,400 in August 2026 — a gain of about 21,100 jobs, or 19.7 percent. Over the same four years, statewide total nonfarm employment rose 7.1 percent. Health care’s share of Idaho payrolls moved from 12.9 percent to 14.4 percent. That is the opposite of an industry in retreat. It is also the wrong zoom level for an obstetric collapse. NAICS 62 mixes hospitals, clinics, nursing homes and social-assistance agencies. A few dozen departing specialists can rewrite maternity care in a rural county and still round to noise in a 128,000-job series.
Idaho health-care payrolls outran the rest of the job market

View exact chart values
| period | year_month | hcsa_thousands | nonfarm_thousands | hcsa_index_aug2022 | nonfarm_index_aug2022 |
|---|---|---|---|---|---|
| 2015-01 | 2015-01 | 83.5 | 662.6 | 77.8 | 79.7 |
| 2015-02 | 2015-02 | 83.7 | 663.4 | 78 | 79.8 |
| 2015-03 | 2015-03 | 84.1 | 666.1 | 78.4 | 80.1 |
| 2015-04 | 2015-04 | 84.7 | 666.4 | 78.9 | 80.1 |
| 2015-05 | 2015-05 | 84.8 | 669.2 | 79 | 80.5 |
| 2015-06 | 2015-06 | 85.3 | 670.3 | 79.5 | 80.6 |
| 2015-07 | 2015-07 | 85.3 | 672.4 | 79.5 | 80.8 |
| 2015-08 | 2015-08 | 85.5 | 673 | 79.7 | 80.9 |
| 2015-09 | 2015-09 | 86 | 676.2 | 80.1 | 81.3 |
| 2015-10 | 2015-10 | 86 | 677.6 | 80.1 | 81.5 |
| 2015-11 | 2015-11 | 86.2 | 679.5 | 80.3 | 81.7 |
| 2015-12 | 2015-12 | 86.4 | 681.9 | 80.5 | 82 |
| 2016-01 | 2016-01 | 86 | 682.7 | 80.1 | 82.1 |
| 2016-02 | 2016-02 | 86.3 | 686.1 | 80.4 | 82.5 |
| 2016-03 | 2016-03 | 86.6 | 688.9 | 80.7 | 82.8 |
| 2016-04 | 2016-04 | 86.7 | 689.2 | 80.8 | 82.9 |
| 2016-05 | 2016-05 | 86.9 | 690.3 | 81 | 83 |
| 2016-06 | 2016-06 | 87.1 | 692.1 | 81.2 | 83.2 |
| 2016-07 | 2016-07 | 87.7 | 696.9 | 81.7 | 83.8 |
| 2016-08 | 2016-08 | 88.2 | 698.3 | 82.2 | 84 |
| 2016-09 | 2016-09 | 88.4 | 700.5 | 82.4 | 84.2 |
| 2016-10 | 2016-10 | 88.4 | 700 | 82.4 | 84.2 |
| 2016-11 | 2016-11 | 88.7 | 702.5 | 82.7 | 84.5 |
| 2016-12 | 2016-12 | 89 | 703.2 | 82.9 | 84.5 |
| 2017-01 | 2017-01 | 89.2 | 706.1 | 83.1 | 84.9 |
| 2017-02 | 2017-02 | 89.5 | 706.5 | 83.4 | 84.9 |
| 2017-03 | 2017-03 | 89.7 | 710.2 | 83.6 | 85.4 |
| 2017-04 | 2017-04 | 89.9 | 710.1 | 83.8 | 85.4 |
| 2017-05 | 2017-05 | 90 | 712.6 | 83.9 | 85.7 |
| 2017-06 | 2017-06 | 90.4 | 715.6 | 84.2 | 86 |
| 2017-07 | 2017-07 | 90.4 | 714.7 | 84.2 | 85.9 |
| 2017-08 | 2017-08 | 90.6 | 717.3 | 84.4 | 86.2 |
| 2017-09 | 2017-09 | 90.9 | 719.7 | 84.7 | 86.5 |
| 2017-10 | 2017-10 | 91 | 720 | 84.8 | 86.6 |
| 2017-11 | 2017-11 | 91.2 | 721.6 | 85 | 86.8 |
| 2017-12 | 2017-12 | 91.3 | 724 | 85.1 | 87.1 |
| 2018-01 | 2018-01 | 92.2 | 727 | 85.9 | 87.4 |
| 2018-02 | 2018-02 | 92.7 | 730.4 | 86.4 | 87.8 |
| 2018-03 | 2018-03 | 93 | 731.4 | 86.7 | 87.9 |
| 2018-04 | 2018-04 | 92.8 | 733.5 | 86.5 | 88.2 |
| 2018-05 | 2018-05 | 93.4 | 736 | 87 | 88.5 |
| 2018-06 | 2018-06 | 93.7 | 739.4 | 87.3 | 88.9 |
| 2018-07 | 2018-07 | 94.1 | 740.3 | 87.7 | 89 |
| 2018-08 | 2018-08 | 94.5 | 742.4 | 88.1 | 89.3 |
| 2018-09 | 2018-09 | 94.8 | 742 | 88.4 | 89.2 |
| 2018-10 | 2018-10 | 95.2 | 745.5 | 88.7 | 89.6 |
| 2018-11 | 2018-11 | 95.4 | 746.7 | 88.9 | 89.8 |
| 2018-12 | 2018-12 | 95.9 | 748.8 | 89.4 | 90 |
| 2019-01 | 2019-01 | 96.5 | 750.6 | 89.9 | 90.2 |
| 2019-02 | 2019-02 | 96.9 | 751.7 | 90.3 | 90.4 |
| 2019-03 | 2019-03 | 97.4 | 752.4 | 90.8 | 90.5 |
| 2019-04 | 2019-04 | 97.7 | 755.5 | 91.1 | 90.8 |
| 2019-05 | 2019-05 | 98.1 | 758.3 | 91.4 | 91.2 |
| 2019-06 | 2019-06 | 98.3 | 759 | 91.6 | 91.3 |
| 2019-07 | 2019-07 | 98.4 | 760 | 91.7 | 91.4 |
| 2019-08 | 2019-08 | 99.2 | 763.6 | 92.5 | 91.8 |
| 2019-09 | 2019-09 | 99.6 | 762.8 | 92.8 | 91.7 |
| 2019-10 | 2019-10 | 100.3 | 766.7 | 93.5 | 92.2 |
| 2019-11 | 2019-11 | 100.9 | 769.9 | 94 | 92.6 |
| 2019-12 | 2019-12 | 101 | 771.6 | 94.1 | 92.8 |
| 2020-01 | 2020-01 | 101.3 | 772.6 | 94.4 | 92.9 |
| 2020-02 | 2020-02 | 101.4 | 773.3 | 94.5 | 93 |
| 2020-03 | 2020-03 | 101.6 | 773.6 | 94.7 | 93 |
| 2020-04 | 2020-04 | 93.3 | 694.3 | 87 | 83.5 |
| 2020-05 | 2020-05 | 96.6 | 719.1 | 90 | 86.5 |
| 2020-06 | 2020-06 | 98.6 | 740.3 | 91.9 | 89 |
| 2020-07 | 2020-07 | 98.5 | 749.5 | 91.8 | 90.1 |
| 2020-08 | 2020-08 | 99.6 | 758 | 92.8 | 91.1 |
| 2020-09 | 2020-09 | 100.5 | 760.5 | 93.7 | 91.4 |
| 2020-10 | 2020-10 | 100.9 | 766.4 | 94 | 92.1 |
| 2020-11 | 2020-11 | 101.5 | 770.4 | 94.6 | 92.6 |
| 2020-12 | 2020-12 | 102.1 | 774.8 | 95.2 | 93.2 |
| 2021-01 | 2021-01 | 101.9 | 778.7 | 95 | 93.6 |
| 2021-02 | 2021-02 | 102.4 | 782.7 | 95.4 | 94.1 |
| 2021-03 | 2021-03 | 103 | 787.6 | 96 | 94.7 |
| 2021-04 | 2021-04 | 103.1 | 790.8 | 96.1 | 95.1 |
| 2021-05 | 2021-05 | 103.3 | 793 | 96.3 | 95.3 |
| 2021-06 | 2021-06 | 103.2 | 795.3 | 96.2 | 95.6 |
| 2021-07 | 2021-07 | 103.6 | 802.2 | 96.6 | 96.5 |
| 2021-08 | 2021-08 | 103.7 | 802.7 | 96.6 | 96.5 |
| 2021-09 | 2021-09 | 103.7 | 801.4 | 96.6 | 96.4 |
| 2021-10 | 2021-10 | 103.2 | 805.3 | 96.2 | 96.8 |
| 2021-11 | 2021-11 | 103.8 | 809.3 | 96.7 | 97.3 |
| 2021-12 | 2021-12 | 104.1 | 812.6 | 97 | 97.7 |
| 2022-01 | 2022-01 | 103.8 | 816.5 | 96.7 | 98.2 |
| 2022-02 | 2022-02 | 104.9 | 821.2 | 97.8 | 98.7 |
| 2022-03 | 2022-03 | 105.9 | 824.4 | 98.7 | 99.1 |
| 2022-04 | 2022-04 | 104.6 | 821.7 | 97.5 | 98.8 |
| 2022-05 | 2022-05 | 105.4 | 823 | 98.2 | 99 |
| 2022-06 | 2022-06 | 106.2 | 824.6 | 99 | 99.1 |
| 2022-07 | 2022-07 | 106.5 | 830.5 | 99.3 | 99.9 |
| 2022-08 | 2022-08 | 107.3 | 831.7 | 100 | 100 |
| 2022-09 | 2022-09 | 108 | 833.5 | 100.7 | 100.2 |
| 2022-10 | 2022-10 | 106.6 | 832.9 | 99.3 | 100.1 |
| 2022-11 | 2022-11 | 108 | 836.5 | 100.7 | 100.6 |
| 2022-12 | 2022-12 | 108.6 | 836.2 | 101.2 | 100.5 |
| 2023-01 | 2023-01 | 109 | 838.8 | 101.6 | 100.9 |
| 2023-02 | 2023-02 | 109 | 840.6 | 101.6 | 101.1 |
| 2023-03 | 2023-03 | 107.8 | 838.5 | 100.5 | 100.8 |
| 2023-04 | 2023-04 | 110.5 | 843.9 | 103 | 101.5 |
| 2023-05 | 2023-05 | 110.9 | 846.8 | 103.4 | 101.8 |
| 2023-06 | 2023-06 | 111.3 | 850.2 | 103.7 | 102.2 |
| 2023-07 | 2023-07 | 112.2 | 843.8 | 104.6 | 101.5 |
| 2023-08 | 2023-08 | 112.4 | 847.6 | 104.8 | 101.9 |
| 2023-09 | 2023-09 | 111.3 | 850.2 | 103.7 | 102.2 |
| 2023-10 | 2023-10 | 113.7 | 857.3 | 106 | 103.1 |
| 2023-11 | 2023-11 | 114.6 | 861.2 | 106.8 | 103.5 |
| 2023-12 | 2023-12 | 115.2 | 865 | 107.4 | 104 |
| 2024-01 | 2024-01 | 117.5 | 854.7 | 109.5 | 102.8 |
| 2024-02 | 2024-02 | 118.5 | 856.1 | 110.4 | 102.9 |
| 2024-03 | 2024-03 | 118 | 858.8 | 110 | 103.3 |
| 2024-04 | 2024-04 | 119 | 860.5 | 110.9 | 103.5 |
| 2024-05 | 2024-05 | 120 | 862.6 | 111.8 | 103.7 |
| 2024-06 | 2024-06 | 119.9 | 864.8 | 111.7 | 104 |
| 2024-07 | 2024-07 | 120.7 | 866.2 | 112.5 | 104.1 |
| 2024-08 | 2024-08 | 121.6 | 868.7 | 113.3 | 104.4 |
| 2024-09 | 2024-09 | 121.6 | 869.9 | 113.3 | 104.6 |
| 2024-10 | 2024-10 | 122.5 | 870.8 | 114.2 | 104.7 |
| 2024-11 | 2024-11 | 123 | 870.9 | 114.6 | 104.7 |
| 2024-12 | 2024-12 | 123.5 | 870.6 | 115.1 | 104.7 |
| 2025-01 | 2025-01 | 124.1 | 872.7 | 115.7 | 104.9 |
| 2025-02 | 2025-02 | 124.4 | 871.3 | 115.9 | 104.8 |
| 2025-03 | 2025-03 | 124.5 | 872.9 | 116 | 105 |
| 2025-04 | 2025-04 | 125.5 | 877.5 | 117 | 105.5 |
| 2025-05 | 2025-05 | 126.1 | 879.6 | 117.5 | 105.8 |
| 2025-06 | 2025-06 | 126.6 | 879.1 | 118 | 105.7 |
| 2025-07 | 2025-07 | 126.9 | 882.6 | 118.3 | 106.1 |
| 2025-08 | 2025-08 | 127 | 882.9 | 118.4 | 106.2 |
| 2025-09 | 2025-09 | 127.4 | 881.2 | 118.7 | 106 |
| 2025-10 | 2025-10 | 123.9 | 879 | 115.5 | 105.7 |
| 2025-11 | 2025-11 | 124.4 | 880.5 | 115.9 | 105.9 |
| 2025-12 | 2025-12 | 125.5 | 882.1 | 117 | 106.1 |
| 2026-01 | 2026-01 | 125.4 | 878.7 | 116.9 | 105.7 |
| 2026-02 | 2026-02 | 125.5 | 875.7 | 117 | 105.3 |
| 2026-03 | 2026-03 | 125.8 | 878.6 | 117.2 | 105.6 |
| 2026-04 | 2026-04 | 126.4 | 883.8 | 117.8 | 106.3 |
| 2026-05 | 2026-05 | 127 | 885.7 | 118.4 | 106.5 |
| 2026-06 | 2026-06 | 127.2 | 885.6 | 118.5 | 106.5 |
| 2026-07 | 2026-07 | 127.8 | 887.9 | 119.1 | 106.8 |
| 2026-08 | 2026-08 | 128.4 | 890.7 | 119.7 | 107.1 |
Hospitals added jobs faster than the neighbors
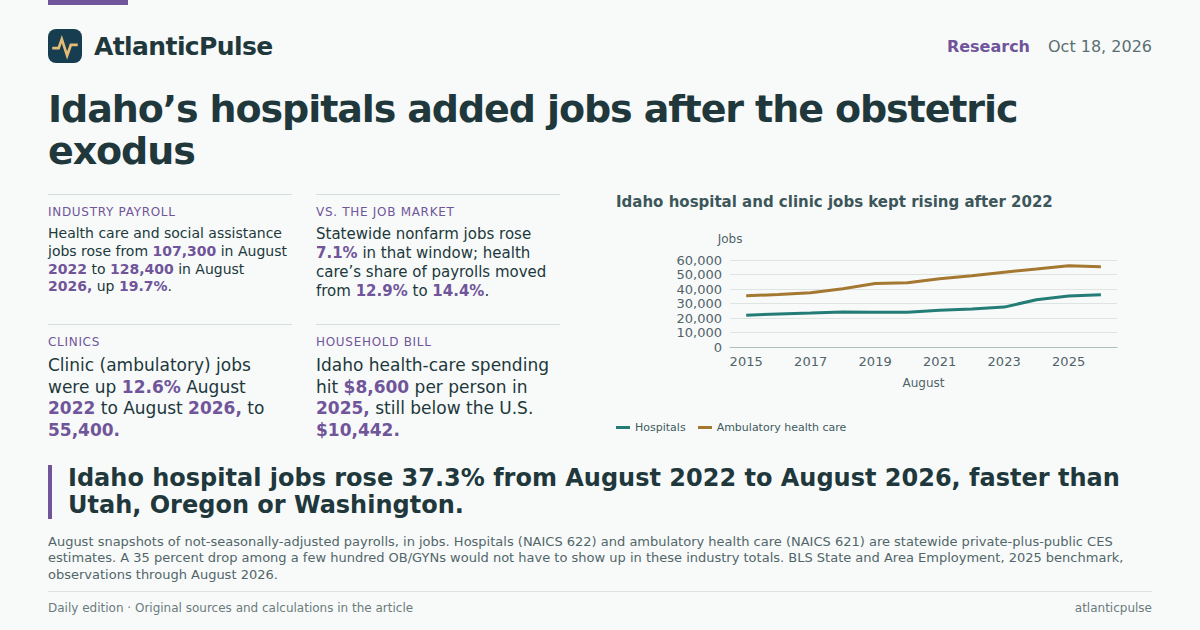
Narrow the lens to hospitals, still using August-to-August readings so the not-seasonally-adjusted series does not get mistaken for a winter cold. Idaho hospital payrolls rose from 26,300 jobs in August 2022 to 36,100 in August 2026, a 37.3 percent increase. That is a larger four-year gain than in Utah (14.1 percent), Oregon (13.0 percent) or Washington (8.2 percent) — the nearby states that publish a comparable monthly hospital series in this extract. Idaho’s hospital count was already climbing before the ban: 23,900 in August 2019, then 26,300 three years later. The post-2022 step is real, and it is not a rounding error.
It is also not a mystery solved. The CES figures count everyone on a hospital payroll — nurses, techs, administrators, cafeteria staff — not attending physicians in one specialty. A 5,100-job jump between August 2023 and August 2024 is large enough to make a data editor squint; the series carries a 2025 benchmark, and this snapshot cannot separate a new wing from a classification shift. What it can say is simpler: whatever happened to obstetric practice after 2022, Idaho did not lose hospital employment on net. Current-dollar hospital output in the BEA state GDP accounts moved the same direction, from $3.10 billion in 2022 to $4.61 billion in 2025, a 48.8 percent rise that mixes prices with activity and should not be read as a 49 percent boom in beds.
Idaho hospital and clinic jobs kept rising after 2022

View exact chart values
| year | period | hospitals_thousands | ambulatory_thousands | hospitals_jobs | ambulatory_jobs |
|---|---|---|---|---|---|
| 2015 | 2015-08 | 21.9 | 35.3 | 21900 | 35300 |
| 2016 | 2016-08 | 22.8 | 36.2 | 22800 | 36200 |
| 2017 | 2017-08 | 23.4 | 37.4 | 23400 | 37400 |
| 2018 | 2018-08 | 24.1 | 40.2 | 24100 | 40200 |
| 2019 | 2019-08 | 23.9 | 43.8 | 23900 | 43800 |
| 2020 | 2020-08 | 24 | 44.3 | 24000 | 44300 |
| 2021 | 2021-08 | 25.4 | 47.1 | 25400 | 47100 |
| 2022 | 2022-08 | 26.3 | 49.2 | 26300 | 49200 |
| 2023 | 2023-08 | 27.5 | 51.6 | 27500 | 51600 |
| 2024 | 2024-08 | 32.6 | 53.8 | 32600 | 53800 |
| 2025 | 2025-08 | 35.1 | 56.1 | 35100 | 56100 |
| 2026 | 2026-08 | 36.1 | 55.4 | 36100 | 55400 |
Idaho’s hospital payroll rose faster than nearby states

View exact chart values
| state | aug2022_thousands | aug2026_thousands | aug2022_jobs | aug2026_jobs | change_thousands | pct_change |
|---|---|---|---|---|---|---|
| Washington | 89.8 | 97.2 | 89800 | 97200 | 7.4 | 8.2 |
| Oregon | 57.6 | 65.1 | 57600 | 65100 | 7.5 | 13 |
| Utah | 39.8 | 45.4 | 39800 | 45400 | 5.6 | 14.1 |
| Idaho | 26.3 | 36.1 | 26300 | 36100 | 9.8 | 37.3 |
Clinics grew too. Nursing homes recovered.
Ambulatory health care — the NAICS bucket for physician offices, outpatient centers, home health and similar shops — is where an OB/GYN exodus would be more likely to leave a bruise. It left a shrug. Idaho ambulatory jobs rose from 49,200 in August 2022 to 55,400 in August 2026, up 12.6 percent. The latest August is a hair below August 2025’s 56,100, which is a pause, not a rout. Nominal ambulatory GDP rose from $4.33 billion in 2022 to $5.36 billion in 2025, up 23.6 percent in current dollars.
Nursing and residential care is published here only as an annual average, so it cannot be stacked onto those August snapshots. The annual series still helps: 15,400 jobs in 2019, a dip to 14,700 in 2022, then 16,500 in 2025, a 12.2 percent rebound from the 2022 low. Put the pieces next to one another and Idaho’s health labor market after the ban looks like a growing hospital system, a still-expanding clinic sector and a nursing-home payroll that had a pandemic hangover and then got some of the jobs back. None of that restores an obstetrician in a town that lost one. It does mean the Prop 1 argument about a vanishing medical workforce is, on the official books, an argument about a specialty — not about the industry’s headcount.
Idaho’s hospital output jumped in current dollars after 2022

View exact chart values
| year | hospitals_millions | ambulatory_millions |
|---|---|---|
| 2015 | 2361.6 | 2328.1 |
| 2016 | 2510.3 | 2483 |
| 2017 | 2321 | 2782.2 |
| 2018 | 2486.9 | 2991.4 |
| 2019 | 2640.9 | 3369.1 |
| 2020 | 2636.7 | 3351.9 |
| 2021 | 2881.2 | 3896.4 |
| 2022 | 3095.8 | 4332.5 |
| 2023 | 3395.7 | 4664.4 |
| 2024 | 4248.9 | 5014.7 |
| 2025 | 4607.7 | 5357 |
Households are spending more. They still spend less than the country.
If the payrolls are fattening, is the household bill exploding? Per capita health-care spending in Idaho — outpatient, hospital and nursing-home services, in current dollars — rose from $6,968 in 2022 to $8,600 in 2025, a 23.4 percent increase. That is almost identical to the U.S. increase of 23.7 percent over the same three years. The level is another story. Idaho’s $8,600 per person in 2025 sits below the national $10,442, below Oregon’s $10,758 and Montana’s $10,540, and only a little above Nevada and Utah. These are consumption totals, not insurance premiums, and they do not say whether a remaining obstetrician is harder to reach.
Neighboring health-care payrolls grew too, which is a useful check against treating Idaho as a unique boom. From August 2022 to August 2026, seasonally adjusted health care and social assistance jobs rose 19.7 percent in Idaho, 19.4 percent in both Oregon and Nevada, 13.6 percent in Utah, 10.2 percent in Montana and 4.3 percent in Wyoming. Idaho is at the front of that pack, not in a different sport. A state can lose a generation of obstetricians and still add hospital aides. The CES and BEA books are very good at the second fact. They are silent on the first.
Idaho households still spend less per person on health care

View exact chart values
| state | dollars_2025 | dollars_2022 | pct_change_2022_2025 |
|---|---|---|---|
| Oregon | 10758 | 8512 | 26.4 |
| Montana | 10540 | 8660 | 21.7 |
| United States | 10442 | 8438 | 23.7 |
| Wyoming | 10060 | 8476 | 18.7 |
| Idaho | 8600 | 6968 | 23.4 |
| Nevada | 8145 | 6809 | 19.6 |
| Utah | 7570 | 6280 | 20.5 |
Sources and methods
This is a retrospective reading of pinned BLS and BEA snapshots, not a same-day reconstruction of 18 October 2026. BLS State and Area Employment observations run through August 2026 in a snapshot dated 7 October 2026 (release identifier bls-sm-snapshot-2026-08-24, 2025 CES benchmark). BEA annual state GDP and state PCE run through calendar 2025 in releases dated 30 September 2026.
Health care and social assistance and total nonfarm are seasonally adjusted monthly CES series. Hospital and ambulatory employment are not seasonally adjusted; comparisons use August of each year so seasonal staffing is not mistaken for a trend. Nursing and residential care is an annual average and is not mixed into August totals.
Null observations were skipped and never treated as zero. Duplicate period stamps, if any, kept the first row; none appeared in the Idaho series used here. CES values are in thousands of jobs and were converted to job counts by multiplying by 1,000 and rounding. Percent changes use those thousands.
BEA hospital and ambulatory GDP are current dollars, so price change and real activity are mixed. Per capita PCE is also current dollars and is spending per resident, not a household average or an insurance premium. Neighbor-state hospital comparisons are limited to states with a matching monthly statewide hospital CES series in this extract.
Industry payrolls cannot measure obstetricians. A published loss of 94 OB/GYNs is compatible with rising hospital and clinic headcount. No causal effect of Idaho’s 2022 law, of Proposition 1, or of any single health system is inferred from these descriptive comparisons.
Research completed 2026-10-19, for the October 18, 2026 news edition. The available source data may cover earlier periods; see the observation periods and source vintages above.