Research
Hawaii’s visitor payroll never fully came back. Then the harbor went dark.
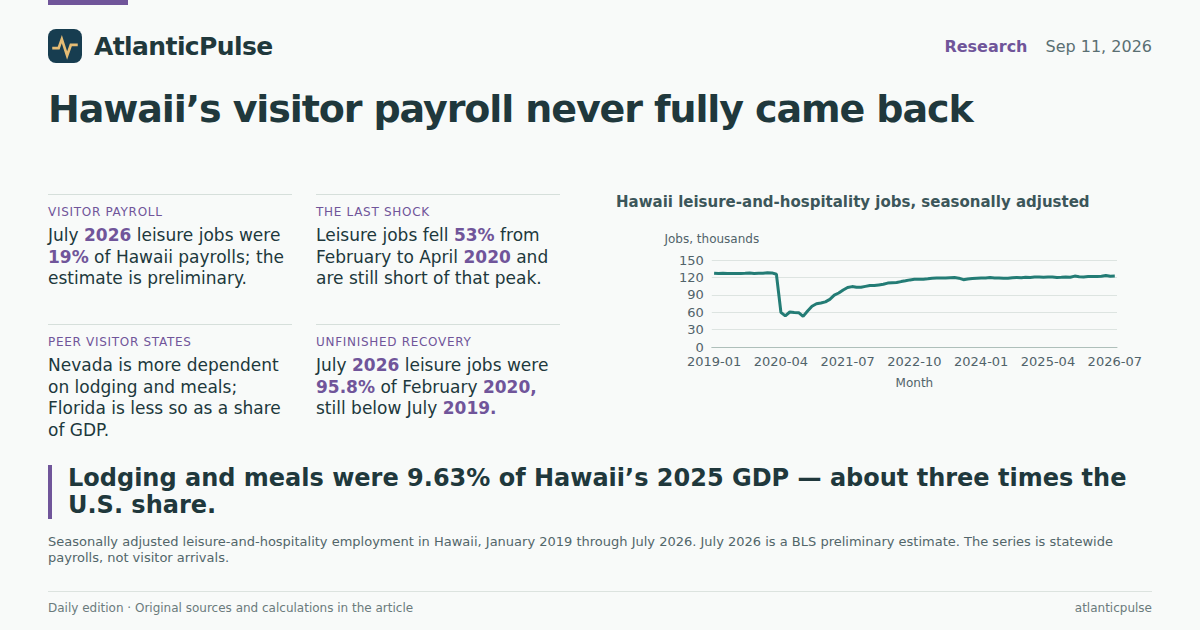
A storm on an island that lives on arrivals
Hurricane Lowell did not need to make landfall to wreck an island economy. Its center stayed offshore, but the winds that brushed Hawaii overnight Tuesday ripped up Kauai roads, blacked out most of that island’s utility customers and left Lanai’s only commercial cargo harbor inoperable — a problem for roughly 3,000 residents who take food, fuel and medicine off a single dock. Gov. Josh Green asked President Trump for an expedited disaster declaration and compared the infrastructure hit to 1992’s Hurricane Iniki. That is the live news. The quieter question is what kind of economy the storm walked into.
Hawaii is not a factory state with a visitor annex. It is a visitor state with a government, a military footprint and a thin industrial overlay, sitting 2,400 miles from the nearest continental warehouse. When a harbor closes, the same ships that restock grocery aisles also restock hotel kitchens. When the lights go out on Kauai, they go out on resorts as well as clinics. The official books cannot yet show Lowell’s damage — the latest payrolls stop in July, two months before the storm — but they can show how large the visitor sector already is, and how little slack it had recovered from the last time arrivals stopped.
That last stop was not a hurricane. It was a pandemic. The comparison is not causal; it is a scale check. If lodging and meals are a rounding error in a state’s output, a closed harbor is a local tragedy. If they are a tenth of GDP and a fifth of the payroll, a closed harbor is a statewide event wearing a tourism badge.
Lodging and meals as a share of 2025 state GDP

View exact chart values
| state | accom_food_share_pct | accom_food_bil | total_gdp_bil |
|---|---|---|---|
| Nevada | 12.88 | 36.25 | 281.45 |
| Hawaii | 9.63 | 11.99 | 124.61 |
| Florida | 4.38 | 80.39 | 1834.64 |
| United States | 3.17 | 976.49 | 30762.1 |
A tenth of output, and three times the country’s diet
In 2025, Hawaii’s current-dollar GDP was $124.61 billion, according to the Bureau of Economic Analysis’ annual state accounts. Accommodation and food services — hotels, restaurants and the rest of the lodging-and-meals sector — accounted for $11.99 billion, or 9.63 percent of that total. The same industry was 3.17 percent of U.S. GDP. Hawaii’s visitor-facing slice is about three times the national share.
Among states that sell sunshine for a living, Hawaii is not even the most exposed. Nevada’s lodging-and-meals sector was 12.88 percent of 2025 GDP. Florida, whose visitor machine is huge in dollars ($80.39 billion) but diluted by a much larger economy, sat at 4.38 percent. The ranking is the point: Hawaii is closer to a casino state than to a diversified Sun Belt. It just happens to put the casino on a beach and call it a resort.
The lodging subsector itself is a little harder to pin for 2025. BEA published the combined accommodation-and-food-services total but did not publish a 2025 value for accommodation alone — the observation is missing, not zero. In 2024, the last year that line is on the books, lodging was $7.13 billion of a $117.63 billion state economy. Utilities, the industry that just lost 90 percent of Kauai’s customers for a night, were $2.47 billion in 2025, or 1.98 percent of state GDP. Transportation and warehousing, which includes the barges and air cargo that keep an island fed, were $6.71 billion, or 5.39 percent. The visitor rooms are the large number. The pipes and docks are smaller, and less optional.
Hawaii’s lodging-and-meals share of GDP

View exact chart values
| year | total_gdp_bil | accom_food_bil | accommodation_bil | utilities_bil | transport_bil | accom_food_share_pct |
|---|---|---|---|---|---|---|
| 1997 | 37.7 | 3.34 | 2.34 | 0.87 | 2.16 | 8.86 |
| 1998 | 37.5 | 3.48 | 2.45 | 0.79 | 2.04 | 9.29 |
| 1999 | 38.97 | 3.74 | 2.62 | 0.86 | 2.02 | 9.59 |
| 2000 | 41.09 | 4.16 | 2.95 | 0.92 | 2.01 | 10.13 |
| 2001 | 42.5 | 4.12 | 2.87 | 0.9 | 1.84 | 9.68 |
| 2002 | 44.95 | 4.32 | 2.98 | 0.83 | 1.86 | 9.6 |
| 2003 | 48.42 | 4.63 | 3.17 | 0.91 | 2.04 | 9.57 |
| 2004 | 52.63 | 5.22 | 3.61 | 1.03 | 2.38 | 9.92 |
| 2005 | 57.21 | 5.66 | 3.94 | 1.05 | 2.72 | 9.89 |
| 2006 | 60.85 | 6.06 | 4.25 | 1.25 | 3 | 9.96 |
| 2007 | 64.11 | 6.05 | 4.2 | 1.29 | 2.96 | 9.44 |
| 2008 | 65.55 | 5.6 | 3.77 | 1.45 | 2.71 | 8.54 |
| 2009 | 64.46 | 4.84 | 2.99 | 1.43 | 2.72 | 7.51 |
| 2010 | 66.74 | 5.1 | 3.19 | 1.7 | 3.18 | 7.64 |
| 2011 | 68.8 | 5.56 | 3.56 | 1.98 | 3.13 | 8.08 |
| 2012 | 71.65 | 6.15 | 4.03 | 2.05 | 3.41 | 8.59 |
| 2013 | 74.6 | 6.63 | 4.36 | 2.06 | 3.61 | 8.89 |
| 2014 | 77.04 | 6.64 | 4.23 | 2.09 | 3.75 | 8.62 |
| 2015 | 81.41 | 7.28 | 4.61 | 1.87 | 4.23 | 8.94 |
| 2016 | 84.29 | 7.61 | 4.73 | 1.8 | 4.51 | 9.03 |
| 2017 | 87.44 | 8.33 | 5.21 | 1.85 | 4.79 | 9.52 |
| 2018 | 90.93 | 9.53 | 6.21 | 1.88 | 4.83 | 10.48 |
| 2019 | 93.24 | 10.01 | 6.32 | 1.86 | 5.41 | 10.73 |
| 2020 | 84.79 | 5.55 | 3.31 | 1.93 | 2.57 | 6.54 |
| 2021 | 93.68 | 7.54 | 4.35 | 2.07 | 4.24 | 8.04 |
| 2022 | 103.95 | 9.84 | 6.26 | 2.52 | 5.65 | 9.47 |
| 2023 | 111.74 | 11.09 | 6.84 | 2.53 | 6 | 9.92 |
| 2024 | 117.63 | 11.59 | 7.13 | 2.36 | 6.28 | 9.85 |
| 2025 | 124.61 | 11.99 | — | 2.47 | 6.71 | 9.63 |
The jobs are even more tourist than the GDP
Output understates the payroll. In July 2026, Hawaii had 122,400 leisure-and-hospitality jobs on a seasonally adjusted basis, according to the Bureau of Labor Statistics’ state payroll survey. That was 19.04 percent of the state’s 642,700 total nonfarm jobs. The July figure is preliminary. Nevada, again, was more dependent (22.18 percent). Florida, again, was less so in share terms (13.39 percent) even with 1.34 million leisure jobs.
A fifth of the paycheck file in hotels, restaurants and attractions is a different kind of concentration from a tenth of GDP. Real estate, government and health care plump the output accounts; they do not plump the night shift. When a storm knocks out a harbor, the GDP accounts will eventually notice the lost visitor spending. The payroll notices it first, because the people who make beds and plate poke cannot work from Phoenix.
The share has been sticky. Through 2019, leisure and hospitality held about 19 percent of Hawaii jobs, month after month. The pandemic broke that ratio: the sector’s slice of the payroll fell to 10.59 percent in May 2020. It has crawled back toward 19 percent. That is not diversification. It is the old mix reassembling itself.
Leisure jobs as a share of July 2026 payrolls

View exact chart values
| state | leisure_jobs_thousands | nonfarm_jobs_thousands | leisure_share_pct | status |
|---|---|---|---|---|
| Nevada | 357.7 | 1612.5 | 22.18 | footnote:P |
| Hawaii | 122.4 | 642.7 | 19.04 | footnote:P |
| Florida | 1344.1 | 10037.3 | 13.39 | footnote:P |
Hawaii leisure-and-hospitality jobs, seasonally adjusted

View exact chart values
| year | month | period | leisure_jobs_thousands | nonfarm_jobs_thousands | leisure_share_pct | status | leisure_index_jan2019 |
|---|---|---|---|---|---|---|---|
| 2019 | 1 | 2019-01 | 127.2 | 656.9 | 19.36 | 100 | |
| 2019 | 2 | 2019-02 | 126.7 | 658.9 | 19.23 | 99.6 | |
| 2019 | 3 | 2019-03 | 127 | 658.3 | 19.29 | 99.8 | |
| 2019 | 4 | 2019-04 | 126.9 | 657.4 | 19.3 | 99.8 | |
| 2019 | 5 | 2019-05 | 126.6 | 658.2 | 19.23 | 99.5 | |
| 2019 | 6 | 2019-06 | 126.5 | 656.5 | 19.27 | 99.4 | |
| 2019 | 7 | 2019-07 | 126.8 | 657.4 | 19.29 | 99.7 | |
| 2019 | 8 | 2019-08 | 127.1 | 656.7 | 19.35 | 99.9 | |
| 2019 | 9 | 2019-09 | 127.5 | 662.2 | 19.25 | 100.2 | |
| 2019 | 10 | 2019-10 | 126.8 | 660.8 | 19.19 | 99.7 | |
| 2019 | 11 | 2019-11 | 127.1 | 660.6 | 19.24 | 99.9 | |
| 2019 | 12 | 2019-12 | 127.1 | 659.3 | 19.28 | 99.9 | |
| 2020 | 1 | 2020-01 | 128 | 663.4 | 19.29 | 100.6 | |
| 2020 | 2 | 2020-02 | 127.7 | 662.6 | 19.27 | 100.4 | |
| 2020 | 3 | 2020-03 | 125.4 | 655.9 | 19.12 | 98.6 | |
| 2020 | 4 | 2020-04 | 59.8 | 508.9 | 11.75 | 47 | |
| 2020 | 5 | 2020-05 | 53.8 | 508.1 | 10.59 | 42.3 | |
| 2020 | 6 | 2020-06 | 60.4 | 526.3 | 11.48 | 47.5 | |
| 2020 | 7 | 2020-07 | 59.4 | 527.6 | 11.26 | 46.7 | |
| 2020 | 8 | 2020-08 | 59.2 | 529.4 | 11.18 | 46.5 | |
| 2020 | 9 | 2020-09 | 52.7 | 512.6 | 10.28 | 41.4 | |
| 2020 | 10 | 2020-10 | 62.1 | 531.1 | 11.69 | 48.8 | |
| 2020 | 11 | 2020-11 | 70.2 | 543.1 | 12.93 | 55.2 | |
| 2020 | 12 | 2020-12 | 74.4 | 551.1 | 13.5 | 58.5 | |
| 2021 | 1 | 2021-01 | 75.9 | 553.8 | 13.71 | 59.7 | |
| 2021 | 2 | 2021-02 | 77.8 | 556.4 | 13.98 | 61.2 | |
| 2021 | 3 | 2021-03 | 82 | 564.9 | 14.52 | 64.5 | |
| 2021 | 4 | 2021-04 | 89.3 | 578.5 | 15.44 | 70.2 | |
| 2021 | 5 | 2021-05 | 93.1 | 584.2 | 15.94 | 73.2 | |
| 2021 | 6 | 2021-06 | 98.3 | 591.6 | 16.62 | 77.3 | |
| 2021 | 7 | 2021-07 | 102.5 | 600.7 | 17.06 | 80.6 | |
| 2021 | 8 | 2021-08 | 104.2 | 600.5 | 17.35 | 81.9 | |
| 2021 | 9 | 2021-09 | 102.9 | 598.9 | 17.18 | 80.9 | |
| 2021 | 10 | 2021-10 | 103 | 602.4 | 17.1 | 81 | |
| 2021 | 11 | 2021-11 | 104.4 | 603.6 | 17.3 | 82.1 | |
| 2021 | 12 | 2021-12 | 106 | 606.1 | 17.49 | 83.3 | |
| 2022 | 1 | 2022-01 | 106.1 | 604.9 | 17.54 | 83.4 | |
| 2022 | 2 | 2022-02 | 107.1 | 607.5 | 17.63 | 84.2 | |
| 2022 | 3 | 2022-03 | 108.1 | 610.7 | 17.7 | 85 | |
| 2022 | 4 | 2022-04 | 110.2 | 614.4 | 17.94 | 86.6 | |
| 2022 | 5 | 2022-05 | 110.7 | 613.1 | 18.06 | 87 | |
| 2022 | 6 | 2022-06 | 111.2 | 614.9 | 18.08 | 87.4 | |
| 2022 | 7 | 2022-07 | 112.8 | 620.2 | 18.19 | 88.7 | |
| 2022 | 8 | 2022-08 | 114.1 | 622.8 | 18.32 | 89.7 | |
| 2022 | 9 | 2022-09 | 115.7 | 625.3 | 18.5 | 91 | |
| 2022 | 10 | 2022-10 | 116.7 | 627.5 | 18.6 | 91.7 | |
| 2022 | 11 | 2022-11 | 116.7 | 627.9 | 18.59 | 91.7 | |
| 2022 | 12 | 2022-12 | 116.7 | 628 | 18.58 | 91.7 | |
| 2023 | 1 | 2023-01 | 117.6 | 628.4 | 18.71 | 92.5 | |
| 2023 | 2 | 2023-02 | 118.4 | 633.2 | 18.7 | 93.1 | |
| 2023 | 3 | 2023-03 | 118.9 | 632.2 | 18.81 | 93.5 | |
| 2023 | 4 | 2023-04 | 118.9 | 633.8 | 18.76 | 93.5 | |
| 2023 | 5 | 2023-05 | 118.9 | 633.3 | 18.77 | 93.5 | |
| 2023 | 6 | 2023-06 | 119.4 | 634.6 | 18.82 | 93.9 | |
| 2023 | 7 | 2023-07 | 119.7 | 634.4 | 18.87 | 94.1 | |
| 2023 | 8 | 2023-08 | 118.6 | 631.8 | 18.77 | 93.2 | |
| 2023 | 9 | 2023-09 | 116.1 | 630.2 | 18.42 | 91.3 | |
| 2023 | 10 | 2023-10 | 117.2 | 631 | 18.57 | 92.1 | |
| 2023 | 11 | 2023-11 | 117.9 | 632.1 | 18.65 | 92.7 | |
| 2023 | 12 | 2023-12 | 118.6 | 633.7 | 18.72 | 93.2 | |
| 2024 | 1 | 2024-01 | 119.1 | 635 | 18.76 | 93.6 | |
| 2024 | 2 | 2024-02 | 119.2 | 637.3 | 18.7 | 93.7 | |
| 2024 | 3 | 2024-03 | 119.6 | 637.6 | 18.76 | 94 | |
| 2024 | 4 | 2024-04 | 119.1 | 635.3 | 18.75 | 93.6 | |
| 2024 | 5 | 2024-05 | 119.1 | 638.5 | 18.65 | 93.6 | |
| 2024 | 6 | 2024-06 | 118.5 | 636.3 | 18.62 | 93.2 | |
| 2024 | 7 | 2024-07 | 118.4 | 636.1 | 18.61 | 93.1 | |
| 2024 | 8 | 2024-08 | 119.5 | 638.3 | 18.72 | 93.9 | |
| 2024 | 9 | 2024-09 | 119.8 | 641.5 | 18.67 | 94.2 | |
| 2024 | 10 | 2024-10 | 119.5 | 641.6 | 18.63 | 93.9 | |
| 2024 | 11 | 2024-11 | 120.4 | 642.9 | 18.73 | 94.7 | |
| 2024 | 12 | 2024-12 | 120 | 641.3 | 18.71 | 94.3 | |
| 2025 | 1 | 2025-01 | 120.6 | 644 | 18.73 | 94.8 | |
| 2025 | 2 | 2025-02 | 120.6 | 641.6 | 18.8 | 94.8 | |
| 2025 | 3 | 2025-03 | 120.3 | 643.9 | 18.68 | 94.6 | |
| 2025 | 4 | 2025-04 | 120.7 | 642 | 18.8 | 94.9 | |
| 2025 | 5 | 2025-05 | 120.7 | 641.9 | 18.8 | 94.9 | |
| 2025 | 6 | 2025-06 | 120 | 639.7 | 18.76 | 94.3 | |
| 2025 | 7 | 2025-07 | 120.2 | 641.5 | 18.74 | 94.5 | |
| 2025 | 8 | 2025-08 | 120.5 | 641.7 | 18.78 | 94.7 | |
| 2025 | 9 | 2025-09 | 120.4 | 642 | 18.75 | 94.7 | |
| 2025 | 10 | 2025-10 | 122.2 | 642.8 | 19.01 | 96.1 | |
| 2025 | 11 | 2025-11 | 121.2 | 642.8 | 18.86 | 95.3 | |
| 2025 | 12 | 2025-12 | 120.9 | 641.5 | 18.85 | 95 | |
| 2026 | 1 | 2026-01 | 121.4 | 643.3 | 18.87 | 95.4 | |
| 2026 | 2 | 2026-02 | 121.6 | 643.4 | 18.9 | 95.6 | |
| 2026 | 3 | 2026-03 | 121.6 | 642.6 | 18.92 | 95.6 | |
| 2026 | 4 | 2026-04 | 121.9 | 644 | 18.93 | 95.8 | |
| 2026 | 5 | 2026-05 | 123.3 | 645.7 | 19.1 | 96.9 | |
| 2026 | 6 | 2026-06 | 122.1 | 643.2 | 18.98 | 96 | |
| 2026 | 7 | 2026-07 | 122.4 | 642.7 | 19.04 | footnote:P | 96.2 |
The last shock took half the visitor jobs. They are still not all back.
In February 2020, Hawaii’s leisure-and-hospitality payroll stood at 127,700. By April it was 59,800 — a 53.2 percent drop in two months. May was worse (53,800). The sector has been climbing for six years and still has not recrossed the old peak. July 2026’s 122,400 jobs are 95.8 percent of the February 2020 level, and still below July 2019’s 126,800.
The GDP accounts tell the same story in current dollars. Accommodation and food services fell from $10.01 billion in 2019 to $5.55 billion in 2020, a 44.6 percent drop. The sector was back above the 2019 dollar total by 2023, but that rebound includes inflation. Hawaii’s whole economy, measured in chained 2017 dollars, was only 6.0 percent larger in 2025 than in 2019. A visitor industry that needed six years to get the job count within shouting distance of its old high is not a shock absorber. It is the shock.
None of this is a forecast of Lowell’s bill. July 2026 payrolls closed before the hurricane. They do not measure Kauai outages or a two-week harbor repair. They measure the economy the storm found: one in which almost one job in five still depends on people getting off a plane, and in which those jobs had not finished climbing out of the last hole. A closed Lanai dock is a supply-chain story. A visitor payroll that never quite healed is why that story does not stay on Lanai.
Hawaii visitor-sector jobs at selected months

View exact chart values
| label | year | month | leisure_jobs_thousands | status |
|---|---|---|---|---|
| Jul 2019 | 2019 | 7 | 126.8 | |
| Apr 2020 | 2020 | 4 | 59.8 | |
| Jul 2020 | 2020 | 7 | 59.4 | |
| Jul 2023 | 2023 | 7 | 119.7 | |
| Jul 2025 | 2025 | 7 | 120.2 | |
| Jul 2026 | 2026 | 7 | 122.4 | footnote:P |
Sources and methods
BEA annual state GDP (SAGDP2, current dollars) and real GDP (SAGDP9, millions of chained 2017 dollars) are from the pinned 2026-04-09 regional release, with a normalized snapshot created 2026-08-31. Calendar-year 2025 is the latest annual observation. BLS State and Area Employment figures are monthly, statewide, seasonally adjusted except where noted, from the 2026-08-24 SM snapshot; July 2026 values carry BLS preliminary status. Observation dates are not release dates.
Shares divide published industry totals by published all-industry or total-nonfarm totals for the same geography and period. Missing values are left missing: BEA did not publish a 2025 Hawaii value for the accommodation subsector or for water transportation, so those lines are not treated as zero and are not used in 2025 composition. An implied arts-and-entertainment remainder uses the published leisure-group total minus published accommodation-and-food-services.
Nevada and Florida appear as comparison visitor economies, not as storm-hit places. The series do not measure Hurricane Lowell, visitor arrivals, or Kauai- or Lanai-specific payrolls. Statewide leisure employment is not a hotel occupancy rate. Current-dollar GDP shares mix prices and volumes; the 2019–2025 real-GDP comparison is the inflation-adjusted statewide total only. No causal effect is inferred from the descriptive comparisons.
Research completed 2026-09-12, for the September 11, 2026 news edition. The available source data may cover earlier periods; see the observation periods and source vintages above.