Research
Florida’s visitor count slipped. The tourism payroll has not.
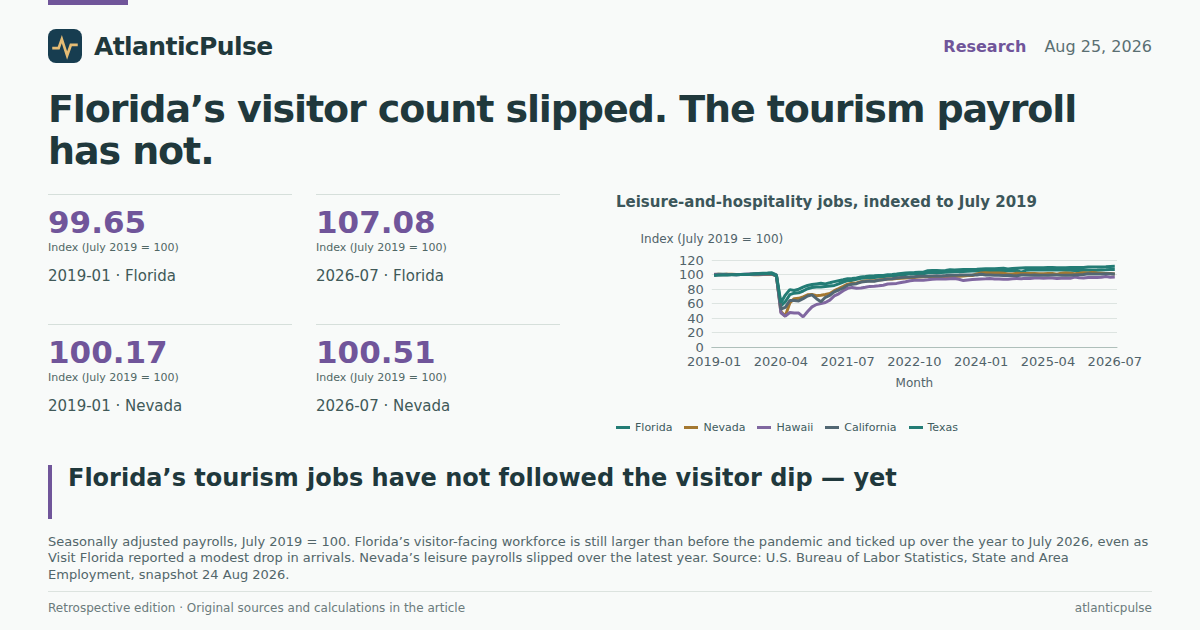
The visitor tally sagged. The hiring sheet did not.
Florida’s tourism office spent the week of 25 August 2026 explaining a number that looks small until you remember what it is attached to. Visit Florida estimated 34.01 million visitors from April through June, down 0.7 percent from a year earlier, and 73.5 million in the first half of 2026, down 1.4 percent. Canadians accounted for the sharpest drop: 1.68 million in the first six months, down 13.9 percent, and still well below the 2.29 million of early 2019. The state still hosted a record 143.3 million visitors in 2025. The new figures interrupt that climb; they do not, by themselves, tell you whether hotels, theme parks and restaurants have started sending people home. That is a jobs-and-output question, and Visit Florida’s tally is not in the official payroll or GDP files.
The Bureau of Labor Statistics answers it, at least for the part of the economy that punches a time clock. In July 2026 Florida had 1.344 million seasonally adjusted leisure-and-hospitality jobs, 13.4 percent of the state’s 10.04 million nonfarm payrolls. That is 13,200 more leisure jobs than in July 2025, a 1.0 percent increase, while total payrolls rose 0.4 percent. Accommodation and food services, the hotels-and-kitchens core of the supersector, was essentially flat: 1.059 million jobs, up 0.5 percent from a year earlier. Compared with July 2019, before the pandemic emptied the parks, leisure payrolls were still 7.1 percent higher. The visitor dip is real. A tourism-jobs recession, as of midsummer, is not.
Leisure-and-hospitality jobs, indexed to July 2019

View exact chart values
| month | Florida_index | Nevada_index | Hawaii_index | California_index | New_York_index | Texas_index | South_Carolina_index | Florida_leisure_thousands | Florida_total_thousands | Florida_leisure_share |
|---|---|---|---|---|---|---|---|---|---|---|
| 2019-01 | 99.65 | 100.17 | 100.32 | 99.2 | 100.58 | 98.73 | 98.02 | 1250.8 | 8896.2 | 14.06 |
| 2019-02 | 100.25 | 100.34 | 99.92 | 99.4 | 100.41 | 99.25 | 98.24 | 1258.4 | 8916.2 | 14.11 |
| 2019-03 | 100.36 | 100.14 | 100.16 | 99.62 | 100.67 | 99.31 | 98.5 | 1259.7 | 8929.3 | 14.11 |
| 2019-04 | 100.25 | 100.25 | 100.08 | 99.73 | 100.63 | 99.38 | 99.12 | 1258.4 | 8937.4 | 14.08 |
| 2019-05 | 100.08 | 100.22 | 99.84 | 99.8 | 100.48 | 99.61 | 99.27 | 1256.2 | 8943.1 | 14.05 |
| 2019-06 | 99.71 | 99.97 | 99.76 | 100.04 | 100.26 | 99.64 | 99.3 | 1251.6 | 8956 | 13.97 |
| 2019-07 | 100 | 100 | 100 | 100 | 100 | 100 | 100 | 1255.2 | 8969.2 | 13.99 |
| 2019-08 | 100.27 | 99.8 | 100.24 | 99.92 | 99.91 | 100.14 | 100 | 1258.6 | 8996.2 | 13.99 |
| 2019-09 | 99.85 | 99.92 | 100.55 | 100.28 | 99.93 | 100.41 | 100 | 1253.3 | 8990.9 | 13.94 |
| 2019-10 | 100.9 | 99.69 | 100 | 100.52 | 100.19 | 100.64 | 100.15 | 1266.5 | 9025.1 | 14.03 |
| 2019-11 | 101.35 | 99.78 | 100.24 | 100.74 | 100.32 | 100.91 | 100.15 | 1272.1 | 9049.2 | 14.06 |
| 2019-12 | 101.61 | 100.03 | 100.24 | 100.89 | 100.58 | 101.18 | 100.07 | 1275.4 | 9067 | 14.07 |
| 2020-01 | 101.95 | 100.11 | 100.95 | 101.1 | 100.76 | 101.37 | 99.82 | 1279.7 | 9074.6 | 14.1 |
| 2020-02 | 102.3 | 100.28 | 100.71 | 101.22 | 101.01 | 101.39 | 99.93 | 1284.1 | 9083.6 | 14.14 |
| 2020-03 | 99.62 | 98.4 | 98.9 | 97.53 | 95.07 | 98.95 | 97.36 | 1250.4 | 9023.7 | 13.86 |
| 2020-04 | 56.78 | 48.86 | 47.16 | 52.37 | 38.75 | 60.98 | 55.01 | 712.7 | 7804.3 | 9.13 |
| 2020-05 | 62.52 | 42.6 | 42.43 | 54.57 | 42.51 | 71.65 | 67.52 | 784.8 | 8044.5 | 9.76 |
| 2020-06 | 72.2 | 60.78 | 47.63 | 64.18 | 45.62 | 79.12 | 78.31 | 906.3 | 8331.6 | 10.88 |
| 2020-07 | 74.21 | 66.62 | 46.85 | 63.96 | 52.76 | 77.92 | 79.16 | 931.5 | 8373.1 | 11.12 |
| 2020-08 | 74.77 | 67.13 | 46.69 | 63.54 | 57.5 | 79.77 | 81.1 | 938.5 | 8414.4 | 11.15 |
| 2020-09 | 77.28 | 69.26 | 41.56 | 66.62 | 63.22 | 82.52 | 83.38 | 970 | 8478.8 | 11.44 |
| 2020-10 | 80.39 | 71.96 | 48.97 | 70.32 | 67.16 | 84.95 | 84.99 | 1009 | 8554.1 | 11.8 |
| 2020-11 | 82 | 72.49 | 55.36 | 71.81 | 67.02 | 86.13 | 86.79 | 1029.3 | 8589.3 | 11.98 |
| 2020-12 | 82.94 | 70.64 | 58.68 | 66.6 | 63.52 | 86.98 | 86.9 | 1041.1 | 8630.2 | 12.06 |
| 2021-01 | 82.6 | 71.42 | 59.86 | 62.34 | 63.3 | 87.89 | 87.23 | 1036.8 | 8673.2 | 11.95 |
| 2021-02 | 83.35 | 72.6 | 61.36 | 68.53 | 65.91 | 86.98 | 87.12 | 1046.2 | 8710.1 | 12.01 |
| 2021-03 | 84.05 | 73.84 | 64.67 | 71.31 | 67.63 | 88.6 | 87.56 | 1055 | 8760.6 | 12.04 |
| 2021-04 | 84.95 | 77.72 | 70.43 | 76.08 | 70.46 | 90.18 | 87.41 | 1066.3 | 8766.7 | 12.16 |
| 2021-05 | 87.19 | 80.5 | 73.42 | 78.57 | 71.81 | 91.48 | 89.06 | 1094.4 | 8831.1 | 12.39 |
| 2021-06 | 89.64 | 83.59 | 77.52 | 81.37 | 73.95 | 92.64 | 89.83 | 1125.1 | 8884.4 | 12.66 |
| 2021-07 | 91.63 | 86.63 | 80.84 | 85.25 | 77.79 | 94.23 | 91.6 | 1150.1 | 8972.1 | 12.82 |
| 2021-08 | 91.9 | 87.81 | 82.18 | 86.54 | 79.42 | 94.56 | 91.74 | 1153.5 | 8992.2 | 12.83 |
| 2021-09 | 93.36 | 88.45 | 81.15 | 87.34 | 81.39 | 95.3 | 92.77 | 1171.8 | 9040.2 | 12.96 |
| 2021-10 | 94.76 | 90.05 | 81.23 | 89.49 | 84.35 | 96.48 | 93.14 | 1189.4 | 9134.4 | 13.02 |
| 2021-11 | 95.28 | 90.92 | 82.33 | 90.21 | 85.73 | 97.04 | 93.69 | 1196 | 9171.9 | 13.04 |
| 2021-12 | 95.89 | 91.32 | 83.6 | 91.12 | 86.38 | 98.01 | 94.53 | 1203.6 | 9203.4 | 13.08 |
| 2022-01 | 95.76 | 91.43 | 83.68 | 90.65 | 85.74 | 98.21 | 95.12 | 1202 | 9219.5 | 13.04 |
| 2022-02 | 96.49 | 92.3 | 84.46 | 92.01 | 87.22 | 98.76 | 95.78 | 1211.2 | 9278.9 | 13.05 |
| 2022-03 | 96.8 | 93.26 | 85.25 | 92.81 | 88.12 | 98.71 | 95.85 | 1215 | 9298.2 | 13.07 |
| 2022-04 | 97.79 | 93.87 | 86.91 | 93.63 | 88.55 | 99.69 | 96.29 | 1227.5 | 9363.6 | 13.11 |
| 2022-05 | 98.3 | 93.99 | 87.3 | 94.22 | 89.63 | 100.15 | 96.66 | 1233.9 | 9398.1 | 13.13 |
| 2022-06 | 98.77 | 94.58 | 87.7 | 95.05 | 90.17 | 100.68 | 97.03 | 1239.8 | 9414.6 | 13.17 |
| 2022-07 | 99.79 | 94.83 | 88.96 | 95.81 | 91.59 | 101.57 | 97.58 | 1252.6 | 9488.8 | 13.2 |
| 2022-08 | 100.17 | 95.08 | 89.98 | 96.32 | 91.67 | 102.05 | 98.02 | 1257.3 | 9520.8 | 13.21 |
| 2022-09 | 101.1 | 95.9 | 91.25 | 96.61 | 92.08 | 102.35 | 98.53 | 1269 | 9564.2 | 13.27 |
| 2022-10 | 100.52 | 96.04 | 92.03 | 96.92 | 92.76 | 102.6 | 98.86 | 1261.7 | 9559.7 | 13.2 |
| 2022-11 | 100.81 | 96.35 | 92.03 | 97.48 | 93.25 | 103.1 | 99.19 | 1265.4 | 9567.1 | 13.23 |
| 2022-12 | 101.11 | 96.8 | 92.03 | 97.61 | 92.99 | 103.15 | 99.82 | 1269.1 | 9601.5 | 13.22 |
| 2023-01 | 102.44 | 96.91 | 92.74 | 97.55 | 94.08 | 105.13 | 101.25 | 1285.8 | 9646.2 | 13.33 |
| 2023-02 | 102.74 | 97.13 | 93.38 | 98.03 | 94.38 | 105.35 | 101.32 | 1289.6 | 9665.2 | 13.34 |
| 2023-03 | 102.86 | 97.27 | 93.77 | 98.39 | 94.49 | 105.59 | 101.91 | 1291.1 | 9688.7 | 13.33 |
| 2023-04 | 102.72 | 97.05 | 93.77 | 98.05 | 94.2 | 105.12 | 101.43 | 1289.4 | 9714.8 | 13.27 |
| 2023-05 | 103.23 | 97.25 | 93.77 | 98.55 | 95.1 | 105.56 | 101.5 | 1295.8 | 9741.5 | 13.3 |
| 2023-06 | 103.64 | 97.58 | 94.16 | 98.95 | 95.76 | 106.65 | 101.91 | 1300.9 | 9780.6 | 13.3 |
| 2023-07 | 103.66 | 97.39 | 94.4 | 99.07 | 95.68 | 106.37 | 102.31 | 1301.2 | 9779 | 13.31 |
| 2023-08 | 103.81 | 97.72 | 93.53 | 99.19 | 95.96 | 106.62 | 102.9 | 1303 | 9793.9 | 13.3 |
| 2023-09 | 104.25 | 98.09 | 91.56 | 99.44 | 96.06 | 106.89 | 103.3 | 1308.5 | 9823.6 | 13.32 |
| 2023-10 | 104.57 | 98.62 | 92.43 | 99.34 | 95.75 | 106.89 | 103.38 | 1312.6 | 9847.1 | 13.33 |
| 2023-11 | 105 | 98.68 | 92.98 | 99.34 | 96 | 107.07 | 103.63 | 1318 | 9853.6 | 13.38 |
| 2023-12 | 105.01 | 100.76 | 93.53 | 99.46 | 96.47 | 107.3 | 103.49 | 1318.1 | 9869.7 | 13.36 |
| 2024-01 | 105.66 | 102.16 | 93.93 | 100.37 | 96.27 | 107.75 | 103.6 | 1326.3 | 9884.6 | 13.42 |
| 2024-02 | 105.67 | 102.33 | 94.01 | 99.46 | 96.49 | 107.83 | 103.63 | 1326.4 | 9895.7 | 13.4 |
| 2024-03 | 105.76 | 102.22 | 94.32 | 99.27 | 97.01 | 107.92 | 104 | 1327.5 | 9913.4 | 13.39 |
| 2024-04 | 105.58 | 101.88 | 93.93 | 99.05 | 97.01 | 108.01 | 103.89 | 1325.3 | 9923.9 | 13.35 |
| 2024-05 | 105.66 | 102.19 | 93.93 | 99.02 | 97.02 | 108.28 | 103.93 | 1326.2 | 9932.1 | 13.35 |
| 2024-06 | 105.26 | 101.66 | 93.45 | 98.74 | 97.28 | 108.62 | 103.74 | 1321.2 | 9936.5 | 13.3 |
| 2024-07 | 105.19 | 100.79 | 93.38 | 98.86 | 96.83 | 107.78 | 102.83 | 1320.3 | 9945.1 | 13.28 |
| 2024-08 | 105.19 | 100.56 | 94.24 | 98.51 | 96.73 | 108.42 | 102.86 | 1320.3 | 9960.2 | 13.26 |
| 2024-09 | 105.76 | 101.6 | 94.48 | 98.4 | 97.41 | 108.63 | 103.49 | 1327.5 | 9986.5 | 13.29 |
| 2024-10 | 103.04 | 101.21 | 94.24 | 99.46 | 97.68 | 109.01 | 103.82 | 1293.4 | 9876.9 | 13.1 |
| 2024-11 | 105.82 | 101.52 | 94.95 | 99.3 | 97.59 | 109.18 | 103.96 | 1328.3 | 9974.4 | 13.32 |
| 2024-12 | 106.17 | 101.38 | 94.64 | 99.1 | 98.06 | 109.4 | 104.44 | 1332.7 | 9979.3 | 13.35 |
| 2025-01 | 106.25 | 101.26 | 95.11 | 99.11 | 98 | 109.36 | 103.49 | 1333.6 | 9995.9 | 13.34 |
| 2025-02 | 106.27 | 100.93 | 95.11 | 98.83 | 97.56 | 109.27 | 103.45 | 1333.9 | 10005.9 | 13.33 |
| 2025-03 | 106.25 | 100.98 | 94.87 | 98.89 | 98.13 | 109.42 | 103.82 | 1333.7 | 10015.6 | 13.32 |
| 2025-04 | 106.35 | 101.29 | 95.19 | 99.08 | 96.37 | 109.59 | 103.74 | 1334.9 | 10017.1 | 13.33 |
| 2025-05 | 106.2 | 101.4 | 95.19 | 99.29 | 97.57 | 109.7 | 103.78 | 1333 | 10013.3 | 13.31 |
| 2025-06 | 106.09 | 100.45 | 94.64 | 99.18 | 96.59 | 109.36 | 103.82 | 1331.7 | 10002.6 | 13.31 |
| 2025-07 | 106.03 | 101.69 | 94.79 | 98.9 | 97.1 | 109.3 | 103.38 | 1330.9 | 9996.3 | 13.31 |
| 2025-08 | 105.97 | 102.25 | 95.03 | 99.08 | 97.34 | 109.27 | 103.12 | 1330.1 | 9992.6 | 13.31 |
| 2025-09 | 105.84 | 101.63 | 94.95 | 98.92 | 97.15 | 109.49 | 103.08 | 1328.5 | 9985.6 | 13.3 |
| 2025-10 | 105.6 | 100.9 | 96.37 | 99.42 | 97.07 | 109.61 | 105.03 | 1325.5 | 9943 | 13.33 |
| 2025-11 | 105.68 | 101.63 | 95.58 | 99.71 | 97.54 | 109.53 | 105.06 | 1326.5 | 9947.2 | 13.34 |
| 2025-12 | 105.78 | 102.28 | 95.35 | 99.85 | 97.27 | 109.62 | 105.76 | 1327.7 | 9953.9 | 13.34 |
| 2026-01 | 105.77 | 102.25 | 95.74 | 100.93 | 97.18 | 110.5 | 105.94 | 1327.6 | 9967.4 | 13.32 |
| 2026-02 | 105.54 | 102.56 | 95.9 | 100.69 | 96.8 | 110.16 | 104.88 | 1324.8 | 9965.1 | 13.29 |
| 2026-03 | 105.97 | 101.91 | 95.9 | 100.62 | 96.79 | 110.48 | 104.88 | 1330.1 | 9992.4 | 13.31 |
| 2026-04 | 106.41 | 101.66 | 96.14 | 100.77 | 96.65 | 110.19 | 104.84 | 1335.7 | 10026.3 | 13.32 |
| 2026-05 | 106.49 | 101.21 | 97.24 | 100.94 | 96.84 | 110.59 | 105.58 | 1336.6 | 10022.2 | 13.34 |
| 2026-06 | 107.07 | 101.35 | 96.29 | 101.01 | 96.35 | 111.22 | 105.21 | 1344 | 10032.8 | 13.4 |
| 2026-07 | 107.08 | 100.51 | 96.53 | 100.64 | 95.87 | 111.46 | 104.48 | 1344.1 | 10037.3 | 13.39 |
A big employer, not a Nevada-sized economy
Share of jobs is the better way to see how exposed Florida is. Leisure and hospitality is 22.2 percent of Nevada’s July 2026 payrolls and 19.0 percent of Hawaii’s. Florida sits in a second tier, ahead of South Carolina (11.8 percent), California (11.3 percent), Texas (10.8 percent) and New York (9.2 percent). In other words, Florida has an enormous visitor workforce in headcount — more leisure jobs than Texas — without being a one-industry resort state. That also means a 1 percent visitor decline can vanish into restaurants that serve locals five nights a week.
The latest year was not kind to every tourism payroll. Nevada’s leisure jobs were down 1.2 percent from July 2025; New York’s were down 1.3 percent and remained 4.1 percent below July 2019. Hawaii was still 3.5 percent short of its pre-pandemic leisure headcount even after a 1.8 percent gain over the year. Texas added leisure jobs faster than Florida, up 2.0 percent year over year and 11.5 percent above July 2019. Florida’s pattern is the boring one: a slow grind higher, with the leisure share of statewide jobs stuck near 13.3 to 13.4 percent, a little below the 14.0 percent of July 2019.
Leisure and hospitality as a share of July 2026 payrolls

View exact chart values
| state | leisure_thousands_jul2026 | total_thousands_jul2026 | leisure_share_pct | leisure_yoy_pct | total_yoy_pct | leisure_vs_jul2019_pct | leisure_thousands_jul2019 | leisure_thousands_jul2025 |
|---|---|---|---|---|---|---|---|---|
| Nevada | 357.7 | 1612.5 | 22.18 | -1.16 | 1.1 | 0.51 | 355.9 | 361.9 |
| Hawaii | 122.4 | 642.7 | 19.04 | 1.83 | 0.19 | -3.47 | 126.8 | 120.2 |
| Florida | 1344.1 | 10037.3 | 13.39 | 0.99 | 0.41 | 7.08 | 1255.2 | 1330.9 |
| South Carolina | 284.7 | 2414.5 | 11.79 | 1.06 | 1.35 | 4.48 | 272.5 | 281.7 |
| California | 2047.4 | 18133 | 11.29 | 1.76 | 0.63 | 0.64 | 2034.3 | 2011.9 |
| Texas | 1558 | 14468 | 10.77 | 1.98 | 1.16 | 11.46 | 1397.8 | 1527.8 |
| New York | 919.7 | 9960.7 | 9.23 | -1.27 | 0.21 | -4.13 | 959.3 | 931.5 |
Six percent of GDP is a lot of money and not a lot of the economy
Payrolls overstate tourism’s weight in Florida’s output, because hotels and restaurants are labor-heavy and relatively low in value added. In 2025 the arts, entertainment, recreation, accommodation and food-services sector produced $110 billion of Florida’s $1.83 trillion current-dollar GDP, or 6.0 percent, according to the Bureau of Economic Analysis. That is more than the U.S. average of 4.3 percent, and more than California (4.5 percent) or New York (4.3 percent). It is not Nevada’s 15.7 percent, or Hawaii’s 11.0 percent. Florida can have a bad tourism season and still have an economy. Nevada is in a different argument.
Inside that $110 billion, the published 2025 files do not yet split out hotels. In 2024, the last year with the finer cut, accommodation GDP was $25.9 billion and amusement, gambling and recreation — the theme-park neighborhood — was $15.5 billion. Both series are missing for 2025; missing is not zero. Real output of the whole arts-and-hospitality group, in chained 2017 dollars, was $74.4 billion in 2025, up from $64.9 billion in 2019. The sector is larger than before the pandemic in inflation-adjusted terms. It is not racing.
Arts, lodging and food as a share of 2025 GDP

View exact chart values
| place | arts_accom_food_gdp_2025_millions | total_gdp_2025_millions | share_pct |
|---|---|---|---|
| Nevada | 44296.1 | 281453.8 | 15.74 |
| Hawaii | 13669.2 | 124607.8 | 10.97 |
| Florida | 109813.6 | 1834641.4 | 5.99 |
| California | 192325.7 | 4250840.8 | 4.52 |
| United States | 1332333 | 30762099 | 4.33 |
| New York | 106077.5 | 2467674 | 4.3 |
The rebound finished. The plateau is the news.
Quarterly figures bring the story closer to the 2026 visitor counts. Real accommodation-and-food-services GDP, at a seasonally adjusted annual rate, was $53.4 billion in 2026 Q1, 1.1 percent above 2025 Q1 and about 11 percent above 2019 Q2. The index has been bumping around 110 to 112 since late 2023. Nominal lodging-and-food output was still rising with prices, to an $82.5 billion annual rate in 2026 Q1, but its share of Florida GDP slipped to 4.3 percent from about 4.5 percent in 2019. That is a plateau with a slight lean, not a collapse, and it ends in March — before the second-quarter visitor report.
Spending data stop even earlier. Florida personal consumption on food services and accommodations was $115 billion in 2024, 7.9 percent of statewide PCE, including $20.2 billion on accommodations, both above 2019. Those dollars mix residents eating out with tourists checking in, and they cannot speak to Canadians staying home in 2026. They do show that, through the last full year on the books, people in Florida were still paying more for rooms and meals than they did before the pandemic, even after the 2020 crash.
Florida’s real lodging-and-food output has plateaued above 2019

View exact chart values
| quarter_start | real_accom_food_chained2017_millions | nominal_accom_food_saar_millions | nominal_total_saar_millions | real_index_2019q2 | nominal_share_pct |
|---|---|---|---|---|---|
| 2019-01 | 47565.6 | 50396.3 | 1109880.6 | 99.15 | 4.54 |
| 2019-04 | 47973.9 | 51404.8 | 1123239 | 100 | 4.58 |
| 2019-07 | 48107.4 | 51801.8 | 1142934 | 100.28 | 4.53 |
| 2019-10 | 48019.6 | 52028 | 1158818.5 | 100.1 | 4.49 |
| 2020-01 | 43304.9 | 46721.4 | 1155692.6 | 90.27 | 4.04 |
| 2020-04 | 26687.6 | 28580.2 | 1070104 | 55.63 | 2.67 |
| 2020-07 | 37056.2 | 39768.5 | 1169183.8 | 77.24 | 3.4 |
| 2020-10 | 36106.8 | 39486.9 | 1183632.6 | 75.26 | 3.34 |
| 2021-01 | 40121.1 | 44715.1 | 1220934.8 | 83.63 | 3.66 |
| 2021-04 | 48744.5 | 54386.6 | 1279715.5 | 101.61 | 4.25 |
| 2021-07 | 51326.7 | 59745.5 | 1322673.6 | 106.99 | 4.52 |
| 2021-10 | 50246.7 | 60451.6 | 1379907.4 | 104.74 | 4.38 |
| 2022-01 | 49820.5 | 61291.1 | 1404696.9 | 103.85 | 4.36 |
| 2022-04 | 51981.4 | 64561.9 | 1451075.6 | 108.35 | 4.45 |
| 2022-07 | 52771 | 67066.9 | 1499007.3 | 110 | 4.47 |
| 2022-10 | 51424.9 | 68269.7 | 1539972.6 | 107.19 | 4.43 |
| 2023-01 | 52570.3 | 70988.4 | 1584302.7 | 109.58 | 4.48 |
| 2023-04 | 51773.2 | 72245 | 1606758.8 | 107.92 | 4.5 |
| 2023-07 | 52976.8 | 74522.6 | 1637521.4 | 110.43 | 4.55 |
| 2023-10 | 53582.1 | 76406.4 | 1669986.2 | 111.69 | 4.58 |
| 2024-01 | 53681.2 | 77257.7 | 1690354.5 | 111.9 | 4.57 |
| 2024-04 | 53191.7 | 77650.8 | 1710819.7 | 110.88 | 4.54 |
| 2024-07 | 53568.2 | 78538.1 | 1742107.4 | 111.66 | 4.51 |
| 2024-10 | 53313.7 | 78834.4 | 1763558 | 111.13 | 4.47 |
| 2025-01 | 52879.5 | 79313.2 | 1790562.2 | 110.23 | 4.43 |
| 2025-04 | 53549.3 | 80070 | 1821506.6 | 111.62 | 4.4 |
| 2025-07 | 53503.6 | 80407 | 1852346.3 | 111.53 | 4.34 |
| 2025-10 | 53521.5 | 81775.1 | 1874150.7 | 111.56 | 4.36 |
| 2026-01 | 53448.6 | 82480.2 | 1898460.6 | 111.41 | 4.34 |
Floridians and visitors still spend more on rooms and meals

View exact chart values
| year | pce_total_millions | food_services_and_accommodations_millions | accommodations_millions | food_accom_share_pct |
|---|---|---|---|---|
| 2015 | 804074.9 | 63180.1 | 14538.9 | 7.86 |
| 2016 | 835530.6 | 65641.4 | 14789.2 | 7.86 |
| 2017 | 878744.1 | 67987.6 | 15145.8 | 7.74 |
| 2018 | 929973.5 | 71991.1 | 15818.8 | 7.74 |
| 2019 | 967992.8 | 75042.3 | 16061.6 | 7.75 |
| 2020 | 966431.3 | 61931.4 | 8172.8 | 6.41 |
| 2021 | 1120231.9 | 83487.6 | 12084.5 | 7.45 |
| 2022 | 1259555.7 | 98910.9 | 17627 | 7.85 |
| 2023 | 1368161.5 | 109380.9 | 19618.3 | 7.99 |
| 2024 | 1463514.5 | 115421.6 | 20231.4 | 7.89 |
What the official books cannot say
None of this measures Canadian border crossings, airline seats, or hotel occupancy. It cannot tell you how much of Florida’s 0.7 percent visitor decline is trade-war politics, household budgets, or a market that simply ran hot in 2025. Leisure payrolls include the diner in Gainesville that never saw a snowbird. GDP includes theme parks and the neighborhood sports bar. A 14 percent drop in Canadian arrivals can be swallowed by domestic visitors and still leave July’s job count up 1 percent.
What the books do say is more useful than another round of attributing every weak quarter to Ottawa. Florida’s visitor economy is large enough that a real slump would show up in 1.3 million leisure jobs and $110 billion of output. As of July 2026 on payrolls and 2026 Q1 on GDP, that slump had not arrived. The risk Visit Florida is watching — a slower winter, if Canadians stay away — remains a 2026–27 story. The official numbers through midsummer describe a tourism machine that has stopped accelerating, not one that has thrown a rod.
Sources and methods
This is retrospective enrichment using pinned catalogue snapshots available to the research tools on 11 September 2026, not a reconstruction of what was knowable on the 25 August 2026 edition date. Later releases and revisions may be present.
Payrolls are U.S. Bureau of Labor Statistics State and Area Employment, seasonally adjusted statewide totals, employees in thousands, from the 24 August 2026 snapshot, monthly from January 2019 through July 2026. July 2019 is the pre-pandemic comparison month. Duplicate periods: none in the extracts used. Null observations were excluded, not treated as zero.
Annual GDP is BEA current-dollar state GDP (millions) and real GDP in chained 2017 dollars, 9 April 2026 release in the 31 August 2026 snapshot, through 2025. The arts, entertainment, recreation, accommodation and food-services grouping is NAICS 71–72. Accommodation (NAICS 721) and amusement, gambling and recreation (NAICS 713) are unpublished for Florida in 2025; those cells are omitted.
Quarterly GDP is BEA seasonally adjusted annual rates, 25 June 2026 release, through 2026 Q1. The real lodging-and-food index uses 2019 Q2 as 100. PCE is BEA state personal consumption, current dollars, 26 September 2025 release, through 2024 only.
Leisure payrolls and arts/lodging/food GDP are overlapping but not identical visitor proxies. Both include resident spending. Neither identifies Canadian or overseas visitors. Year-over-year percentages are calculated from the saved extracts; no causal inference is drawn from the Visit Florida counts to payrolls or GDP.
Research completed 2026-09-11, for the August 25, 2026 news edition. This is retrospective analysis, not a reconstruction of information available that day.
- U.S. Bureau of Labor Statistics, State and Area Employment: Source 1, Source 2
- U.S. Bureau of Economic Analysis, annual state GDP: Source 1, Source 2
- U.S. Bureau of Economic Analysis, quarterly state GDP: Source 1, Source 2
- U.S. Bureau of Economic Analysis, personal consumption expenditures by state: Source 1, Source 2