Research
Florida’s insurance bill is real. It is not the income-tax savings.
The spreadsheet that stops at the mailbox
A 24/7 Wall St. dispatch on August 28 put a familiar Florida complaint in numbers: retirees chase a state with no individual income tax, then the homeowners-insurance renewal and a condo special assessment arrive and the savings look smaller, or gone. The Tax Foundation figures in that piece are real. So are five-figure assessments in older coastal buildings after Florida’s post-Surfside reserve rules. The question that piece cannot answer with a statewide official series is whether insurance, as households actually consume it, has grown large enough to cancel the tax reason people moved.
The Bureau of Economic Analysis publishes the closest official statewide measure: net household insurance in personal consumption expenditures, which is premiums less benefits, in current dollars. It is not a quoted premium, not a condo assessment, and not a household average. Divided by BEA population it becomes a per-resident residual — the insurance service left after claims. Missing values were skipped; Florida’s and Texas’s zero state income taxes are recorded zeros, not gaps. The latest overlapping year for insurance, taxes and housing spending is 2024. That is late enough to test the complaint, and early enough that 2025 and 2026 premium spikes are not in the file.
Florida really does sit at the top of the insurance residual
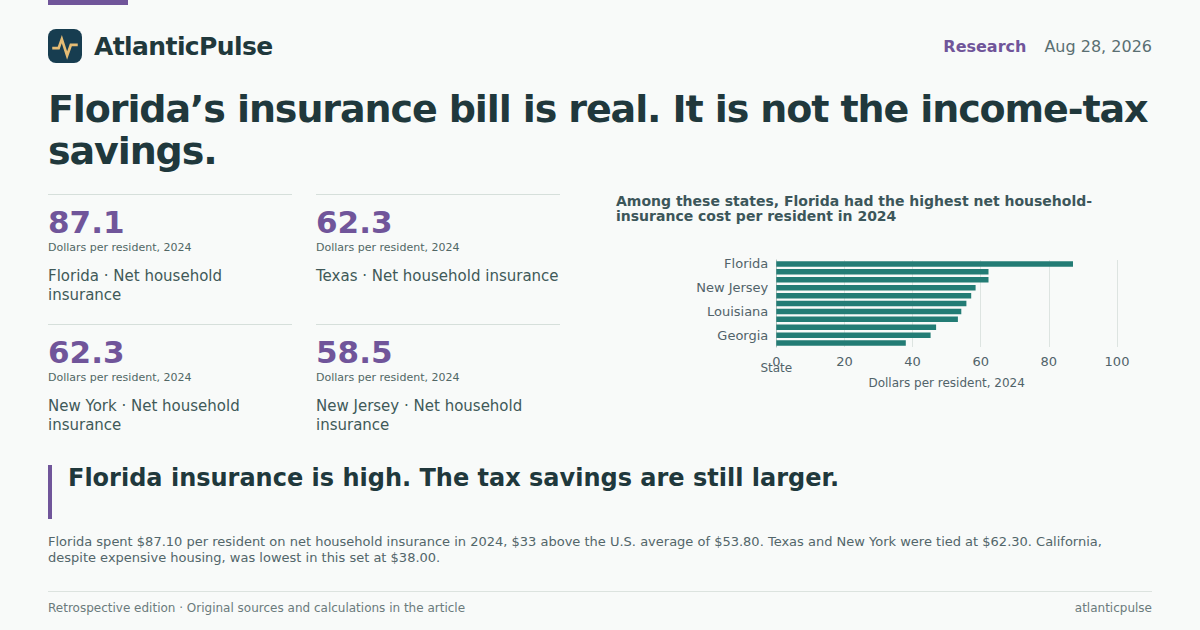
On that measure, Florida is not imagining things. Net household insurance came to $87.10 per Florida resident in 2024, up from $38.80 in 2008. The United States rose from $26.00 to $53.80. Florida’s 2024 residual was 62 percent above the national average, an extra $33.30 a person. Among the states pulled for this comparison — the origin states in the moving story, the other big no-income-tax destinations, and a cluster of hurricane-coast peers — Florida was highest. Texas and New York tied at $62.30. New Jersey was $58.50. Hawaii, often assumed to be the expensive island, was $57.20. California, despite everything else it costs, was $38.00.
The increase is not a one-year freak. Florida’s per-person residual was already $62.60 in 2019, then kept climbing through 2024. Indexed to 2008, Florida’s series reached 224.5 in 2024, a bit faster than the U.S. (206.9) and slower than New York (326.2), which started from a much lower base. Population growth does not explain Florida’s per-person rise: the state added residents, from 18.5 million in 2008 to 23.3 million in 2024, and the residual still more than doubled. What the series cannot show is the cash premium on a specific coastal condo. A market that pays out large claims can look cheaper on a net basis than it feels at renewal. Florida being highest after claims is the more uncomfortable reading: even net of benefits, the insurance service costs more here than in the states people left.
Florida’s household-insurance bill pulled away from the rest of the country

View exact chart values
| year | florida | united_states | new_york | new_jersey | california | texas | tennessee | georgia |
|---|---|---|---|---|---|---|---|---|
| 2008 | 38.8 | 26 | 19.1 | 35 | 20.8 | 26.2 | 22.3 | 25.1 |
| 2009 | 36.3 | 23.1 | 17 | 30.7 | 18.3 | 22.6 | 19.7 | 21.8 |
| 2010 | 37.7 | 23.6 | 18.6 | 30.8 | 18.4 | 23.7 | 20.1 | 21.8 |
| 2011 | 38.7 | 24.2 | 20.4 | 30.8 | 18.5 | 25 | 20.1 | 21.6 |
| 2012 | 38.4 | 23.6 | 20.6 | 29.1 | 18 | 25.3 | 19.2 | 20.3 |
| 2013 | 42.5 | 26.3 | 23.9 | 31.2 | 19.8 | 29.6 | 21.2 | 22.1 |
| 2014 | 49 | 31.2 | 29.4 | 36.7 | 23.3 | 36.5 | 25.6 | 26.4 |
| 2015 | 53.6 | 34.5 | 33 | 40.1 | 25.5 | 41.1 | 28.5 | 29.3 |
| 2016 | 57.4 | 37.2 | 35.7 | 43.3 | 27.5 | 44.8 | 31.2 | 32 |
| 2017 | 58.6 | 38.9 | 38.1 | 45.8 | 28.3 | 45.3 | 32.6 | 34.3 |
| 2018 | 58.6 | 38.6 | 39.2 | 44.3 | 27.5 | 46.7 | 32.1 | 34.4 |
| 2019 | 62.6 | 41.7 | 42.8 | 47.7 | 30 | 50.5 | 35.1 | 38.7 |
| 2020 | 65.1 | 43.3 | 45.3 | 49.1 | 31.3 | 52.1 | 36.2 | 40.5 |
| 2021 | 67.8 | 43.5 | 46.7 | 48.3 | 31.1 | 51.3 | 37.9 | 40.2 |
| 2022 | 72.4 | 45.7 | 51.8 | 49.8 | 32.4 | 53.4 | 40 | 40.4 |
| 2023 | 79.5 | 49.8 | 57.1 | 54.4 | 35.3 | 58.1 | 43.5 | 43.1 |
| 2024 | 87.1 | 53.8 | 62.3 | 58.5 | 38 | 62.3 | 46.9 | 45.3 |
Among these states, Florida had the highest net household-insurance cost per resident in 2024

View exact chart values
| state | per_capita_dollars | population | aggregate_millions |
|---|---|---|---|
| Florida | 87.1 | 23265838 | 2026.1 |
| Texas | 62.3 | 31318578 | 1949.7 |
| New York | 62.3 | 20001419 | 1246.7 |
| New Jersey | 58.5 | 9506354 | 556.2 |
| Hawaii | 57.2 | 1434952 | 82.1 |
| North Carolina | 55.8 | 11052061 | 616.8 |
| Louisiana | 54.3 | 4614878 | 250.6 |
| South Carolina | 53.3 | 5490316 | 292.5 |
| Tennessee | 46.9 | 7251291 | 339.8 |
| Georgia | 45.3 | 11204208 | 507.1 |
| California | 38 | 39364774 | 1494.9 |
Then look at the tax line the move was actually about
State government individual income taxes, also from BEA’s annual state accounts, are the line that disappears when a household leaves New York or New Jersey for Florida. In 2024 those taxes were $2,727 per New York resident, $1,985 per New Jersey resident and $3,168 per California resident. The U.S. average was $1,428. Florida and Texas are zeros. Tennessee’s leftover Hall tax was $0.30 a person. Subtract Florida’s $87 insurance residual from New York’s tax bill and $2,640 a person is still sitting on the table. Against New Jersey the leftover is $1,898. Against California it is $3,130.
That comparison is not a household budget. High earners pay more New York tax than the per-capita average; renters do not write a homeowners-insurance check; a 68-year-old couple in a 1980s oceanfront building can owe an assessment that never appears in this residual. It is also not federal tax, local income tax, or property tax. It is enough to say the statewide insurance residual does not eat the statewide income-tax reason for the move. Anyone telling you Florida’s insurance market cancelled the tax savings is mixing a real local pain with the wrong denominator.
The income-tax saving from leaving New York or New Jersey still dwarfs Florida’s insurance extra

View exact chart values
| state | state_income_tax_per_capita | net_household_insurance_per_capita | tax_minus_insurance |
|---|---|---|---|
| Florida | 0 | 87.1 | -87.1 |
| Texas | 0 | 62.3 | -62.3 |
| Tennessee | 0.3 | 46.9 | -46.6 |
| New Jersey | 1984.6 | 58.5 | 1926.1 |
| New York | 2727.1 | 62.3 | 2664.8 |
| California | 3168.2 | 38 | 3130.2 |
| United States | 1428.2 | 53.8 | 1374.5 |
Housing consumption is the offset that actually shows up
Where Florida does look expensive next to the origin states is housing itself. BEA per-capita spending on housing and utilities — tenant rent, an imputed rent for owner-occupied homes, group housing, water, electricity and gas — reached $13,435 per Florida resident in 2024. That was above California ($12,842), New Jersey ($11,874) and New York ($11,677), and well above Texas ($9,999) and Tennessee ($9,289). Florida’s figure was up 79 percent from $7,524 in 2008; the U.S. average rose 72 percent, from $6,158 to $10,595. Imputed rent is not a cash mortgage. It is the consumption of housing services. If the point of the move was a cheaper place to live, this is the series that argues otherwise.
Regional price parities split the difference. Florida’s all-items RPP was 103.4 in 2024, only a little above the national 100. Its housing RPP was 122.1 — more than a fifth above the U.S. average, and up from 115.1 in 2008. The state is not broadly costly. Its shelter is. That matches the original reporting’s warning about older coastal condos better than a story in which insurance, by itself, erases a four-figure tax line. The 24/7 Wall St. piece already said the trade still works for renters, newer inland houses, and high-income households whose origin-state tax was five figures. Official consumption data say the same thing in a drier voice: do not confuse a vicious local insurance market with a statewide tax arithmetic that still favors Florida, and do not ignore the housing bill that really did grow.
Florida’s housing-and-utilities consumption now tops New York and New Jersey

View exact chart values
| state | housing_utilities_per_capita |
|---|---|
| Florida | 13435 |
| California | 12842 |
| New Jersey | 11874 |
| New York | 11677 |
| United States | 10595 |
| Texas | 9999 |
| Tennessee | 9289 |
Florida’s housing prices, not its overall price level, are the expensive part

View exact chart values
| year | housing_rpp | all_items_rpp |
|---|---|---|
| 2008 | 115.1 | 101.7 |
| 2009 | 111 | 100.5 |
| 2010 | 108.7 | 100.4 |
| 2011 | 108.2 | 100.8 |
| 2012 | 108.8 | 101.1 |
| 2013 | 107.4 | 100.7 |
| 2014 | 108.2 | 100.9 |
| 2015 | 109.3 | 101.3 |
| 2016 | 109.4 | 101.1 |
| 2017 | 110.5 | 100.9 |
| 2018 | 110.7 | 100.3 |
| 2019 | 112 | 99.6 |
| 2020 | 113.6 | 100.6 |
| 2021 | 112.9 | 101.4 |
| 2022 | 116.3 | 102.3 |
| 2023 | 123.2 | 103.6 |
| 2024 | 122.1 | 103.4 |
Sources and methods
This is retrospective enrichment using pinned catalogue snapshots, not a reconstruction of what was knowable on the 2026-08-28 edition date. Later releases may be present. Research was run on 2026-09-11 against BEA SAPCE release bea-sapce-2025-09-26 (PCE through 2024), BEA annual state income release bea-regional-state-annual-2026-04-09 (population through 2025; personal current taxes through 2024), and BEA RPP release bea-rpp-2026-02-19 (through 2024).
Net household insurance is an aggregate of premiums less benefits in current dollars, then divided by BEA population of residents. It is not a household average, not a quoted homeowners premium, and not a special assessment. High claims reduce the net residual; Florida ranking highest after that subtraction is therefore a stronger finding than a premium survey, and still not a cash bill for any one building.
State government individual income taxes exclude federal tax, most local income taxes, and property tax. Florida and Texas zeros are recorded values. Tennessee’s small remaining Hall tax is kept. Per-capita tax is not the bill a high-income mover actually paid.
Housing and utilities PCE includes imputed rent on owner-occupied dwellings. Regional price parities index the U.S. average at 100; housing RPPs are estimated from tenant rents. Years were matched on calendar year; missing observations were skipped and never treated as zero except documented tax zeros. No causal claim is made that insurance caused migration or that migration caused insurance costs.
Research completed 2026-09-11, for the August 28, 2026 news edition. This is retrospective analysis, not a reconstruction of information available that day.