Research
Did Alabama back its reading turnaround with jobs? The payrolls say yes, with a catch
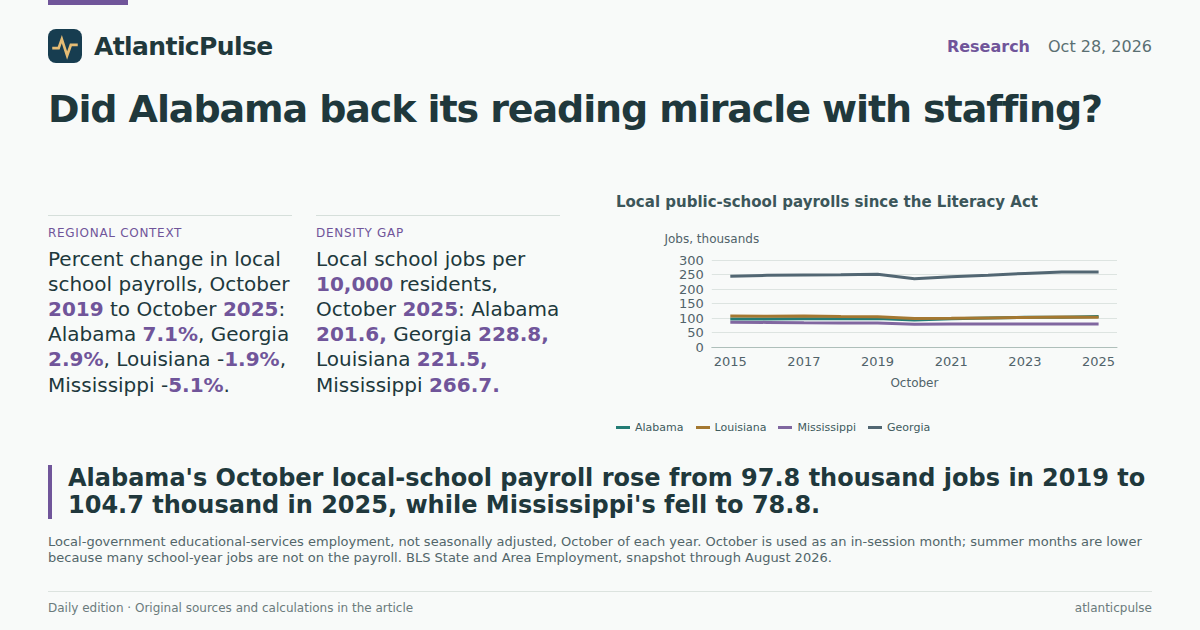
From last place to nearly average — the staffing question
Alabama's reading story keeps getting better on paper. A new Thomas B. Fordham Institute report, covered by Alabama Daily News, traces how the state went from dead last in the nation in fourth-grade reading in 2019 to nearly matching the national average five years later. Alabama was one of just two states — Louisiana was the other — where fourth-grade reading scores on the Nation's Report Card actually improved between 2019 and 2024, and an analysis of state tests cited in the report has third graders moving from about six-tenths of a grade level below the national average in 2019 to slightly above it by 2025. The report credits a rebuilt machine: roughly 750 reading specialists in elementary schools, nearly 100 regional specialists behind them, and Alabama Reading Initiative funding that climbed from $40.7 million in 2018 to $152 million for the 2026-27 fiscal year.
The report also tells a cautionary earlier chapter: Alabama's students roughly matched the national average in reading back in 2011, then the gains slipped away after the state expanded reading coaches' duties beyond the early grades and the money dried up. And it does not claim any single policy caused the recent gains — an honesty that leaves open a question the score charts cannot answer. While Alabama's fourth graders were climbing, did the state's schools actually get bigger? The federal employment record has a view. Every month the Bureau of Labor Statistics counts payroll jobs in local-government educational services, the closest official series to a public K-12 headcount. It is a blunt instrument — janitors and superintendents count alongside teachers, and no reading coach is separately identified. But if a state were genuinely rebuilding capacity, the report's own thesis that "it's people, not programs," you would expect to find it there.
Both comparison months matter, because school payrolls are seasonal by nature: they collapse every June when 9-month contracts end and rebuild in the fall. October is the first fully in-session month of the school year, and May is the last before summer breaks the count. Comparing Octobers to Octobers, and Mays to Mays, keeps the calendar from flattering anyone.
Local public-school payrolls since the Literacy Act

View exact chart values
| year | alabama | louisiana | mississippi | georgia |
|---|---|---|---|---|
| 2015 | 96.9 | 106.4 | 85.6 | 244.1 |
| 2016 | 97 | 106 | 84.8 | 247.2 |
| 2017 | 97.3 | 106.4 | 83.5 | 248.2 |
| 2018 | 97.7 | 104.9 | 83 | 249.1 |
| 2019 | 97.8 | 104.3 | 83 | 251.2 |
| 2020 | 93.4 | 98.2 | 78.3 | 235.4 |
| 2021 | 97.5 | 98.9 | 79.7 | 242.5 |
| 2022 | 100.3 | 100.2 | 79.6 | 247.1 |
| 2023 | 102.3 | 101.8 | 79.8 | 253.8 |
| 2024 | 102.8 | 103.2 | 79.5 | 258.5 |
| 2025 | 104.7 | 102.3 | 78.8 | 258.6 |
What the federal job count shows
You do find it. In October 2019, just before the pandemic scrambled everything, Alabama employed 97,800 people in local-government school jobs. By October 2025 the count was 104,700 — up 7.1 percent, about 6,900 jobs. The May numbers agree: 98,500 in May 2019 versus 106,000 in May 2026, the latest in-session month on the books, a 7.6 percent rise. Averaging September through May, the months when schools are actually staffed, the local education payroll averaged 98,000 jobs in the 2018-19 school year and 103,300 in 2024-25; the 2025-26 average, complete through May, runs 105,300. The pandemic dip is visible — 93,400 jobs in October 2020 — but the recovery carried well past it.
The split inside Alabama's education government is worth a look. Local school jobs grew 7.1 percent, but state-government education payrolls — mostly the public colleges and universities, not K-12 reading coaches — grew faster, 10.2 percent, from 70,800 to 78,000 across those Octobers. Combined, the two rose 8.4 percent, from 168,600 to 182,700. That state-side surge is largely a higher-education story, so it should not be read as a literacy program line item; it does say that Alabama's public education payroll as a whole expanded faster than its schools did.
Against the rest of Alabama's economy, the school hiring was real but not spectacular. Statewide nonfarm employment grew 5.5 percent over the same six Octobers, from 2,080,200 to 2,195,300 jobs. Indexed to October 2019, local education stood at 107.1 in October 2025 against 105.5 for total nonfarm — schools outpacing the state by about a point and a half. One methodological honesty note: the education series is not seasonally adjusted while the statewide series is, so the index compares two October snapshots rather than two smoothed trends.
Alabama’s state-campus payroll grew faster than local schools

View exact chart values
| year | local_gov_edu | state_gov_edu | combined |
|---|---|---|---|
| 2015 | 96.9 | 68.4 | 165.3 |
| 2016 | 97 | 67.9 | 164.9 |
| 2017 | 97.3 | 67.8 | 165.1 |
| 2018 | 97.7 | 68.8 | 166.5 |
| 2019 | 97.8 | 70.8 | 168.6 |
| 2020 | 93.4 | 66.7 | 160.1 |
| 2021 | 97.5 | 69.6 | 167.1 |
| 2022 | 100.3 | 71.6 | 171.9 |
| 2023 | 102.3 | 75.8 | 178.1 |
| 2024 | 102.8 | 76.4 | 179.2 |
| 2025 | 104.7 | 78 | 182.7 |
School jobs outpaced Alabama’s overall payroll after 2019

View exact chart values
| year | local_edu_index | nonfarm_index |
|---|---|---|
| 2015 | 99.1 | 95.2 |
| 2016 | 99.2 | 96.3 |
| 2017 | 99.5 | 97.4 |
| 2018 | 99.9 | 98.9 |
| 2019 | 100 | 100 |
| 2020 | 95.5 | 96.8 |
| 2021 | 99.7 | 99.6 |
| 2022 | 102.6 | 102.2 |
| 2023 | 104.6 | 104.5 |
| 2024 | 105.1 | 105.4 |
| 2025 | 107.1 | 105.5 |
The neighbors tell the sharper story
Growth is a relative word. Over the identical October 2019-to-2025 window, Louisiana's local school payrolls shrank 1.9 percent, from 104,300 to 102,300 jobs, and Mississippi's fell 5.1 percent, from 83,000 to 78,800. Georgia, the region's jobs machine, managed 2.9 percent growth, from 251,200 to 258,600. The May comparisons tell the same story with 2026 endpoints: minus 2.4 percent for Louisiana, minus 4.6 percent for Mississippi, plus 3.9 percent for Georgia.
The two states on either side of Alabama are the interesting ones. Mississippi is the model Alabama officials studied in 2018 when they were redesigning their own literacy effort, yet Mississippi's celebrated reading gains came largely before this payroll window, and its school jobs have drifted down since. Louisiana is the only other state whose fourth-grade reading scores rose from 2019 to 2024, and its school payrolls got smaller anyway. So staffing growth is not an automatic companion of reading gains; scores can rise while the payroll shrinks. What makes Alabama unusual is the combination — the only state in this comparison set whose reading rebound coincided with the region's fastest local-school hiring. The honest phrasing is that Alabama's payroll record is consistent with the staffing story the Fordham report tells, not that the job counts prove the Literacy Act moved the scores.
Alabama added local school jobs. Louisiana and Mississippi did not.

View exact chart values
| state | oct_2019_thousands | oct_2025_thousands | change_thousands | pct_change |
|---|---|---|---|---|
| Mississippi | 83 | 78.8 | -4.2 | -5.1 |
| Louisiana | 104.3 | 102.3 | -2 | -1.9 |
| Georgia | 251.2 | 258.6 | 7.4 | 2.9 |
| Alabama | 97.8 | 104.7 | 6.9 | 7.1 |
Per resident, Alabama still runs thin
There is a catch hiding in the per-capita math. Alabama's population grew only modestly, about 3.8 percent, from 5.00 million in 2019 to 5.19 million in 2025 (BEA), so hiring outpaced the headcount and staffing density rose: from 195.5 local school jobs per 10,000 residents in October 2019 to 201.6 in October 2025. But Alabama still runs the thinnest school staffing in its neighborhood. Mississippi, even after five years of shrinkage, had 266.7 jobs per 10,000 residents in October 2025, with Georgia at 228.8 and Louisiana at 221.5. Georgia's density actually fell over the period — 236.0 down to 228.8 — because its population grew faster than its school payrolls; Louisiana's slipped from 223.6 to 221.5 and Mississippi's from 279.6 to 266.7 as jobs left faster than people did.
Two readings of that gap are possible, and the data will not choose between them. A thinner base means Alabama's hiring is partly catch-up toward the staffing levels its neighbors already maintain — which would make the 7.1 percent gain look less exceptional. Or it means Alabama's per-student staffing model is simply leaner, and the additions represent real new capacity in a system that never carried the region's average payroll to begin with. What is not in dispute is direction: Alabama is the only one of the four states whose staffing density rose over the window.
Alabama still staffs local schools more thinly per resident

View exact chart values
| year | state | jobs_per_10k_residents | jobs_thousands | population |
|---|---|---|---|---|
| 2025 | Alabama | 201.6 | 104.7 | 5193088 |
| 2025 | Louisiana | 221.5 | 102.3 | 4618189 |
| 2025 | Georgia | 228.8 | 258.6 | 11302748 |
| 2025 | Mississippi | 266.7 | 78.8 | 2954160 |
The catch, and what to watch
The caveats belong next to the numbers. Payroll series count jobs, not job descriptions; nothing in the BLS files identifies a single reading coach, and the totals cannot say whether new hires were specialists, aides or bus drivers. The 2025 observations are revised official estimates and will be benchmarked again. And the whole comparison is descriptive: it shows what Alabama's payroll did while its scores climbed, not what caused the scores to move — Mississippi and Louisiana both posted reading gains in this era without matching hiring, which is exactly the kind of natural experiment that should keep anyone from mistaking correlation for legislation.
Still, the ledger is more reassuring than the alternative, and it offers the report's complacency worry something concrete to watch. The Fordham authors note that the Literacy Act's legislative sponsor is retiring, Gov. Kay Ivey leaves office in January, and the state schools chief has served longer than most of his peers. The federal books say Alabama has, for now, raised its staffing floor: six consecutive Octobers of growth since the pandemic low, a May 2026 count 7,500 jobs above May 2019, and a school-year average more than 5,000 jobs above 2018-19. If the reading scores hold through the leadership turnover, the payroll chart will be part of the explanation; if the floor gives way the way it did after 2012, the BLS lines above are where that will show up first — a couple of years before anyone convenes a blue-ribbon panel to ask what happened.
Sources and methods
BLS State and Area Employment: local-government educational services (NAICS 90931611) and state-government educational services (90921611), all employees in thousands, monthly, not seasonally adjusted; Alabama, Louisiana, Mississippi and Georgia statewide total nonfarm (seasonally adjusted) for context. Snapshot release bls-sm-snapshot-2026-08-24 (benchmark year 2025), observations through August 2026.
October and May are used as in-session comparison months because local-school payrolls fall sharply in June-August when many school-year contracts end; May 2026 is the latest in-session month available in the extract. September-May averages use all nine in-session months.
Jobs per 10,000 residents divides October employment by BEA midyear resident population from the annual personal income summary (release 2026-09-30). Population is residents of all ages; the ratio is a staffing-density indicator, not a student-teacher ratio.
The indexed comparison mixes a not-seasonally-adjusted education series with a seasonally adjusted statewide total nonfarm series; both are October observations, so it compares snapshots rather than smoothed trends.
BEA household spending on nursery, elementary and secondary schooling was extracted and computed but is deliberately not featured: it measures household purchases (largely private tuition) in nominal current dollars, is not a public-school budget or staffing measure, and would invite misreading.
Comparisons are descriptive. Payroll data cannot attribute causation to the Alabama Literacy Act, the Alabama Reading Initiative or any funding change; Mississippi and Louisiana posted reading gains without matching hiring.
Observation vintage: the BLS snapshot (built 2026-10-07, data through August 2026) and BEA releases (2026-09-30) were current for this edition date. Values are revised official estimates, not forecasts, and remain subject to benchmark revision.
Research completed 2026-10-29, for the October 28, 2026 news edition. The available source data may cover earlier periods; see the observation periods and source vintages above.
- U.S. Bureau of Labor Statistics, State and Area Employment (local and state government educational services; total nonfarm): Source 1, Source 2
- U.S. Bureau of Economic Analysis, Annual State Personal Income — Population (persons): Source 1, Source 2
- U.S. Bureau of Economic Analysis, Personal Consumption Expenditures by State (SAPCE4, extracted but not featured): Source 1, Source 2