Research
Colorado’s ski bookings sagged. The official job count has not.
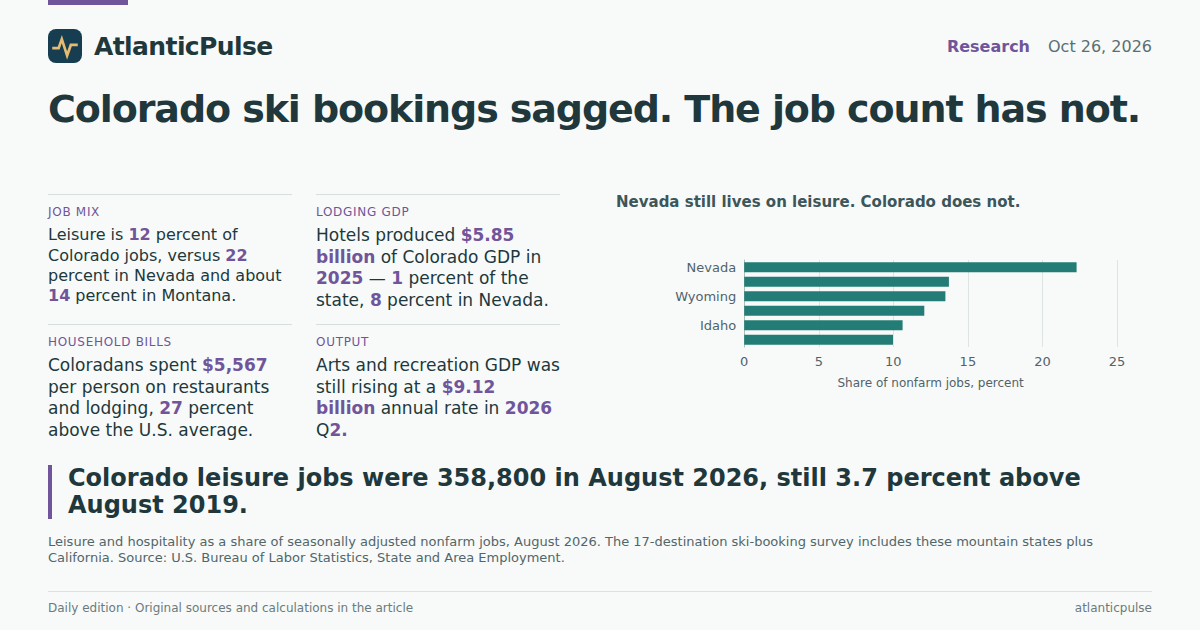
A winter warning that has not shown up as a layoff yet
Colorado’s mountain towns are being told to brace for a thinner ski season before the first reliable snowpack even arrives. Industry research covering 17 western American mountain destinations found lodging occupancy bookings for the first five months of winter 2026–27 about 8.3 percent below the year-earlier level as of 30 September, after a 5.6 percent gap had already opened by August. Average daily rates were still about 1.4 percent higher. Vail Resorts, whose mountains include several of Colorado’s marquee names, reported a 13.4 percent drop in skier visits in fiscal 2026 after Rocky Mountain snowfall ran at or near historic lows, with resort net revenue down 4.5 percent. Advance pass sales were running 12 percent lower by mid-September. The survey is regional, not a Colorado census, and later bookings can still appear if the snow does. It is, however, the kind of number that makes a hotel controller stare at a spreadsheet and wonder whether to keep the night audit fully staffed.
The official books, through August 2026, have not yet seconded the motion. Seasonally adjusted leisure and hospitality employment in Colorado stood at 358,800 jobs that month, above 346,000 in August 2019 and 349,800 in August 2025. That is a 3.7 percent gain on the last pre-pandemic August, not a collapse. Accommodation and food services, the restaurants-and-hotels bulk of the supersector, were at 296,400. Arts, entertainment and recreation — the closest statewide payroll bucket to lifts, parks and paid play — was 62,400, up from 59,000 in August 2019 but down from 64,600 a year earlier. Statewide leisure still accounts for about 12 percent of Colorado’s 2.97 million nonfarm jobs. The 2020 hole was real: leisure jobs in August 2020 were only about three-quarters of their 2019 level. They climbed back. They have not, on this evidence, started sliding again.
Colorado leisure jobs are still above 2019, even after a soft 2025

View exact chart values
| year | leisure_thousands | arts_rec_thousands | accom_food_thousands | total_nonfarm_thousands | leisure_share_pct |
|---|---|---|---|---|---|
| 2015 | 314.4 | 51.1 | 263.3 | 2545.8 | 12.35 |
| 2016 | 326.6 | 53.1 | 273.5 | 2611.7 | 12.51 |
| 2017 | 333.6 | 55.9 | 277.7 | 2667.3 | 12.51 |
| 2018 | 338.6 | 56.4 | 282.2 | 2736.3 | 12.37 |
| 2019 | 346 | 59 | 287 | 2805.4 | 12.33 |
| 2020 | 264.6 | 41.4 | 223.2 | 2623.3 | 10.09 |
| 2021 | 317.2 | 52.1 | 265.1 | 2767.1 | 11.46 |
| 2022 | 340.6 | 57.7 | 282.9 | 2878 | 11.83 |
| 2023 | 352.6 | 64.3 | 288.3 | 2947.6 | 11.96 |
| 2024 | 352.2 | 62.7 | 289.5 | 2966.3 | 11.87 |
| 2025 | 349.8 | 64.6 | 285.2 | 2963.7 | 11.8 |
| 2026 | 358.8 | 62.4 | 296.4 | 2970.3 | 12.08 |
The 2020 hole closed. The rest of Colorado’s job market grew faster.

View exact chart values
| year | leisure_index | arts_rec_index | accom_food_index | total_nonfarm_index |
|---|---|---|---|---|
| 2019 | 100 | 100 | 100 | 100 |
| 2020 | 76.5 | 70.2 | 77.8 | 93.5 |
| 2021 | 91.7 | 88.3 | 92.4 | 98.6 |
| 2022 | 98.4 | 97.8 | 98.6 | 102.6 |
| 2023 | 101.9 | 109 | 100.5 | 105.1 |
| 2024 | 101.8 | 106.3 | 100.9 | 105.7 |
| 2025 | 101.1 | 109.5 | 99.4 | 105.6 |
| 2026 | 103.7 | 105.8 | 103.3 | 105.9 |
Colorado is a mountain state. It is not a company town.
Put Colorado next to the other states in that 17-destination booking survey and the ski-state brand looks less like a payroll. In August 2026, leisure and hospitality was 22.3 percent of Nevada’s nonfarm jobs, 13.7 percent in Montana and 13.5 percent in Wyoming. Colorado’s 12.1 percent sits closer to Idaho (10.6 percent) and Utah (10.0 percent) than to a casino economy. Nevada’s leisure share has actually slipped from 24.9 percent in August 2019 even as the job count ticked up; Colorado’s share is a hair thinner than seven years earlier, 12.3 percent then versus 12.1 percent now, because the rest of the job market grew faster. Indexed to August 2019, Colorado’s total nonfarm payroll is about 6 percent higher; leisure is about 4 percent higher. The state added other work. Ski towns did not have to carry the whole expansion.
That comparison is the point of the booking scare, not a dismissal of it. A 8 percent hole in advance occupancy across western mountains would hurt Summit County even if Denver’s restaurants keep humming. Statewide seasonally adjusted counts smear ski towns into a Front Range food-service machine. They cannot tell you whether Vail’s housekeeping roster is lighter than Breckenridge’s. They can tell you that Colorado, unlike Nevada, does not live or die on a single supersector. Montana and Wyoming, with smaller job bases, have more of their employment in leisure than Colorado does. If the snow fails again, those thinner markets have less else to fall back on.
Nevada still lives on leisure. Colorado does not.

View exact chart values
| state | leisure_thousands_aug2026 | nonfarm_thousands_aug2026 | leisure_share_pct_aug2026 | leisure_share_pct_aug2019 | leisure_change_pct_aug2019_2026 |
|---|---|---|---|---|---|
| Nevada | 360.9 | 1619.4 | 22.29 | 24.92 | 1.6 |
| Montana | 71.7 | 522.1 | 13.73 | 13.82 | 6.7 |
| Wyoming | 39.9 | 295.7 | 13.49 | 12.79 | 6.97 |
| Colorado | 358.8 | 2970.3 | 12.08 | 12.33 | 3.7 |
| Idaho | 94.6 | 890.7 | 10.62 | 10.94 | 13.29 |
| Utah | 178.8 | 1791.5 | 9.98 | 9.85 | 16.1 |
Lodging is a billion-dollar industry that is still a rounding error on GDP
Output makes the same argument in a different unit. In 2025, Colorado’s accommodation industry — hotels, motels, RV parks and other short-stay lodging, not restaurants — produced $5.85 billion of current-dollar GDP. That is 42 percent more than in 2019, and it is still only 1.02 percent of a $575 billion state economy. The U.S. lodging share was 0.83 percent. Nevada’s was 8.15 percent. Wyoming and Montana, the other high-country states in the booking sample, each put a bit more than 2 percent of GDP in accommodation. Utah and Idaho were under 1 percent. Colorado’s arts, entertainment and recreation sector was larger than lodging: $8.90 billion in 2025, 1.55 percent of GDP, including amusement, gambling and recreation industries at $6.02 billion. Ski lifts sit somewhere in that mix. They do not dominate it.
The quarterly read, published at a seasonally adjusted annual rate, does not show a 2026 stall either. Colorado arts, entertainment and recreation GDP was running at $9.12 billion in the second quarter of 2026, versus $6.14 billion in the fourth quarter of 2019. That is a 49 percent rise in nominal terms, which includes price increases; it is not a picture of an industry already in retreat. None of this contradicts a soft booking curve for November through March. Annual and quarterly GDP lag the winter, and 2025’s poor snow is already in Vail’s fiscal numbers. It does mean that, on the official production accounts, Colorado has not been reduced to a ski hill with a statehouse attached.
Lodging is 1 percent of Colorado’s economy. In Nevada it is 8.

View exact chart values
| state | accommodation_gdp_2025_millions | total_gdp_2025_millions | accommodation_share_pct_2025 | accommodation_share_pct_2019 | accommodation_gdp_change_pct_2019_2025 |
|---|---|---|---|---|---|
| Nevada | 22946 | 281376.7 | 8.15 | 9.69 | 28.31 |
| Wyoming | 1113.6 | 52491.2 | 2.12 | 1.91 | 45.89 |
| Montana | 1698.4 | 80945.2 | 2.1 | 1.56 | 106.52 |
| Colorado | 5847 | 574863.9 | 1.02 | 1.03 | 42.17 |
| United States | 256433 | 30861292 | 0.83 | 0.9 | 31.6 |
| Idaho | 1106.2 | 137401.9 | 0.81 | 0.81 | 61.18 |
| Utah | 2532.4 | 319178.6 | 0.79 | 0.97 | 29.53 |
The expensive part is already on the household tab
There is one ledger where Colorado really does look like a hospitality state, and it is not the visitor one. In 2025, Coloradans spent $5,567 per person on food services and accommodations — restaurants, catering and lodging — the highest figure among the mountain states in the booking survey and 27 percent above the U.S. average of $4,377. Nevada residents, despite that 22 percent leisure payroll, spent $4,359. Wyoming spent $4,161; Utah $3,433; Idaho $3,162. Colorado’s lodging-only consumption, again by residence, was $5.02 billion in 2025, up 28 percent from 2019 after the 2020 collapse to $2.03 billion. Recreation spending by Coloradans was $46.9 billion, an order of magnitude larger, because the category includes goods and services far beyond a lift ticket.
Residence-based consumption is not a tourist receipt. It records what people who live in Colorado spend, including dinners in Denver and hotel nights they buy in other states. It does not capture a Texan’s week in Aspen. For that, the production and payroll numbers are the better window, and they say lodging is small. What the consumption figures do say is that Colorado households already carry an unusually large dining-and-lodging bill. If mountain hotels cut rates to fill a weak advance book, visitors may benefit. Residents who already spend like this will notice the grocery-versus-après-ski tradeoff either way.
The honest conclusion is narrower than a forecast. Western mountain bookings for winter 2026–27 are softer than a year earlier, after a bad snow year, and operators are being rational to worry. Through August 2026, Colorado’s seasonally adjusted leisure payroll had not turned down; it was still larger than in 2019, still about one job in eight, and still much less central than Nevada’s or even Montana’s. Lodging is a $5.8 billion industry inside a $575 billion economy. The people who already pay the most for restaurants and rooms are Coloradans themselves. A weak reservation curve can still become a weak winter. It has not, on these books, become a statewide jobs story yet.
Colorado residents already spend the most on dining and lodging

View exact chart values
| state | pcap_food_accom_2025 |
|---|---|
| Colorado | 5567 |
| United States | 4377 |
| Nevada | 4359 |
| Montana | 4304 |
| Wyoming | 4161 |
| Utah | 3433 |
| Idaho | 3162 |
Sources and methods
Payrolls are U.S. Bureau of Labor Statistics State and Area Employment series, statewide, seasonally adjusted, all employees in thousands. Comparisons use August observations so that 2026 (latest month in the pinned snapshot, through August 2026) lines up with prior Augusts. The snapshot release identifier is bls-sm-snapshot-2026-08-24. Leisure and hospitality (NAICS supersector 70) includes restaurants and hotels across the whole state, not only ski towns. Arts, entertainment and recreation and accommodation and food services are the published component series; they do not isolate ski-lift operators.
GDP figures are U.S. Bureau of Economic Analysis annual current-dollar GDP by state, 2025 the latest full year in the pinned 2026-09-30 regional release. Accommodation is NAICS 721 (hotels and other short-stay lodging), not restaurants. Arts, entertainment and recreation is NAICS 71. Quarterly arts, entertainment and recreation GDP is a seasonally adjusted annual rate, not a realized quarterly total, through 2026 Q2.
Personal consumption expenditures are BEA state PCE, 2025, by state of residence. Per-person food services and accommodations spending records what residents spend, including out of state, and does not equal tourist receipts in Colorado. Missing observations were not treated as zeros. No series was used to infer a causal effect of snowfall or bookings on jobs.
The Inntopia DestiMetrics booking figures and Vail Resorts operating results cited in the article come from stored original reporting dated 26 October 2026; they are not official statistical series. Provider lag on the pinned BLS and BEA snapshots is normal. August 2026 payrolls cannot describe winter 2026–27, which had not occurred when those observations were collected.
Research completed 2026-10-27, for the October 26, 2026 news edition. The available source data may cover earlier periods; see the observation periods and source vintages above.
- U.S. Bureau of Labor Statistics, State and Area Employment: Source 1, Source 2
- U.S. Bureau of Economic Analysis, annual GDP by state: Source 1, Source 2
- U.S. Bureau of Economic Analysis, quarterly GDP by state: Source 1, Source 2
- U.S. Bureau of Economic Analysis, personal consumption expenditures by state: Source 1, Source 2