Research
Colorado’s Medicaid hole is real. The household health bill is not the whole story
A TABOR squeeze, not a mystery illness
Colorado’s Joint Budget Committee got the kind of Friday briefing that makes appropriations staff reach for extra coffee. State economists told lawmakers a nearly $1.6 billion deficit looms for the 2027-28 budget year, with Medicaid “causing the vast majority of the issue,” in the words of budget director Mark Ferrandino. The program ran about $158 million over last year and could run $443 million over by next July, driven more by long-term care and prescription drugs than by enrollment. Under the Taxpayer’s Bill of Rights, surplus revenue still has to be refunded. It is a public-finance problem with a medical label. (Sentinel Colorado)
That warning is about the state’s Medicaid appropriation, which these federal books do not record. What the official economic accounts can show is whether Colorado already runs a large, fast-growing health economy — the hospitals, clinics, nursing homes and drug bills that sit underneath any Medicaid forecast. Household consumption, industry output and payrolls are three different cameras on the same building. They do not all tell the same story.
The short version: Coloradans already devote a large slice of spending to health, but that slice has not been expanding as a share of the shopping cart. The industry’s weight in state GDP has barely moved. The place where health is crowding in is the job market. Long-term care, the villain in the budget briefing, is not the piece that ballooned on the household or payroll ledgers.
Sixty-six billion dollars, and a share that slipped
In 2024, Colorado households spent $65.7 billion on health, according to the Bureau of Economic Analysis’s state personal consumption accounts — hospitals, outpatient care, nursing homes, drugs and other medical products, in current dollars. That was 16.6 percent of all household spending in the state, which totaled $396 billion. A decade earlier the health share was 17.3 percent. Health spending rose 80 percent from 2014 to 2024; all household spending rose 88 percent. The medical bill got bigger. The rest of the cart grew faster. (BEA state PCE)
Those are nominal totals, so inflation and population are inside the climb. They are also not Medicaid. BEA’s household health category counts spending by all payers as it shows up in consumption — private insurance, Medicare, out-of-pocket, and, yes, some Medicaid services delivered to households — without isolating the state’s budget line. Ferrandino’s $1.6 billion hole can be real even if households, taken together, did not hand health a larger share of their spending.
Colorado household health spending has not outrun the rest of the shopping cart

View exact chart values
| year | health_index_2014 | total_index_2014 | health_share_pct |
|---|---|---|---|
| 2014 | 100 | 100 | 17.31 |
| 2015 | 108.4 | 105.6 | 17.77 |
| 2016 | 114.5 | 110.9 | 17.86 |
| 2017 | 120.4 | 117.7 | 17.71 |
| 2018 | 126.2 | 124.2 | 17.59 |
| 2019 | 133.5 | 131 | 17.64 |
| 2020 | 129.7 | 130.2 | 17.24 |
| 2021 | 144 | 150 | 16.62 |
| 2022 | 155.3 | 166.6 | 16.14 |
| 2023 | 168.8 | 177.6 | 16.44 |
| 2024 | 180.2 | 187.8 | 16.61 |
The drugstore, not the nursing home, grew fastest on the household books
Look inside that $65.7 billion and the budget talking points only half match. Outpatient services were the largest piece in 2024, at $27.9 billion, or 42 percent of household health spending. Hospitals were $21.3 billion (32 percent). Pharmaceutical products were $10.2 billion (16 percent). Nursing homes were $3.6 billion — 5 percent of the household health bill. (BEA state PCE)
From 2014 to 2024, pharmaceutical products were the sprinter, up 104 percent. Outpatient services rose 91 percent, hospitals 61 percent, nursing homes 57 percent. If “long-term care and drugs” are driving Medicaid overruns, the household accounts pick up the drugs more clearly than a nursing-home boom. A Medicaid nursing-home day can get more expensive, or cover more intense care, without the state’s entire nursing-home consumption line leading the pack. The books cannot separate those price and intensity effects. They can say the nursing-home aisle did not swallow the store.
On a per-person basis, Colorado is not an outlier toward the expensive end. BEA’s narrower per capita health-care services measure — outpatient, hospital and nursing-home services, excluding drugs — was $8,871 in Colorado in 2024, 9 percent below the United States at $9,747. Among Rocky Mountain neighbors plus Texas, Montana matched the national figure; Wyoming was close; Utah was lowest at $7,233. Colorado sits in the middle of its neighborhood, not on a private island of medical bills.
Outpatient care, not nursing homes, is the largest slice of Colorado’s health bill

View exact chart values
| category | millions | share_pct |
|---|---|---|
| Outpatient services | 27937.4 | 42.5 |
| Hospitals | 21342.6 | 32.5 |
| Pharmaceutical products | 10249.2 | 15.6 |
| Nursing homes | 3571.5 | 5.4 |
| Other health (function residual) | 2649.1 | 4 |
Colorado’s per-person health-care services bill sits below the U.S. average

View exact chart values
| state | per_capita_dollars |
|---|---|
| Montana | 9747 |
| United States | 9747 |
| Wyoming | 9640 |
| Colorado | 8871 |
| Arizona | 8556 |
| New Mexico | 8469 |
| Idaho | 8078 |
| Texas | 7807 |
| Utah | 7233 |
The crowding is on the payroll
Industry output tells a similarly muted story. Health care and social assistance — a BEA sector that includes social assistance, not just hospitals — produced $37.5 billion of Colorado GDP in 2025, or 6.4 percent of a $584 billion state economy. In 2014 the share was 6.1 percent. The sector nearly doubled in current dollars; the whole economy rose 89 percent. Health is a large industry. It has not quietly become a tenth of Colorado’s output. (BEA regional GDP)
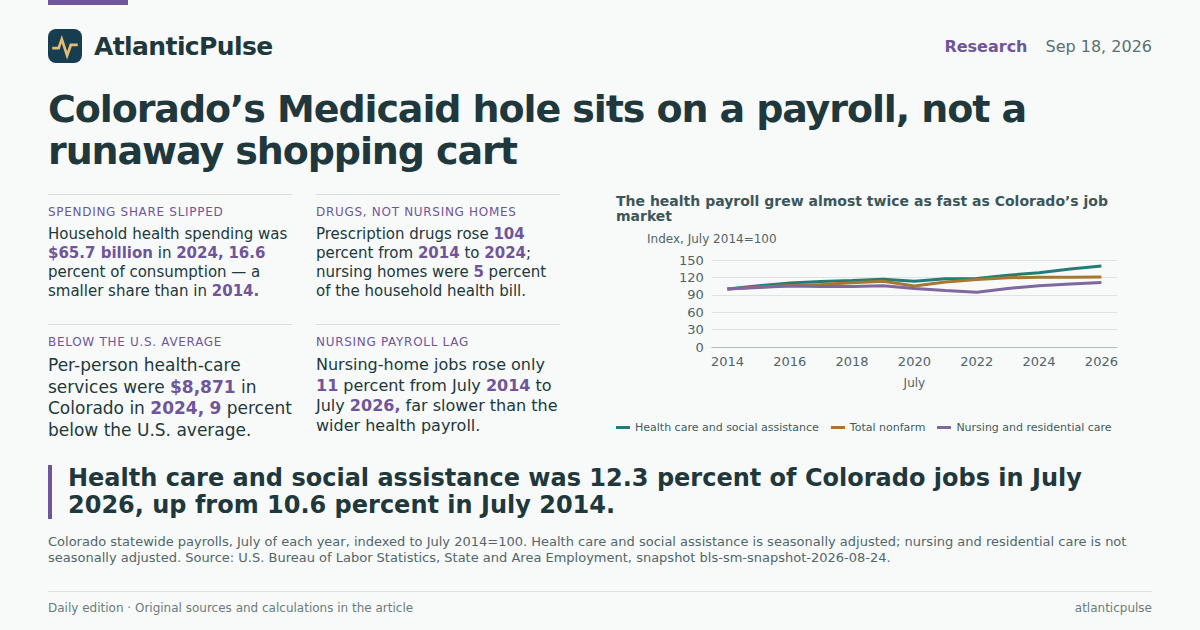
Payrolls are where the crowding shows up. In July 2026, health care and social assistance employed 364,500 Coloradans, seasonally adjusted, or 12.3 percent of statewide nonfarm jobs. In July 2014 the same sector had 260,600 jobs, 10.6 percent of the payroll. That is a 40 percent gain against a 21 percent gain for all nonfarm jobs. Since 2019 the divergence has been sharper still: health-care hiring kept climbing while the rest of the job market flattened after 2023. (BLS State and Area Employment)
Nursing homes did not lead that hiring wave. Nursing and residential care, not seasonally adjusted, had 46,400 jobs in July 2026, up 11 percent from 41,800 in July 2014 — and still below the 2016 peak on this July snapshot. Hospital employment, measured as an annual average, rose from 57,700 in 2014 to 68,900 in 2025, a 19 percent gain. The extra health-care jobs are real. They are not, on these ledgers, a nursing-home stampede. Social assistance, ambulatory clinics and the rest of the sector did more of the lifting than the facilities at the center of the Medicaid briefing.
The health payroll grew almost twice as fast as Colorado’s job market

View exact chart values
| year | hcsa_index_2014 | total_index_2014 | hcsa_share_pct | nursing_index_2014 |
|---|---|---|---|---|
| 2014 | 100 | 100 | 10.57 | 100 |
| 2015 | 105.6 | 103.2 | 10.83 | 102.6 |
| 2016 | 110.4 | 105.8 | 11.03 | 105.3 |
| 2017 | 112.9 | 108 | 11.05 | 104.5 |
| 2018 | 114.7 | 110.8 | 10.94 | 104.5 |
| 2019 | 116.8 | 113.5 | 10.88 | 105.7 |
| 2020 | 113.4 | 105.3 | 11.39 | 100.7 |
| 2021 | 117.6 | 112.1 | 11.09 | 97.4 |
| 2022 | 118.3 | 116.4 | 10.75 | 94.5 |
| 2023 | 123.8 | 119.3 | 10.97 | 101 |
| 2024 | 128 | 120.3 | 11.25 | 105.5 |
| 2025 | 134.6 | 120.1 | 11.84 | 108.6 |
| 2026 | 139.9 | 120.6 | 12.26 | 111 |
One in eight Colorado paychecks now comes from health care and social assistance

View exact chart values
| year | hcsa_thousands | total_thousands | hcsa_share_pct | nursing_nsa_thousands |
|---|---|---|---|---|
| 2010 | 232.2 | 2224.9 | 10.44 | 39.3 |
| 2011 | 239.5 | 2257.6 | 10.61 | 40.5 |
| 2012 | 246.5 | 2313.5 | 10.65 | 40.7 |
| 2013 | 249.5 | 2382.9 | 10.47 | 41 |
| 2014 | 260.6 | 2465 | 10.57 | 41.8 |
| 2015 | 275.3 | 2542.7 | 10.83 | 42.9 |
| 2016 | 287.6 | 2607.4 | 11.03 | 44 |
| 2017 | 294.1 | 2661.2 | 11.05 | 43.7 |
| 2018 | 298.9 | 2731.1 | 10.94 | 43.7 |
| 2019 | 304.5 | 2799 | 10.88 | 44.2 |
| 2020 | 295.5 | 2595.1 | 11.39 | 42.1 |
| 2021 | 306.4 | 2763.5 | 11.09 | 40.7 |
| 2022 | 308.3 | 2868.6 | 10.75 | 39.5 |
| 2023 | 322.5 | 2940.8 | 10.97 | 42.2 |
| 2024 | 333.6 | 2965.9 | 11.25 | 44.1 |
| 2025 | 350.7 | 2961.6 | 11.84 | 45.4 |
| 2026 | 364.5 | 2973.7 | 12.26 | 46.4 |
What a $1.6 billion warning is — and isn’t
Put the three cameras next to each other and Colorado’s health economy looks large, employed, and not especially gluttonous as a share of household spending or GDP. The Medicaid forecast can still blow a TABOR-constrained budget. A program that grows faster than a 4 percent spending cap will do that even if households, in the aggregate, spent a slightly smaller share of their consumption on health in 2024 than in 2014. Enrollment can be stable while the mix of services, drug prices and long-term-care intensity moves. Those are the mechanisms Ferrandino pointed to. These series cannot clock them.
They can retire a few simpler stories. Colorado is not uniquely drowning in per-person hospital and doctor bills relative to the country. Nursing homes are not the fastest-growing household health category, and they have not been the hiring engine. Prescription drugs are the fastest-growing piece of the household health bill, which at least rhymes with the budget office’s second suspect. And if lawmakers are looking for the sector that has quietly taken a larger bite of the state’s economic life, they should look at the payroll: one in eight Colorado paychecks now comes from health care and social assistance, up from about one in ten in 2014.
None of that says cutting Medicaid is easy, or that it would show up as a matching drop in those job counts. It says the $1.6 billion hole is a budget-math problem sitting on top of a health economy that is already big — and that the official books, read carefully, do not show households or nursing homes running away with the state. They show a labor market that increasingly looks like a clinic.
Sources and methods
This is a retrospective reading of sealed local snapshots, not current-day observations. BEA state personal consumption (SAPCE) runs through calendar 2024 (release bea-sapce-2025-09-26). BEA annual state GDP runs through 2025 (release bea-regional-state-annual-2026-04-09). BLS State and Area Employment is a 2026-08-24 snapshot with monthly data through July 2026.
Household health spending is BEA’s function category “Health,” in millions of current dollars, and is not the Colorado Medicaid budget. It includes hospitals, outpatient services, nursing homes, pharmaceutical products and other medical goods as consumption, from all payers. Per capita “health care” in SAPCE table SAPCE2 is outpatient, hospital and nursing-home services only and excludes drugs; do not mix it with the broader function total.
GDP “health care and social assistance” includes social assistance. Shares of GDP and of PCE are current-dollar ratios, not inflation-adjusted or population-adjusted except where a per capita series is used. Missing observations were not treated as zero.
Payroll comparisons use July levels. Health care and social assistance is seasonally adjusted; nursing and residential care is not. Hospital employment is an annual average, not seasonally adjusted. Those series are not interchangeable.
No series here measures Medicaid enrollment, long-term-care acuity, or drug net prices. Growth-rate comparisons are descriptive. They do not estimate the causal effect of TABOR, Medicaid policy, or enrollment on the deficit.
Research completed 2026-09-19, for the September 18, 2026 news edition. The available source data may cover earlier periods; see the observation periods and source vintages above.