Research
Colorado’s insurance sticker shock is real. The official books tell a narrower story.
Two invoices, one set of books
Coloradans opened the week to two insurance stories that sound like the same crisis. The Division of Insurance finalized 2027 Affordable Care Act marketplace premiums averaging a 10 percent increase, worse on the Western Slope, after Congress let enhanced tax credits expire. Separately, NAIC figures show the state’s average full-coverage auto premium climbed more than 36 percent from 2021 to 2024, from more than $1,300 to more than $1,800. Those are sticker prices. They are not what the national accounts call “spending on insurance.”
The Bureau of Economic Analysis’s state consumption accounts, through calendar 2025, record insurance as a net service charge: premiums minus benefits. That is why a $1,800 auto policy does not show up as $1,800 of consumption, and why a 10 percent marketplace hike is not a 10 percent jump in the health-insurance line. It is still the right ledger for a different question: once you strip out claims, how large is the insurance industry’s take in Colorado, how is it split, and has it outrun incomes?
In 2025 Coloradans accounted for $8.34 billion of household insurance consumption, $1,387 per resident. That was about 2.0 percent of the state’s $411.5 billion in personal consumption. Net health insurance was $3.12 billion, or $519 a person. Net motor-vehicle and other transportation insurance was $1.81 billion, or $300 a person. Life insurance was almost as large as health, at $3.08 billion. Household (homeowners and renters) insurance was the small slice, $332 million, or $55 a person. These are statewide totals divided by midyear residents — children, non-drivers and the uninsured included — not a typical household’s premium.
Colorado’s insurance service charge, per resident

View exact chart values
| year | co_motor_pc | co_health_pc | co_hh_pc | us_motor_pc | us_health_pc |
|---|---|---|---|---|---|
| 2010 | 205 | 418.2 | 25.7 | 194.8 | 462.3 |
| 2011 | 203.8 | 439.8 | 25.7 | 198.1 | 491.6 |
| 2012 | 198 | 393.2 | 24.7 | 196.4 | 463.9 |
| 2013 | 194.1 | 404.1 | 26.8 | 199 | 486.5 |
| 2014 | 194 | 448.9 | 31.4 | 206.7 | 554.5 |
| 2015 | 191.4 | 443.7 | 34.6 | 212.1 | 581.5 |
| 2016 | 186.7 | 453 | 37.3 | 219.2 | 617.1 |
| 2017 | 196.3 | 459.5 | 39.4 | 237.6 | 658.9 |
| 2018 | 163.1 | 508.7 | 37.4 | 236.3 | 757.7 |
| 2019 | 188.7 | 462.1 | 42.2 | 251.5 | 702.5 |
| 2020 | 185 | 493.6 | 44.3 | 245 | 720 |
| 2021 | 225.7 | 482.1 | 42.3 | 283.2 | 737 |
| 2022 | 243 | 488.3 | 45.4 | 287 | 748 |
| 2023 | 235.6 | 486.3 | 50 | 277.9 | 762.4 |
| 2024 | 270.4 | 496.2 | 56.9 | 297.9 | 795 |
| 2025 | 300.2 | 519.3 | 55.3 | 323.3 | 830.4 |
Motor insurance ran ahead of the paycheck
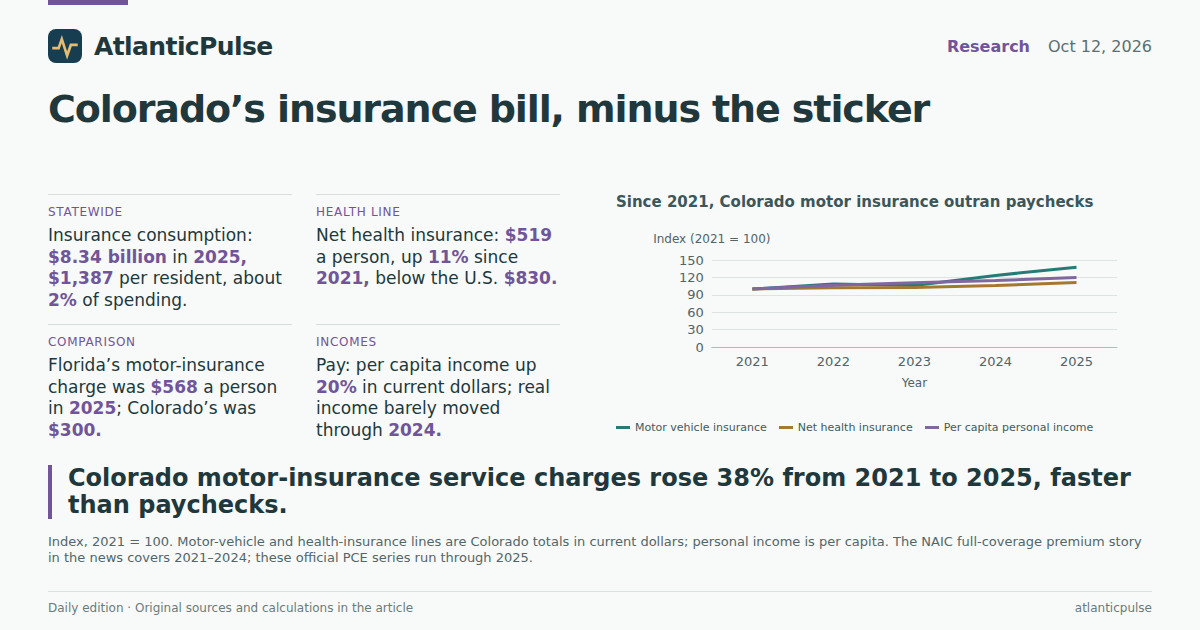
The auto story in the news is a 2021–2024 premium jump. On the official books, Colorado’s net motor-vehicle insurance rose 23 percent in current dollars from 2021 to 2024, and 38 percent through 2025. Per resident, that is a 20 percent rise to 2024 and a 33 percent rise to 2025, from $226 to $300. U.S. motor-vehicle insurance per person rose 14 percent over the same 2021–2025 span, to $323. Colorado’s motor line is still below the national average. It is no longer the sleepy category it was in the 2010s, when per-person motor insurance actually drifted down before the pandemic.
Paychecks did not keep that pace in real terms. Colorado per capita personal income rose 20 percent in current dollars from 2021 to 2025, to $86,342 — slower than the motor-insurance total, faster than net health insurance. After regional prices, real per capita personal income in 2017 dollars was almost unchanged from 2021 to 2024, up about 1 percent to $65,223. That is the squeeze households feel: a motor-insurance service charge climbing in the mid-thirties percent while inflation-adjusted income barely budged. It is not proof that any one carrier “caused” the paycheck gap. It is the arithmetic of two official series moving at different speeds.
Net household insurance, the homeowners and renters line, jumped 35 percent from 2021 to 2025, to $332 million. That is a small dollar base with a steep slope, consistent with a hail-and-repair state, and still only 4 percent of Colorado’s insurance consumption. Life insurance, which BEA also records net of benefits, grew with the rest of the stack and remains a third of the bill. None of these lines is the premium a Denver driver quotes at $200 a month. They are the residual the accounts treat as the cost of being insured.
Since 2021, Colorado motor insurance outran paychecks

View exact chart values
| year | co_health_idx | co_motor_idx | co_hh_idx | co_ins_idx | co_pcpi_idx | us_motor_idx | us_health_idx | co_motor_pc_idx | co_health_pc_idx |
|---|---|---|---|---|---|---|---|---|---|
| 2021 | 100 | 100 | 100 | 100 | 100 | 100 | 100 | 100 | 100 |
| 2022 | 102 | 108.4 | 108.2 | 107.8 | 106.5 | 101.9 | 102.1 | 107.7 | 101.3 |
| 2023 | 102.6 | 106.1 | 120.3 | 115.4 | 110.9 | 99.5 | 104.9 | 104.4 | 100.9 |
| 2024 | 106 | 123.4 | 138.7 | 124.2 | 114.7 | 107.7 | 110.4 | 119.8 | 102.9 |
| 2025 | 111.4 | 137.6 | 135.2 | 130.2 | 120 | 117.5 | 116 | 133 | 107.7 |
Colorado’s insurance ledger, in millions

View exact chart values
| year | co_health_mn | co_motor_mn | co_hh_mn | co_life_mn | co_ins_mn | co_pce_mn | co_healthfunc_mn | co_pop | co_pcpi | us_health_mn | us_motor_mn | us_ins_mn | us_pop | us_pcpi | co_health_pc | co_motor_pc | co_hh_pc | co_life_pc | co_ins_pc | co_healthfunc_pc | us_health_pc | us_motor_pc | us_ins_pc | co_ins_share_pct |
|---|---|---|---|---|---|---|---|---|---|---|---|---|---|---|---|---|---|---|---|---|---|---|---|---|
| 2010 | 2110.6 | 1034.7 | 129.6 | 1527.7 | 4802.6 | 175992.9 | 30802.8 | 5046928 | 40809 | 143018.9 | 60279.1 | 288954.5 | 309378227 | 40557 | 418.2 | 205 | 25.7 | 302.7 | 951.6 | 6103.3 | 462.3 | 194.8 | 934 | 2.73 |
| 2011 | 2251.1 | 1043.2 | 131.4 | 1603.2 | 5028.8 | 184841.9 | 31761.1 | 5118837 | 43714 | 153300.8 | 61761.7 | 304919.2 | 311839461 | 42650 | 439.8 | 203.8 | 25.7 | 313.2 | 982.4 | 6204.7 | 491.6 | 198.1 | 977.8 | 2.72 |
| 2012 | 2040.2 | 1027.3 | 128.1 | 1542.1 | 4737.7 | 189763.8 | 32774.8 | 5188139 | 45480 | 145831.4 | 61724 | 296668.8 | 314339099 | 44238 | 393.2 | 198 | 24.7 | 297.2 | 913.2 | 6317.3 | 463.9 | 196.4 | 943.8 | 2.5 |
| 2013 | 2126.8 | 1021.5 | 141.2 | 1488 | 4777.5 | 198951 | 34103.2 | 5262801 | 47076 | 154087.8 | 63021.7 | 307516 | 316726282 | 44402 | 404.1 | 194.1 | 26.8 | 282.7 | 907.8 | 6480 | 486.5 | 199 | 970.9 | 2.4 |
| 2014 | 2398.3 | 1036.4 | 167.9 | 1558 | 5160.7 | 210765.5 | 36478.8 | 5342212 | 50221 | 177039.5 | 65977.6 | 338820.8 | 319257560 | 46289 | 448.9 | 194 | 31.4 | 291.6 | 966 | 6828.4 | 554.5 | 206.7 | 1061.3 | 2.45 |
| 2015 | 2414.4 | 1041.3 | 188.2 | 1604.6 | 5248.4 | 222464.3 | 39530.4 | 5441452 | 51371 | 187121 | 68245 | 354732.9 | 321815121 | 48062 | 443.7 | 191.4 | 34.6 | 294.9 | 964.5 | 7264.7 | 581.5 | 212.1 | 1102.3 | 2.36 |
| 2016 | 2504.5 | 1032 | 206.3 | 1358.8 | 5101.6 | 233801.6 | 41761.8 | 5528510 | 51282 | 200149.5 | 71086.1 | 358104.7 | 324353340 | 48974 | 453 | 186.7 | 37.3 | 245.8 | 922.8 | 7553.9 | 617.1 | 219.2 | 1104.1 | 2.18 |
| 2017 | 2573.3 | 1099.3 | 220.4 | 1845.5 | 5738.6 | 247983.2 | 43918.9 | 5599635 | 54145 | 215193.8 | 77602.9 | 398564.4 | 326608609 | 51006 | 459.5 | 196.3 | 39.4 | 329.6 | 1024.8 | 7843.2 | 658.9 | 237.6 | 1220.3 | 2.31 |
| 2018 | 2887.9 | 925.8 | 212.6 | 1873.3 | 5899.6 | 261807.9 | 46044 | 5676918 | 57765 | 248926.4 | 77619 | 435264.8 | 328529577 | 53311 | 508.7 | 163.1 | 37.4 | 330 | 1039.2 | 8110.7 | 757.7 | 236.3 | 1324.9 | 2.25 |
| 2019 | 2650.3 | 1082.1 | 241.8 | 1836.9 | 5811.1 | 276054.3 | 48708.4 | 5735797 | 61242 | 231993.6 | 83043.5 | 422128 | 330226227 | 55567 | 462.1 | 188.7 | 42.2 | 320.3 | 1013.1 | 8492 | 702.5 | 251.5 | 1278.3 | 2.11 |
| 2020 | 2856.3 | 1070.7 | 256.6 | 1772 | 5955.5 | 274438.5 | 47309.8 | 5786873 | 64669 | 238726.5 | 81221.4 | 426072.3 | 331578104 | 59151 | 493.6 | 185 | 44.3 | 306.2 | 1029.1 | 8175.4 | 720 | 245 | 1285 | 2.17 |
| 2021 | 2803.1 | 1312.1 | 245.7 | 2044.6 | 6405.5 | 316179 | 52516 | 5814368 | 71934 | 244750.9 | 94040.4 | 453006.2 | 332100166 | 64718 | 482.1 | 225.7 | 42.3 | 351.6 | 1101.7 | 9032.1 | 737 | 283.2 | 1364.1 | 2.03 |
| 2022 | 2858.2 | 1422.6 | 265.9 | 2356.3 | 6903 | 350240.2 | 56686.3 | 5853355 | 76616 | 249845.9 | 95863.4 | 470720.4 | 333996304 | 66316 | 488.3 | 243 | 45.4 | 402.6 | 1179.3 | 9684.4 | 748 | 287 | 1409.4 | 1.97 |
| 2023 | 2875.3 | 1392.7 | 295.5 | 2828.1 | 7391.6 | 372724.3 | 61689.4 | 5912240 | 79761 | 256753.6 | 93574.5 | 485944.7 | 336755052 | 70191 | 486.3 | 235.6 | 50 | 478.3 | 1250.2 | 10434.2 | 762.4 | 277.9 | 1443 | 1.98 |
| 2024 | 2971.5 | 1619.3 | 340.8 | 3022.9 | 7954.5 | 391704.3 | 65645 | 5988502 | 82498 | 270311.7 | 101284.5 | 517044.9 | 340003797 | 73634 | 496.2 | 270.4 | 56.9 | 504.8 | 1328.3 | 10961.8 | 795 | 297.9 | 1520.7 | 2.03 |
| 2025 | 3122.3 | 1805.1 | 332.3 | 3081.3 | 8341 | 411488.2 | 71141.2 | 6012561 | 86342 | 283828.2 | 110488.6 | 542262.7 | 341784857 | 77028 | 519.3 | 300.2 | 55.3 | 512.5 | 1387.3 | 11832.1 | 830.4 | 323.3 | 1586.6 | 2.03 |
Health insurance is not the hospital bill
Net health insurance is the line people will try to map onto the 10 percent marketplace increase. It is a poor overlay. In 2025 it was $519 per Coloradan, versus $830 for the United States. It rose only 11 percent in current dollars from 2021 to 2025, or 8 percent per person. The Connect for Health Colorado market is a slice of coverage; most residents get insurance through employers, Medicare or Medicaid, and BEA’s net measure subtracts benefits. A 10 percent hike on 2027 individual-market premiums can be politically large and still barely move this series.
The medical bill itself lives on a different row. Colorado’s health function in personal consumption — hospitals, physicians, drugs and the rest of care — was $71.1 billion in 2025, or $11,832 per resident. That is roughly nine times the net health-insurance service charge. Prior reporting on Colorado’s Medicaid budget hole was about that care economy. This week’s marketplace story is about who pays the premium. The accounts keep those apart on purpose. Confusing them is how a 10 percent premium notice gets described as a 10 percent rise in “health spending.”
Put the 2025 insurance pie together and the marketplace fight looks even narrower. Net health insurance was 37 percent of Colorado’s insurance consumption, life insurance 37 percent, motor vehicle 22 percent, household insurance 4 percent. The components add to the published insurance total; there is no leftover category hiding a secret premium. If Coloradans are angry about car insurance, they are looking at the slice that actually accelerated. If they are angry about ACA premiums, they are looking at a product that is only part of the health-insurance line, which itself is only part of the care bill.
Where Colorado’s $8.3 billion insurance bill went in 2025

View exact chart values
| category | millions | per_capita | share_of_sum_pct | share_of_total_ins_pct |
|---|---|---|---|---|
| Net health insurance | 3122.3 | 519.3 | 37.4 | 37.4 |
| Life insurance | 3081.3 | 512.5 | 36.9 | 36.9 |
| Net motor vehicle and other transportation | 1805.1 | 300.2 | 21.6 | 21.6 |
| Net household insurance | 332.3 | 55.3 | 4 | 4 |
Florida is the outlier. Colorado is not.
Among the places that fit this week’s insurance news, Colorado is not the expensive one on the official motor line. In 2025 Florida’s net motor-vehicle insurance was $568 per resident, Wyoming $416, the United States $323, the Rocky Mountain region $313, Colorado $300, and California $259. Florida’s home-insurance market is a separate mess; even its auto service charge is in another league. Wyoming’s per-person motor figure is high on a small population. Colorado’s recent jump still leaves it a bit cheaper than the country, and a bit cheaper than its own region.
That comparison is not a compliment, and it is not a forecast of 2027 marketplace rates. It is a check on the idea that Colorado has become uniquely uninsurable. The NAIC full-coverage average of more than $1,800 in 2024 is a different object: a quoted premium for people who buy full coverage, not a net service charge spread across every resident. Both can be true. Premiums billed to drivers can jump more than 36 percent while the consumption account, after claims, rises about 23 percent through 2024 and 38 percent through 2025. Treating one as a correction of the other is a category error.
The 2027 individual-market increase is still ahead of these books. BEA’s latest year is 2025; the Division of Insurance is pricing 2027. Enhanced federal subsidies lapsed in 2026. None of that is in the 2025 observation. What the 2025 observation can say is that Colorado already spends about $1,400 a person on insurance services, that motor insurance is the line that broke from income, and that the health-insurance service charge remains smaller, per person, than the U.S. average. The sticker shock is local. The ledger is slower, narrower, and already in motion.
Florida’s motor-insurance bill still dwarfs Colorado’s

View exact chart values
| place | motor_pc_2025 | motor_mn_2025 |
|---|---|---|
| Florida | 568.2 | 13330.3 |
| Wyoming | 415.5 | 244.6 |
| United States | 323.3 | 110488.6 |
| Rocky Mountain | 313.3 | 4171.2 |
| Colorado | 300.2 | 1805.1 |
| California | 259.1 | 10196.1 |
Sources and methods
BEA Personal Consumption Expenditures by State (SAPCE, function table), annual calendar years 2010–2025, current dollars, not seasonally adjusted. Insurance subcategories are net service charges (premiums less benefits), not billed premiums. Health function spending is medical care, not insurance.
Per-person figures divide millions of dollars by BEA midyear resident population (SAINC1), including children and people who do not buy the relevant policy. That is not a household average and is not comparable to an NAIC full-coverage premium.
Per capita personal income is SAINC1, current dollars, 2010–2025. Real per capita personal income is SARPI, constant 2017 dollars, through 2024 only (BEA RPP vintage 19 February 2026).
Index charts use 2021 = 100 because that is the start of the NAIC four-year auto window cited in reporting. Percent changes are simple endpoint changes; missing values were not treated as zero. Insurance components in 2025 sum to the published insurance total (residual $0.0 million after rounding).
Observation years are calendar years, not the 2026-10-12 edition date. Provider snapshots are BEA SAPCE and SAINC releases dated 30 September 2026. No causal claim is made about premiums, uninsured driving, hail, or federal subsidy lapse.
Research completed 2026-10-13, for the October 12, 2026 news edition. The available source data may cover earlier periods; see the observation periods and source vintages above.