Research
Colorado’s 7% mortgage is landing on a housing bill that was already fat
A 7% mortgage on a market that was already expensive
Colorado buyers are doing what people do when a round number starts looking like a warning label: they wait. The average 30-year fixed mortgage hit 7.09% on 18 September, its highest in at least a year and a half, days after the Federal Reserve raised the federal-funds rate for the first time in three years. August home sales in the state fell 11.3% year over year. Houses sat 65 days. The statewide median sale price held at $550,000; in Pitkin County it was $3.6 million. A Rifle broker’s illustration is the sort of arithmetic that ends open houses: a $480,000 loan at 7% costs about $316 more per month in principal and interest than the same loan at 6%.
That rate print is new. The housing bill it is landing on is not. The Bureau of Economic Analysis publishes regional price parities that compare local price levels with the national average, set near 100. In 2024, the latest year in the February 2026 vintage, Colorado’s housing RPP was 127.4, against 100.6 for the United States. The state’s all-items RPP was only 103.1. In plain English: Colorado is not an expensive place to buy a basket of goods. It is an expensive place to rent a roof. Housing RPPs are estimated from tenant-occupied housing, not from sale prices in Aspen, so they understate the ski-town circus and still put the whole state more than a quarter above the national housing price level.
The gap is old. Colorado’s housing RPP was already 113.9 in 2008. It climbed through the 2010s, peaked at 131.0 in 2019, and was still 130.5 in 2023 before easing to 127.4 in 2024 — a relative cooling, not a collapse. Over 2008–2024 the relative housing price level rose 11.9%. That is not a consumer-price index. It says Colorado housing became more expensive than the rest of the country, not that a given rent rose 12%.
Colorado housing prices have run well above the U.S. average

View exact chart values
| year | colorado_housing_rpp | us_housing_rpp | colorado_all_items_rpp | us_all_items_rpp |
|---|---|---|---|---|
| 2008 | 113.9 | 100.4 | 103.3 | 100 |
| 2009 | 113.2 | 100.5 | 102.4 | 100 |
| 2010 | 112.2 | 100.4 | 100.6 | 100 |
| 2011 | 118.8 | 100.4 | 103.4 | 100 |
| 2012 | 115.7 | 100.4 | 103.1 | 100 |
| 2013 | 118 | 100.4 | 103.1 | 100 |
| 2014 | 120.8 | 100.4 | 103.1 | 100 |
| 2015 | 123.9 | 100.4 | 103 | 100 |
| 2016 | 126.2 | 100.4 | 102.7 | 100 |
| 2017 | 128.9 | 100.4 | 102.9 | 100 |
| 2018 | 128.3 | 100.4 | 100.3 | 100 |
| 2019 | 131 | 100.4 | 102.5 | 100 |
| 2020 | 130.4 | 100.6 | 103.8 | 100 |
| 2021 | 129.4 | 100.6 | 102.8 | 100 |
| 2022 | 129.5 | 100.6 | 102.3 | 100 |
| 2023 | 130.5 | 100.6 | 101.9 | 100 |
| 2024 | 127.4 | 100.6 | 103.1 | 100 |
Not California. Not Wyoming either.
Put Colorado next to the coasts and next to its neighbours and the picture is less flattering than a Front Range realtor would like. Among a selected set of high-cost and Mountain West states in 2024, only California (154.3), New Jersey (134.3) and Massachusetts (128.1) sat above Colorado’s 127.4. Washington was 126.0, Hawaii 125.3, New York 122.2 and Florida 122.1. Utah was 107.8 and Arizona 106.8. Texas, the place Coloradans are forever threatening to move to, was 96.5. New Mexico was 73.6. Wyoming, which shares a mountain skyline and not much of a housing premium, was 71.1.
This is not a 50-state ranking, and it is not a claim that Boulder is cheaper than Honolulu. It is a reminder that Colorado’s housing problem is not a coastal monopoly and is not a Rocky Mountain average. The same mountain west that looks inexpensive in Cheyenne looks dear in Denver. BEA’s state figures smear Pitkin County’s $3.6 million median together with Pueblo. The RPP still says the smear is expensive.
Among these states, only California, New Jersey and Massachusetts had higher 2024 housing prices

View exact chart values
| state | housing_rpp | highlight |
|---|---|---|
| California | 154.3 | 0 |
| New Jersey | 134.3 | 0 |
| Massachusetts | 128.1 | 0 |
| Colorado | 127.4 | 1 |
| Washington | 126 | 0 |
| Hawaii | 125.3 | 0 |
| New York | 122.2 | 0 |
| Florida | 122.1 | 0 |
| Nevada | 114.1 | 0 |
| Utah | 107.8 | 0 |
| Arizona | 106.8 | 0 |
| United States | 100.6 | 0 |
| Texas | 96.5 | 0 |
| New Mexico | 73.6 | 0 |
| Wyoming | 71.1 | 0 |
The bill per person, not the list price
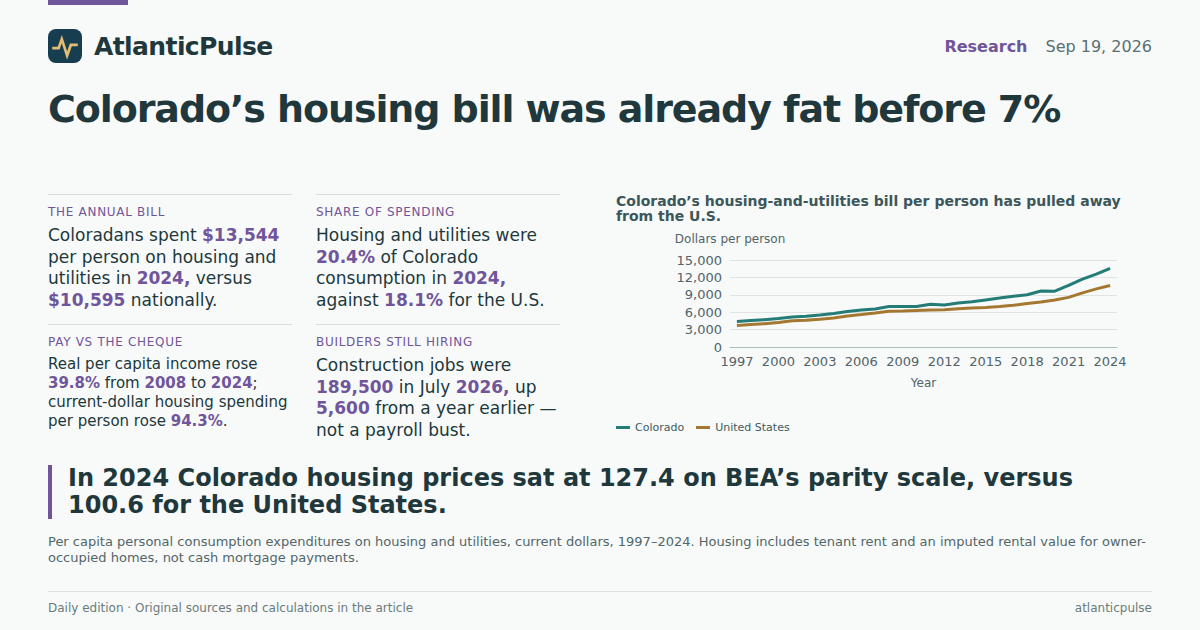
Price levels are one thing. What residents actually spend is another. In BEA’s state consumption accounts, Colorado’s per capita outlay on housing and utilities was $13,544 in 2024, against $10,595 for the United States. That is not a household average; it is spending per resident. It also is not a mortgage statement. “Housing” here includes tenant rent and an imputed rental value for owner-occupied homes — the rent BEA pretends owners pay themselves — plus water, electricity and gas. Cash principal is not in the number. Imputed rent is.
Even with that caveat, the gap is large and growing. Colorado spent $4,403 per person on housing and utilities in 1997, when the series begins, already above the U.S. $3,704. By 2024 the Colorado figure had more than tripled. Housing and utilities were 20.4% of Colorado per capita consumption in 2024, versus 18.1% nationally and 19.7% in Colorado in 1997. California, which dominates the RPP ranking, spent $12,842 per person — less than Colorado — because the PCE measure is a spending total, not a price tag on a two-bedroom in Santa Monica.
Most of that Colorado housing consumption is not a cheque to a landlord. Imputed owner-occupied rent was $54.4 billion in 2024; tenant rent was $17.5 billion. Owners accounted for 75.7% of the combined total, down a little from 79.0% in 2010 as the tenant share edged up. People waiting out a 7% mortgage while sitting on a 3% loan are, in the national accounts, still consuming a very expensive house.
Colorado’s housing-and-utilities bill per person has pulled away from the U.S.

View exact chart values
| year | co_housing_utilities_per_capita | co_total_pce_per_capita | co_housing_share_pct | us_housing_utilities_per_capita | us_housing_share_pct |
|---|---|---|---|---|---|
| 1997 | 4403 | 22341 | 19.7 | 3704 | 18.2 |
| 1998 | 4559 | 23516 | 19.4 | 3862 | 18.1 |
| 1999 | 4709 | 25114 | 18.8 | 4025 | 17.9 |
| 2000 | 4930 | 27049 | 18.2 | 4248 | 17.7 |
| 2001 | 5197 | 27861 | 18.7 | 4518 | 18.2 |
| 2002 | 5306 | 28236 | 18.8 | 4622 | 18.1 |
| 2003 | 5493 | 29233 | 18.8 | 4795 | 18 |
| 2004 | 5778 | 30702 | 18.8 | 5009 | 17.8 |
| 2005 | 6131 | 32131 | 19.1 | 5347 | 18 |
| 2006 | 6387 | 33483 | 19.1 | 5583 | 18 |
| 2007 | 6569 | 34856 | 18.8 | 5841 | 18.1 |
| 2008 | 6969 | 35436 | 19.7 | 6158 | 18.6 |
| 2009 | 6982 | 34335 | 20.3 | 6194 | 19.2 |
| 2010 | 6996 | 34871 | 20.1 | 6296 | 19 |
| 2011 | 7384 | 36110 | 20.4 | 6360 | 18.5 |
| 2012 | 7246 | 36576 | 19.8 | 6409 | 18.2 |
| 2013 | 7607 | 37803 | 20.1 | 6585 | 18.3 |
| 2014 | 7787 | 39453 | 19.7 | 6722 | 18.1 |
| 2015 | 8123 | 40883 | 19.9 | 6824 | 17.9 |
| 2016 | 8431 | 42290 | 19.9 | 6996 | 17.8 |
| 2017 | 8754 | 44286 | 19.8 | 7196 | 17.7 |
| 2018 | 9011 | 46118 | 19.5 | 7486 | 17.6 |
| 2019 | 9659 | 48128 | 20.1 | 7758 | 17.7 |
| 2020 | 9621 | 47422 | 20.3 | 8106 | 18.9 |
| 2021 | 10621 | 54361 | 19.5 | 8560 | 17.6 |
| 2022 | 11697 | 59999 | 19.5 | 9324 | 17.6 |
| 2023 | 12571 | 63440 | 19.8 | 10022 | 17.9 |
| 2024 | 13544 | 66448 | 20.4 | 10595 | 18.1 |
Most of Colorado’s housing bill is imputed rent, not a cheque to a landlord

View exact chart values
| year | tenant_rent_millions | owner_imputed_rent_millions | tenant_share_pct | owner_share_pct |
|---|---|---|---|---|
| 2010 | 6405.2 | 24077.2 | 21 | 79 |
| 2011 | 7196.1 | 25572.4 | 22 | 78 |
| 2012 | 7358.6 | 25252.5 | 22.6 | 77.4 |
| 2013 | 7557.5 | 27152.7 | 21.8 | 78.2 |
| 2014 | 8130.9 | 27978.7 | 22.5 | 77.5 |
| 2015 | 9016.4 | 29870.3 | 23.2 | 76.8 |
| 2016 | 9245.5 | 31900.4 | 22.5 | 77.5 |
| 2017 | 9731.4 | 33605.6 | 22.5 | 77.5 |
| 2018 | 10309.3 | 34967.8 | 22.8 | 77.2 |
| 2019 | 11022.2 | 38084.1 | 22.4 | 77.6 |
| 2020 | 11192 | 38276.6 | 22.6 | 77.4 |
| 2021 | 12179.3 | 42611.4 | 22.2 | 77.8 |
| 2022 | 13794.4 | 46631.2 | 22.8 | 77.2 |
| 2023 | 15767.7 | 50209.5 | 23.9 | 76.1 |
| 2024 | 17466.5 | 54374.9 | 24.3 | 75.7 |
Real pay rose. The housing cheque rose faster.
Colorado is not a poor state waiting for a housing crash to restore justice. Real per capita personal income, in 2017 dollars, was $65,223 in 2024, up 39.8% from $46,671 in 2008. The United States rose 29.2% over the same span, to $59,195. On that measure Coloradans pulled further ahead. Nominal per capita income reached $82,625 in 2024 and $86,181 in 2025, the latest BEA annual vintage.
Index everything to 2008 and the mismatch is obvious. Colorado’s housing RPP, a relative price, is up about 12%. Real income is up 40%. Current-dollar housing-and-utilities spending per person is up 94%. The last of those is the one that hits a monthly budget: more dollars, not just a higher rank against Mississippi. Housing and utilities equaled 16.4% of Colorado’s nominal per capita income in 2024, against 14.5% nationally. None of this says the 7% mortgage caused August’s slowdown. It says buyers are being asked to finance, at a psychologically ugly rate, a housing service that was already eating a fatter slice of income than it does in most of the country.
The cash housing bill rose faster than real pay, even after housing prices cooled

View exact chart values
| year | housing_rpp_index_2008 | real_pc_income_index_2008 | housing_pce_per_capita_index_2008 | nominal_pc_income_index_2008 | us_real_pc_income_index_2008 |
|---|---|---|---|---|---|
| 2008 | 100 | 100 | 100 | 100 | 100 |
| 2009 | 99.4 | 94.9 | 100.2 | 93.7 | 96.5 |
| 2010 | 98.5 | 96.2 | 100.4 | 95 | 97.8 |
| 2011 | 104.3 | 97.8 | 106 | 101.8 | 100.3 |
| 2012 | 101.6 | 100.1 | 104 | 105.9 | 102.1 |
| 2013 | 103.7 | 102.3 | 109.2 | 109.6 | 101.2 |
| 2014 | 106.1 | 107.7 | 111.7 | 117 | 104 |
| 2015 | 108.8 | 110 | 116.6 | 119.6 | 107.8 |
| 2016 | 110.8 | 109.1 | 121 | 119.4 | 108.8 |
| 2017 | 113.2 | 113 | 125.6 | 126.1 | 111.3 |
| 2018 | 112.7 | 121.3 | 129.3 | 134.5 | 114 |
| 2019 | 115.1 | 124 | 138.6 | 142.6 | 117.2 |
| 2020 | 114.5 | 128 | 138.1 | 150.6 | 123.3 |
| 2021 | 113.7 | 137.9 | 152.4 | 167.4 | 129.6 |
| 2022 | 113.8 | 138.6 | 167.8 | 178.4 | 124.6 |
| 2023 | 114.6 | 140.1 | 180.4 | 186.3 | 126.8 |
| 2024 | 111.9 | 139.8 | 194.3 | 192.3 | 129.2 |
The builders have not packed up
If falling sales were already a jobs crash, the payroll would show it. It does not. Colorado construction employment, seasonally adjusted, was 189,500 in July 2026, up 5,600 from July 2025, and 6.4% of the state’s 2.97 million nonfarm jobs. The supersector includes highways and hospitals as well as houses, so it is a blunt instrument. It is still the workforce that would shrink first if the residential pipeline froze. The annual average dipped from 186,700 in 2024 to 185,300 in 2025, then ran at 188,500 through the first seven months of 2026. That is a pause, not a bust.
The official books stop short of this month’s mortgage print. Price parities and consumption run through 2024. Income runs through 2025. Payrolls run through July 2026. Fannie Mae, in the same reporting that clocked 7.09%, expects rates still higher into 2027. Brokers are telling clients to buy now and refinance later. The data cannot referee that sales pitch. They can say this: Colorado was already a housing-expensive, income-solid, construction-still-hiring state before the 7% handle came back. Waiting for the rate to fall does not make the underlying bill smaller. It just makes the next bid more expensive if the forecast is right — and no cheaper if it is not.
Colorado construction payrolls have not rolled over with sales

View exact chart values
| month | construction_thousands | nonfarm_thousands |
|---|---|---|
| 2015-01 | 146.7 | 2514 |
| 2015-02 | 147.9 | 2520.6 |
| 2015-03 | 147.3 | 2522.7 |
| 2015-04 | 147.3 | 2524.7 |
| 2015-05 | 148.1 | 2533.7 |
| 2015-06 | 147.9 | 2538.8 |
| 2015-07 | 148.3 | 2542.7 |
| 2015-08 | 148.8 | 2545.8 |
| 2015-09 | 149.6 | 2553.5 |
| 2015-10 | 150.4 | 2559 |
| 2015-11 | 150.9 | 2567 |
| 2015-12 | 151.5 | 2571.5 |
| 2016-01 | 151.9 | 2576.1 |
| 2016-02 | 152.5 | 2581.2 |
| 2016-03 | 153 | 2584.2 |
| 2016-04 | 153 | 2590.1 |
| 2016-05 | 153.8 | 2585.6 |
| 2016-06 | 154.4 | 2594.6 |
| 2016-07 | 155.5 | 2607.4 |
| 2016-08 | 156.1 | 2611.7 |
| 2016-09 | 157.1 | 2620.2 |
| 2016-10 | 157.8 | 2617.8 |
| 2016-11 | 158.8 | 2623.2 |
| 2016-12 | 158.7 | 2626 |
| 2017-01 | 158.9 | 2626.9 |
| 2017-02 | 160.2 | 2636.2 |
| 2017-03 | 161.8 | 2645.9 |
| 2017-04 | 162 | 2647.7 |
| 2017-05 | 162 | 2651 |
| 2017-06 | 162.8 | 2656.5 |
| 2017-07 | 163.4 | 2661.2 |
| 2017-08 | 164.8 | 2667.3 |
| 2017-09 | 165.4 | 2675.3 |
| 2017-10 | 166.7 | 2679.7 |
| 2017-11 | 167.5 | 2679.9 |
| 2017-12 | 168.6 | 2692 |
| 2018-01 | 169.8 | 2698.1 |
| 2018-02 | 171.1 | 2704.7 |
| 2018-03 | 171.9 | 2713.4 |
| 2018-04 | 171.9 | 2717.5 |
| 2018-05 | 172.4 | 2721.8 |
| 2018-06 | 173.4 | 2727.5 |
| 2018-07 | 173.6 | 2731.1 |
| 2018-08 | 174.3 | 2736.3 |
| 2018-09 | 174.7 | 2734.3 |
| 2018-10 | 174.3 | 2741.2 |
| 2018-11 | 175.2 | 2748.8 |
| 2018-12 | 175.7 | 2752.5 |
| 2019-01 | 176.8 | 2760.3 |
| 2019-02 | 177.7 | 2768.1 |
| 2019-03 | 176.8 | 2767.3 |
| 2019-04 | 177.7 | 2774.6 |
| 2019-05 | 178.3 | 2785.5 |
| 2019-06 | 179.9 | 2787.9 |
| 2019-07 | 180.4 | 2799 |
| 2019-08 | 180.6 | 2805.4 |
| 2019-09 | 180.7 | 2803.9 |
| 2019-10 | 180.3 | 2804.6 |
| 2019-11 | 180.5 | 2810.3 |
| 2019-12 | 180.5 | 2811.5 |
| 2020-01 | 180.1 | 2819.7 |
| 2020-02 | 179.3 | 2819.9 |
| 2020-03 | 179.7 | 2806.9 |
| 2020-04 | 169.1 | 2443.3 |
| 2020-05 | 174.2 | 2517.7 |
| 2020-06 | 174 | 2567.3 |
| 2020-07 | 172.5 | 2595.1 |
| 2020-08 | 172.8 | 2623.3 |
| 2020-09 | 172.6 | 2649.5 |
| 2020-10 | 173.4 | 2671.6 |
| 2020-11 | 174 | 2669.7 |
| 2020-12 | 175.1 | 2647.6 |
| 2021-01 | 176.1 | 2673.3 |
| 2021-02 | 176.1 | 2694.6 |
| 2021-03 | 176.8 | 2709.5 |
| 2021-04 | 176.6 | 2718.8 |
| 2021-05 | 176.4 | 2730.7 |
| 2021-06 | 175.6 | 2746.3 |
| 2021-07 | 177.4 | 2763.5 |
| 2021-08 | 177.2 | 2767.1 |
| 2021-09 | 177.8 | 2778.3 |
| 2021-10 | 179.2 | 2799.1 |
| 2021-11 | 179.8 | 2809.7 |
| 2021-12 | 180.5 | 2819.7 |
| 2022-01 | 180.5 | 2826.2 |
| 2022-02 | 181.7 | 2840.3 |
| 2022-03 | 181.2 | 2847.6 |
| 2022-04 | 183.6 | 2868.6 |
| 2022-05 | 183.2 | 2868.6 |
| 2022-06 | 183.2 | 2862.8 |
| 2022-07 | 183 | 2868.6 |
| 2022-08 | 183.6 | 2878 |
| 2022-09 | 184.2 | 2884.4 |
| 2022-10 | 184.4 | 2890.6 |
| 2022-11 | 185 | 2897.9 |
| 2022-12 | 184.1 | 2903 |
| 2023-01 | 184 | 2912.1 |
| 2023-02 | 183.8 | 2915.5 |
| 2023-03 | 184.6 | 2922.5 |
| 2023-04 | 185 | 2928.2 |
| 2023-05 | 185 | 2933.7 |
| 2023-06 | 185.8 | 2947.7 |
| 2023-07 | 185.6 | 2940.8 |
| 2023-08 | 186.7 | 2947.6 |
| 2023-09 | 185.2 | 2952 |
| 2023-10 | 183.5 | 2947.6 |
| 2023-11 | 182.8 | 2946.9 |
| 2023-12 | 184.5 | 2954.3 |
| 2024-01 | 184.2 | 2957.3 |
| 2024-02 | 187.1 | 2969.7 |
| 2024-03 | 185.6 | 2973.7 |
| 2024-04 | 184.6 | 2964.6 |
| 2024-05 | 187.4 | 2973.5 |
| 2024-06 | 187.4 | 2979.9 |
| 2024-07 | 187.5 | 2965.9 |
| 2024-08 | 187.3 | 2966.3 |
| 2024-09 | 187.5 | 2973.4 |
| 2024-10 | 187.3 | 2970.8 |
| 2024-11 | 187.2 | 2969 |
| 2024-12 | 187.6 | 2971.1 |
| 2025-01 | 188.2 | 2977 |
| 2025-02 | 187 | 2962.6 |
| 2025-03 | 186.6 | 2963.4 |
| 2025-04 | 185.1 | 2963.9 |
| 2025-05 | 184.4 | 2966.4 |
| 2025-06 | 182.8 | 2942.2 |
| 2025-07 | 183.9 | 2961.6 |
| 2025-08 | 184.2 | 2963.7 |
| 2025-09 | 184.1 | 2962.6 |
| 2025-10 | 185.4 | 2961 |
| 2025-11 | 185.1 | 2961.1 |
| 2025-12 | 186.5 | 2959.4 |
| 2026-01 | 188.5 | 2960.7 |
| 2026-02 | 189 | 2953.2 |
| 2026-03 | 188.5 | 2956 |
| 2026-04 | 187.9 | 2966.9 |
| 2026-05 | 187.4 | 2966 |
| 2026-06 | 189 | 2967.9 |
| 2026-07 | 189.5 | 2973.7 |
Sources and methods
All figures are descriptive. They do not estimate the effect of the September 2026 mortgage-rate increase on sales, prices or jobs.
Housing and all-items regional price parities and real per capita personal income (constant 2017 dollars) are from BEA SARPP/SARPI, calendar years 2008–2024, vintage bea-rpp-2026-02-19. Housing RPPs are estimated from tenant-occupied housing only; they are relative price levels (U.S. near 100), not a consumer-price index and not sale prices.
Per capita PCE, housing-and-utilities PCE, tenant rent and imputed owner-occupied rent are from BEA SAPCE, calendar years 1997–2024 (rent components 2010–2024), vintage bea-sapce-2025-09-26. Housing in PCE includes imputed rent for owner-occupiers and is not a cash mortgage payment. Figures are per resident, not per household.
Nominal per capita personal income is from BEA SAINC1, calendar years 2008–2025, vintage bea-regional-state-annual-2026-04-09.
Construction and total nonfarm payrolls are BLS State and Area Employment, seasonally adjusted, monthly January 2015–July 2026, snapshot 2026-08-24. Construction is the supersector, not residential building alone. Values are in thousands of jobs.
The 2024 housing-RPP bar chart uses a selected set of high-cost and Mountain West states plus the United States; it is not a complete 50-state ranking. Missing observations were not treated as zero. Provider snapshots lag the 19 September 2026 edition date; 2024 and 2025 annual series are not current-month observations.
Nulls were dropped, not filled. Duplicate rows were not observed in these extracts. Percent changes use the first and last available calendar years cited.
Research completed 2026-09-20, for the September 19, 2026 news edition. The available source data may cover earlier periods; see the observation periods and source vintages above.