Research
Before Hormuz, groceries already outspent the gas pump
A tiny bit more, on top of a very large bill
On Saturday, President Donald Trump told a Long Island crowd that Americans should accept gasoline at about $4.08 a gallon — up 29 percent from a year earlier — as "a tiny little bit more" to keep Iran from a bomb. Vice President JD Vance was less poetic: cheap fuel is "goal number one." Two years to the day after a 2024 grocery-table photo-op in Bedminster, a Reuters tally of those same staples found prices still up, with beef, apples and coffee doing the damage. The political question writes itself. The measurement question is more useful: before the Strait of Hormuz became a war zone, how big were groceries and the gas pump in the American consumption basket?
The Bureau of Economic Analysis cannot yet answer 2026. Its state personal consumption accounts run through calendar 2024. That is a feature, not a bug, for this purpose. It is the last full pre-war year: a baseline for what households were already spending when the administration asked them to file $4 gasoline under patriotism. In that year, Americans spent $4,350 per person on food and beverages purchased for off-premises consumption — the grocery line — and $1,295 on gasoline and other energy goods. Together that is $5,645 a person, or 9.7 percent of the $58,499 per capita consumption basket. Groceries alone were more than three times the motor-fuel line.
Call it tiny if you like. It is not a rounding error. A 29 percent jump applied to the 2024 motor-fuel line, with no change in gallons, would be about $376 more per person — arithmetic, not a forecast, and not a pump-price model. The grocery line had already risen 33 percent from 2019 to 2024, almost in lockstep with total spending. People do not pay shares. They pay cashiers.
The 2024 American consumption basket, per person

View exact chart values
| category | dollars_per_person | share_pct |
|---|---|---|
| Housing and utilities | 10595 | 18.11 |
| Health care | 9747 | 16.66 |
| Groceries (off-premises food and beverages) | 4350 | 7.44 |
| Food services and accommodations | 4201 | 7.18 |
| Gasoline and other energy goods | 1295 | 2.21 |
| All other goods and services | 28311 | 48.4 |
The share is calm; the dollars are not
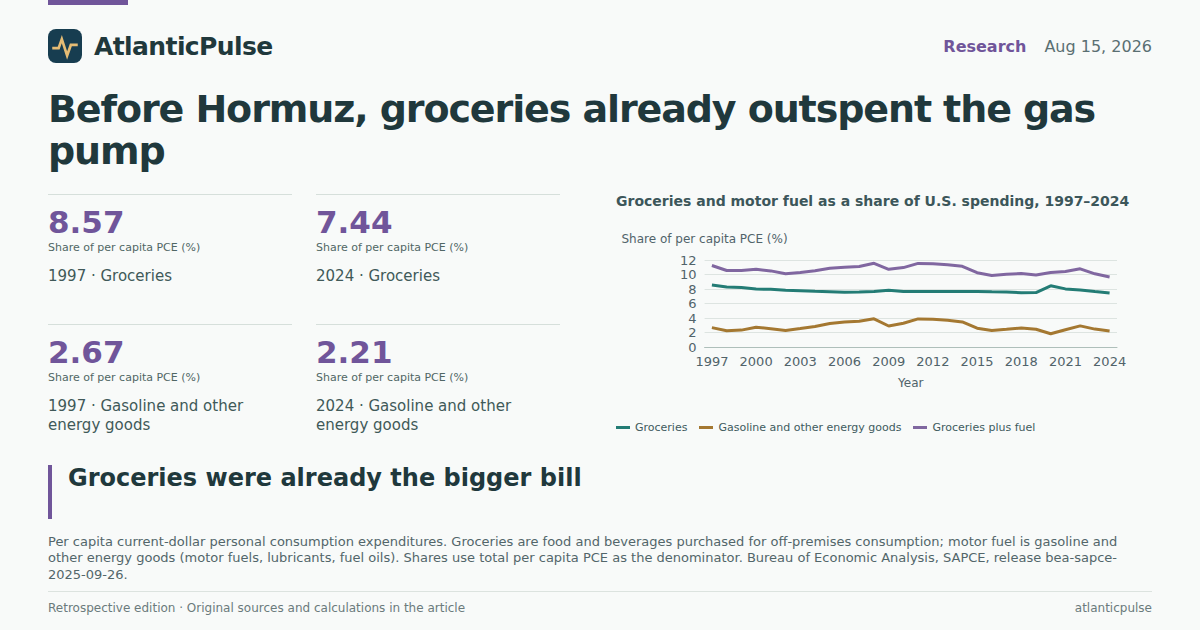
Here is the statistical joke at the center of the cost-of-living argument. As a share of per capita spending, groceries in 2024 were 7.4 percent — the lowest reading in the 1997–2024 BEA series. Motor fuel was 2.2 percent, well below the 3.9 percent peak of 2008 and the 2.9 percent of 2022. Combine them and 2024's 9.7 percent is among the lighter years, not the heavier ones. Housing and utilities ($10,595 a person, 18.1 percent) and health care ($9,747, 16.7 percent) remain the large, quiet rooms in the house. Dining out and hotels ($4,201) now rival the grocery aisle.
Shares fell because the whole basket inflated. From 2019 to 2024, grocery spending per person rose 32.6 percent, motor fuel 21.4 percent, and total PCE 33.8 percent. The grocery share barely moved (7.5 percent to 7.4 percent) while the grocery bill went from $3,280 to $4,350. Anyone who has watched a Bedminster receipt climb from a campaign prop to a $70 bag of meat and iced tea already knew this. Official consumption accounts agree, without the photo-op.
The last time motor fuel took a visibly larger bite was not a morality play. It was 2008 and 2011–2012, when gasoline and other energy goods exceeded 3.5 percent of spending, and 2022, when the per-person fuel line hit $1,541 — still the series high in dollars. 2024 was a comedown from that spike, which is why a fresh 29 percent pump-price jump lands on a public that had just been told the worst was over. The BEA series ends before the February 2026 war. It cannot tell you what 2026 gallons cost. It can tell you the floor onto which those gallons fall.
Groceries and motor fuel as a share of U.S. spending, 1997–2024

View exact chart values
| year | food_pc | gas_pc | pce_total_pc | food_share_pct | gas_share_pct | food_gas_share_pct |
|---|---|---|---|---|---|---|
| 1997 | 1741 | 542 | 20308 | 8.57 | 2.67 | 11.24 |
| 1998 | 1767 | 480 | 21306 | 8.29 | 2.25 | 10.55 |
| 1999 | 1848 | 525 | 22519 | 8.21 | 2.33 | 10.54 |
| 2000 | 1916 | 654 | 23983 | 7.99 | 2.73 | 10.72 |
| 2001 | 1979 | 625 | 24823 | 7.97 | 2.52 | 10.49 |
| 2002 | 1999 | 584 | 25550 | 7.82 | 2.29 | 10.11 |
| 2003 | 2067 | 677 | 26682 | 7.75 | 2.54 | 10.28 |
| 2004 | 2160 | 795 | 28114 | 7.68 | 2.83 | 10.51 |
| 2005 | 2261 | 960 | 29674 | 7.62 | 3.24 | 10.85 |
| 2006 | 2347 | 1071 | 31092 | 7.55 | 3.44 | 10.99 |
| 2007 | 2448 | 1147 | 32356 | 7.57 | 3.54 | 11.11 |
| 2008 | 2529 | 1286 | 33049 | 7.65 | 3.89 | 11.54 |
| 2009 | 2520 | 936 | 32243 | 7.82 | 2.9 | 10.72 |
| 2010 | 2543 | 1088 | 33164 | 7.67 | 3.28 | 10.95 |
| 2011 | 2628 | 1327 | 34309 | 7.66 | 3.87 | 11.53 |
| 2012 | 2692 | 1342 | 35145 | 7.66 | 3.82 | 11.48 |
| 2013 | 2749 | 1331 | 35956 | 7.65 | 3.7 | 11.35 |
| 2014 | 2852 | 1287 | 37194 | 7.67 | 3.46 | 11.13 |
| 2015 | 2927 | 991 | 38213 | 7.66 | 2.59 | 10.25 |
| 2016 | 2989 | 885 | 39238 | 7.62 | 2.26 | 9.87 |
| 2017 | 3094 | 992 | 40693 | 7.6 | 2.44 | 10.04 |
| 2018 | 3179 | 1116 | 42415 | 7.49 | 2.63 | 10.13 |
| 2019 | 3280 | 1067 | 43720 | 7.5 | 2.44 | 9.94 |
| 2020 | 3624 | 779 | 42920 | 8.44 | 1.82 | 10.26 |
| 2021 | 3889 | 1162 | 48539 | 8.01 | 2.39 | 10.41 |
| 2022 | 4173 | 1541 | 52961 | 7.88 | 2.91 | 10.79 |
| 2023 | 4270 | 1380 | 55917 | 7.64 | 2.47 | 10.1 |
| 2024 | 4350 | 1295 | 58499 | 7.44 | 2.21 | 9.65 |
The Southeast and the Plains feel fuel more
National averages hide the map. In 2024, the combined grocery-plus-fuel share ranged from 8.5 percent of per capita spending in the Mideast to 10.4 percent in the Southeast and 10.3 percent in the Plains. The Plains spent $1,628 a person on gasoline and other energy goods — almost $500 more than the Mideast's $1,097. New England spent the most on groceries ($4,839 a person) and still showed a smaller combined share, because its overall consumption basket ($68,190) is simply larger.
That is the difference between a price and a burden. A Long Island academy crowd and a West Texas commute do not meet the same cashier. New Jersey, home of the Bedminster grocery tableau, spent $4,429 a person on groceries and $1,150 on motor fuel in 2024 — 8.5 percent of a $65,873 basket, in line with the Mideast region that contains it. Texas spent a little less on food ($4,185) and more on fuel ($1,367), or 10.3 percent of a smaller $54,060 basket. None of these 2024 figures include a Hormuz surcharge. They do suggest who has less slack if one arrives.
Current-dollar PCE mixes prices and quantities. A high Plains fuel line can mean more miles, thirstier vehicles, or higher prices — the accounts do not say which. They also do not convert to household totals: these are per-person figures, and a three-person household is not three times a national average in any simple way. What they do say, without drama, is that motor fuel is a bigger slice of life where people already drive more of their budgets into the tank.
Where groceries and fuel take a larger bite, 2024

View exact chart values
| place | food_pc | gas_pc | total_pc | food_share_pct | gas_share_pct | food_gas_share_pct | food_gas_pc |
|---|---|---|---|---|---|---|---|
| Mideast | 4311 | 1097 | 63706 | 6.77 | 1.72 | 8.49 | 5408 |
| New England | 4839 | 1126 | 68190 | 7.1 | 1.65 | 8.75 | 5965 |
| Far West | 4782 | 1176 | 65357 | 7.32 | 1.8 | 9.12 | 5958 |
| Great Lakes | 4139 | 1374 | 55256 | 7.49 | 2.49 | 9.98 | 5513 |
| Rocky Mountain | 4479 | 1422 | 59011 | 7.59 | 2.41 | 10 | 5901 |
| Southwest | 4053 | 1376 | 53438 | 7.58 | 2.57 | 10.16 | 5429 |
| Plains | 4006 | 1628 | 54421 | 7.36 | 2.99 | 10.35 | 5634 |
| Southeast | 4340 | 1329 | 54565 | 7.95 | 2.44 | 10.39 | 5669 |
Beef and coffee did this without a blockade
The Reuters staple list blamed beef, apples and coffee. World commodity prices, from the IMF World Economic Outlook, make that less mysterious. Rebased to 2019=100, the IMF food price index was 134 in 2024. Beef was 125. Coffee was 235. The energy index, which had more than doubled by 2022 (232 on the same 2019 base), was back to 139 by 2024. In other words, the grocery villains of the Bedminster receipt were not waiting on Hormuz. They had already had a war, a pandemic, a livestock cycle and a coffee crop.
The same vintage carries 2025 estimates and 2026 projections that should not be mistaken for realized years. In that snapshot, beef keeps climbing (145 in 2025, 156 in 2026 on the 2019 base) and coffee spikes further in the 2025 estimate (296) before easing in the 2026 projection (242). The food index itself is roughly flat around 128–136. U.S. average consumer-price inflation in the same file is 3.0 percent for 2024, a 2.7 percent estimate for 2025, and a 3.2 percent projection for 2026 — a cooling from 8.0 percent in 2022, not a new shock. Those later years mix estimates and forecasts. They are not Saturday's receipt.
Unit labels in the commodity file are messy — the beef series is named in dollars per metric ton and coded in USCPP — so the honest use of the series is the change, not a converted supermarket price. Coffee is an index. None of this is the CPI for U.S. grocery aisles, which is not in the pinned catalogue. It is the world price weather system sitting over those aisles. It was already raining on beef and coffee before anyone declared the strait American.
Beef and coffee ran ahead of the broader food index

View exact chart values
| year | weo_status | food_2019eq100 | energy_2019eq100 | beef_2019eq100 | coffee_2019eq100 | wti_2019eq100 |
|---|---|---|---|---|---|---|
| 1992 | historical | 57.8 | 37.1 | 53.1 | 52.4 | 36.1 |
| 1993 | historical | 58.6 | 34.7 | 56.6 | 63.1 | 32.4 |
| 1994 | historical | 60.2 | 32.8 | 50.5 | 136.6 | 30.2 |
| 1995 | historical | 62.9 | 35.3 | 41.3 | 143.7 | 32.3 |
| 1996 | historical | 68.5 | 42 | 38.6 | 102.6 | 38.9 |
| 1997 | historical | 62.6 | 39.5 | 40.1 | 125.4 | 36.2 |
| 1998 | historical | 67.4 | 28.8 | 37.3 | 108.2 | 25.2 |
| 1999 | historical | 59.2 | 35.5 | 39.6 | 85.9 | 33.8 |
| 2000 | historical | 59.4 | 56.9 | 41.9 | 61.5 | 53.3 |
| 2001 | historical | 60 | 51.3 | 46 | 42.5 | 45.5 |
| 2002 | historical | 63.1 | 48.4 | 45.5 | 43.9 | 45.9 |
| 2003 | historical | 68.9 | 59.9 | 42.8 | 49.7 | 54.7 |
| 2004 | historical | 75.8 | 75.9 | 54.3 | 55.1 | 72.8 |
| 2005 | historical | 76.8 | 104.9 | 56.6 | 78.2 | 99.2 |
| 2006 | historical | 82.9 | 118.5 | 55.1 | 89.8 | 116.1 |
| 2007 | historical | 94.5 | 130 | 56.3 | 106.5 | 127.1 |
| 2008 | historical | 111.1 | 179.9 | 57.8 | 125.4 | 174.9 |
| 2009 | historical | 93.5 | 110.4 | 57 | 105.6 | 108.4 |
| 2010 | historical | 106.1 | 138.1 | 72.7 | 128.2 | 139.5 |
| 2011 | historical | 125.8 | 179.1 | 87.4 | 177.5 | 167 |
| 2012 | historical | 121.7 | 176.4 | 89.6 | 141.3 | 165.4 |
| 2013 | historical | 121.2 | 174.7 | 87.5 | 117.6 | 172 |
| 2014 | historical | 119.4 | 164.2 | 106.8 | 144.8 | 163.5 |
| 2015 | historical | 99.2 | 92 | 95.6 | 121 | 85.7 |
| 2016 | historical | 100.6 | 77.3 | 85 | 122.9 | 75.9 |
| 2017 | historical | 104.4 | 95.4 | 91.3 | 126.6 | 89.4 |
| 2018 | historical | 103.2 | 121.1 | 87.5 | 108.6 | 113.8 |
| 2019 | historical | 100 | 100 | 100 | 100 | 100 |
| 2020 | historical | 101.7 | 70.9 | 95.6 | 104.3 | 69.1 |
| 2021 | historical | 129.2 | 141.6 | 112.5 | 139.1 | 119.4 |
| 2022 | historical | 148.3 | 231.7 | 121.2 | 167.7 | 166.5 |
| 2023 | historical | 138.3 | 146.6 | 107.4 | 159.9 | 136.3 |
| 2024 | historical | 134 | 138.8 | 124.8 | 235.1 | 134.6 |
| 2025 | estimate | 127.9 | 126.2 | 144.9 | 296.5 | 115 |
| 2026 | projection | 135.5 | 150.2 | 156.5 | 242.1 | 131.9 |
The oil outlook still looks like 2024, not like a closed strait
If you only read the IMF oil strip, you would not guess that ship-tracker Kpler was counting two vessels a day through Hormuz. Annual average WTI in the pinned WEO snapshot is $76.61 a barrel in 2024, a $65.49 estimate for 2025, and a $75.09 projection for 2026. Brent is $79.91, $68.32, and $80.19. The average petroleum spot for 2026 is projected at $82.22. Those 2026 figures are projections in a file whose raw run is dated 10 August 2026. They are not a full-year average of a strait that, on 15 August, was mostly shut. They also do not look like 2022, when WTI averaged $94.80 and U.S. inflation was 8 percent.
That gap is the point. Pump prices at $4.08 and an annual outlook near $75–$82 can both be in the same folder if the outlook has not absorbed the war, if it assumes a short war, or if a 2026 annual average still has many un-lived months. This research does not adjudicate which. It does insist on the distinction. Treating the 2026 WEO oil number as Saturday's gasoline price would be a category error — the same error as treating 2024 grocery shares as proof that 2026 receipts cannot hurt.
The payoff for readers is unsentimental. Before the war, groceries were already a larger consumption line than motor fuel, and had been for the entire 1997–2024 record. Fuel's share was not screaming; fuel's price can still wreck a commute, especially in the Plains and the Southwest. World beef and coffee prices had already done a lot of the work that shoppers attributed to "the last few years." And the official oil outlook in this snapshot has not, on its face, priced a long closed strait. "A tiny little bit more" is a share talking. The dollar bills in the checkout lane do not speak share.
World oil prices in the IMF outlook, 1980–2026

View exact chart values
| year | wti | brent | avg_spot | food_index | energy_index | beef | coffee_index | us_inflation_pct | weo_status |
|---|---|---|---|---|---|---|---|---|---|
| 1980 | 37.879167 | 37.919089 | 37.919089 | — | — | — | — | 13.501722 | historical |
| 1981 | 36.1675 | 36.949308 | 36.949308 | — | — | — | — | 10.378313 | historical |
| 1982 | 32.67 | 32.9479 | 32.9479 | — | — | — | — | 6.158358 | historical |
| 1983 | 30.395627 | 29.810465 | 30.112811 | — | — | — | — | 3.15953 | historical |
| 1984 | 29.378265 | 28.743096 | 29.060681 | — | — | — | — | 4.368201 | historical |
| 1985 | 27.987756 | 27.624042 | 27.805899 | — | — | — | — | 3.527903 | historical |
| 1986 | 15.095139 | 14.474496 | 14.437832 | — | — | — | — | 1.943928 | historical |
| 1987 | 19.153568 | 18.408009 | 18.170088 | — | — | — | — | 3.578212 | historical |
| 1988 | 15.976209 | 14.963839 | 14.733524 | — | — | — | — | 4.100044 | historical |
| 1989 | 19.618777 | 18.230102 | 17.846823 | — | — | — | — | 4.791094 | historical |
| 1990 | 24.509717 | 23.706614 | 22.894739 | — | — | — | — | 5.419216 | historical |
| 1991 | 21.490191 | 20.07537 | 19.384901 | — | — | — | — | 4.21583 | historical |
| 1992 | 20.582609 | 19.358238 | 19.038837 | 57.431248 | 47.936578 | 111.335523 | 42.664648 | 3.041616 | historical |
| 1993 | 18.474046 | 17.084759 | 16.841103 | 58.263507 | 44.907376 | 118.738223 | 51.356431 | 2.96965 | historical |
| 1994 | 17.167957 | 15.959658 | 15.944269 | 59.853066 | 42.342945 | 105.817864 | 111.117311 | 2.595605 | historical |
| 1995 | 18.414001 | 17.198748 | 17.247063 | 62.542726 | 45.622117 | 86.501792 | 116.872775 | 2.80542 | historical |
| 1996 | 22.151895 | 20.80853 | 20.495445 | 68.096089 | 54.305538 | 80.969797 | 83.464161 | 2.936673 | historical |
| 1997 | 20.590988 | 19.310324 | 19.35173 | 62.165952 | 51.019194 | 84.16842 | 102.04558 | 2.337566 | historical |
| 1998 | 14.36787 | 13.126219 | 13.235742 | 66.935159 | 37.295675 | 78.294998 | 88.017493 | 1.547007 | historical |
| 1999 | 19.238576 | 18.108219 | 18.179252 | 58.781296 | 45.867667 | 83.13935 | 69.870641 | 2.193139 | historical |
| 2000 | 30.337584 | 28.845275 | 28.471002 | 59.020247 | 73.620516 | 87.789126 | 50.060811 | 3.366683 | historical |
| 2001 | 25.93326 | 24.713763 | 24.489567 | 59.594194 | 66.356472 | 96.540796 | 34.572151 | 2.816629 | historical |
| 2002 | 26.112816 | 25.115096 | 25.000525 | 62.701873 | 62.519301 | 95.403771 | 35.678698 | 1.59567 | historical |
| 2003 | 31.136691 | 28.779103 | 28.908935 | 68.485002 | 77.435057 | 89.735417 | 40.41313 | 2.297999 | historical |
| 2004 | 41.426909 | 38.23358 | 37.806716 | 75.357489 | 98.084593 | 113.907083 | 44.857292 | 2.667572 | historical |
| 2005 | 56.476646 | 54.683848 | 53.506305 | 76.31657 | 135.577868 | 118.729167 | 63.578782 | 3.36583 | historical |
| 2006 | 66.082639 | 65.604743 | 64.401518 | 82.408409 | 153.201783 | 115.635417 | 73.04483 | 3.222089 | historical |
| 2007 | 72.343299 | 72.652806 | 71.189201 | 93.901593 | 168.026946 | 118.038333 | 86.606785 | 2.87055 | historical |
| 2008 | 99.564914 | 97.330152 | 96.767402 | 110.410585 | 232.556898 | 121.103472 | 101.99155 | 3.814953 | historical |
| 2009 | 61.718093 | 61.58105 | 61.501471 | 92.863081 | 142.771699 | 119.622917 | 85.930212 | -0.320358 | historical |
| 2010 | 79.428751 | 79.807008 | 79.144482 | 105.39882 | 178.526563 | 152.474558 | 104.251591 | 1.63657 | historical |
| 2011 | 95.063104 | 111.539226 | 104.068651 | 124.982853 | 231.511767 | 183.178349 | 144.370826 | 3.139652 | historical |
| 2012 | 94.180817 | 112.011673 | 105.096617 | 120.880064 | 228.120976 | 187.942903 | 114.924517 | 2.073191 | historical |
| 2013 | 97.949823 | 108.961725 | 104.171815 | 120.464744 | 225.879893 | 183.561946 | 95.671002 | 1.465972 | historical |
| 2014 | 93.119387 | 99.345446 | 96.326128 | 118.607957 | 212.320695 | 224.058434 | 117.803079 | 1.615463 | historical |
| 2015 | 48.805325 | 53.022712 | 50.911922 | 98.550493 | 118.982121 | 200.494371 | 98.471297 | 0.121137 | historical |
| 2016 | 43.242523 | 45.079076 | 43.263857 | 100 | 100 | 178.208263 | 100 | 1.267361 | historical |
| 2017 | 50.907597 | 54.886916 | 52.977645 | 103.763748 | 123.300698 | 191.51059 | 102.971203 | 2.131445 | historical |
| 2018 | 64.815304 | 71.612593 | 68.532531 | 102.498123 | 156.534757 | 183.557031 | 88.333501 | 2.439 | historical |
| 2019 | 56.936923 | 64.198474 | 61.432334 | 99.366644 | 129.284979 | 209.697047 | 81.350011 | 1.813259 | historical |
| 2020 | 39.355435 | 43.333843 | 41.765498 | 101.085286 | 91.704893 | 200.435439 | 84.824065 | 1.252937 | historical |
| 2021 | 67.957075 | 70.8315 | 69.249978 | 128.364679 | 183.088723 | 235.957826 | 113.148949 | 4.681243 | historical |
| 2022 | 94.801181 | 98.996328 | 96.362059 | 147.402537 | 299.511084 | 254.206069 | 136.432716 | 7.990821 | historical |
| 2023 | 77.598185 | 82.321243 | 80.594907 | 137.427821 | 189.505015 | 225.276806 | 130.068604 | 4.126963 | historical |
| 2024 | 76.609899 | 79.911739 | 79.1708 | 133.137158 | 179.503691 | 261.762946 | 191.223936 | 2.95211 | historical |
| 2025 | 65.493941 | 68.324907 | 67.736784 | 127.07593 | 163.137109 | 303.940376 | 241.170422 | 2.729506 | estimate |
| 2026 | 75.089273 | 80.186512 | 82.217713 | 134.686014 | 194.133122 | 328.157977 | 196.951968 | 3.22791 | projection |
Sources and methods
Research date: 2026-09-11. This is retrospective enrichment using pinned catalogue snapshots, not a reconstruction of what was knowable on the 15 August 2026 edition date. Later releases may be present in the snapshots.
BEA Personal Consumption Expenditures by State (product bea_state_pce), snapshot created 2026-08-31T17:18:28Z, source release bea-sapce-2025-09-26. Series are annual per capita current-dollar PCE: total; food and beverages purchased for off-premises consumption; gasoline and other energy goods; housing and utilities; health care; food services and accommodations. Geography: United States, eight BEA regions, New Jersey, and Texas. Observation window: 1997–2024 for national series; calendar 2024 only for regions and the two states. Nulls: none in the extracted series. Duplicates: none. Missing is not zero; no interpolation.
Shares are current-dollar category PCE divided by current-dollar total PCE for the same geography and year. They mix price and quantity and are not constant-dollar volumes, household averages, or CPI inflation rates. Housing includes imputed owner-occupied rent and household utilities (electricity and piped gas), which are not the motor-fuel line. Food services and accommodations are not groceries. Regional figures are BEA regions, not states, except for the New Jersey and Texas illustrations.
IMF World Economic Outlook (product imf_weo), snapshot created 2026-08-24T14:09:54Z from raw run 20260810. Commodity series (WTI, Brent, average petroleum spot, food price index, energy price index, beef, coffee) are extracted for WEO world aggregate geography G001; U.S. inflation (PCPIPCH, average consumer prices, percent change) for USA. Dates are annual values stored as 1 January of each year, 1980–2026 where available (food, energy, beef, coffee begin 1992). Frequency is annual despite a monthly fact table name.
WEO years through 2024 are treated as historical; 2025 as estimate; 2026 as projection. The file does not flag realized versus forecast rows, so that split is an author convention based on WEO practice and the August 2026 vintage — not a field in the extract. Indexed charts rebase each series to 2019=100 from the extracted levels; they are not IMF-published 2019-based indices. Food, energy and coffee source indices appear to use a 2016=100 native base (2016 values equal 100). Beef is WEO PBEEF: the series name says US$/mt while the unit code is USCPP; no unit conversion is applied, and only index changes are interpreted.
A 29 percent arithmetic illustration applies the reported year-over-year U.S. gasoline pump-price change from Saturday's reporting to the 2024 per capita PCE motor-fuel dollar line, holding quantity fixed. It is not a 2026 estimate, not a CPI gasoline index, and not a household total.
Limitations: no U.S. retail gasoline or grocery CPI is in the indexed catalogue, so pump prices in the news cannot be replicated here. PCE ends in 2024 and cannot measure the Hormuz-war year. WEO 2026 oil prices are projections and must not be read as a realized blockade average. Dictionary presence of a geography is not per-series coverage; all reported series were confirmed by extract. No causal effect of the war, of tariffs, or of administration policy is inferred from these descriptive comparisons.
Research completed 2026-09-11, for the August 15, 2026 news edition. This is retrospective analysis, not a reconstruction of information available that day.