Research
Bayer’s 600 Ohio jobs, next to a chemical payroll that already exists
Six hundred jobs in a state that already has the factories
Gov. Mike DeWine said Bayer “could have chosen anywhere in the United States and chose Ohio,” announcing a $2.2 billion pharmaceutical plant in New Albany with about 600 permanent jobs and 1,500 construction jobs. Substance production is not due until 2031; finished-dose manufacturing is slated for 2034. Those 600 jobs are real, if they arrive. They are also small next to the chemical industry Ohio already books.
In July 2026, Ohio chemical manufacturing employed 48,700 people on a not-seasonally-adjusted basis, according to the Bureau of Labor Statistics. Bayer’s promised headcount is about 1.2 percent of that payroll. The state’s broader factory payroll, which is seasonally adjusted, was 688,700 the same month. Ohio does not publish a separate statewide series for pharmaceutical and medicine manufacturing, so the official comparison has to sit one NAICS rung up, in chemical manufacturing, which includes drugs, industrial chemicals, soaps and related products. That is a limitation, not a rounding error.
The chemical payroll is not a boom story. The annual average of those monthly figures fell from about 52,900 jobs in 2000 to about 43,000 in 2009, then recovered only part of the way, to 49,400 in 2025. July 2026 was 8.8 percent below July 2000. A plant that starts hiring in the 2030s would be walking into an industry that already shrank, then plateaued, not into an empty field.
Ohio’s chemical plants already employ about 49,000 people

View exact chart values
| year | jobs_thousands |
|---|---|
| 2000 | 52.91 |
| 2001 | 50.81 |
| 2002 | 49.31 |
| 2003 | 48.92 |
| 2004 | 47.78 |
| 2005 | 47.15 |
| 2006 | 46.94 |
| 2007 | 46.27 |
| 2008 | 45.62 |
| 2009 | 42.98 |
| 2010 | 43.14 |
| 2011 | 43.25 |
| 2012 | 43.68 |
| 2013 | 43.67 |
| 2014 | 43.71 |
| 2015 | 43.73 |
| 2016 | 44.33 |
| 2017 | 44.69 |
| 2018 | 45.59 |
| 2019 | 46.18 |
| 2020 | 45.94 |
| 2021 | 47.4 |
| 2022 | 48.75 |
| 2023 | 48.43 |
| 2024 | 48.61 |
| 2025 | 49.4 |
The output is larger than the headcount suggests
Jobs are not the whole ledger. Ohio’s chemical manufacturing GDP was $24.2 billion in 2024, or 2.6 percent of the state’s $923.1 billion all-industry economy that year, on BEA’s GDP-by-state accounts. Bayer’s $2.2 billion is a multi-year capital budget, not a year’s output, and it is about 9 percent of one year of Ohio chemical GDP. That is a sizable check. It is not a new industry.
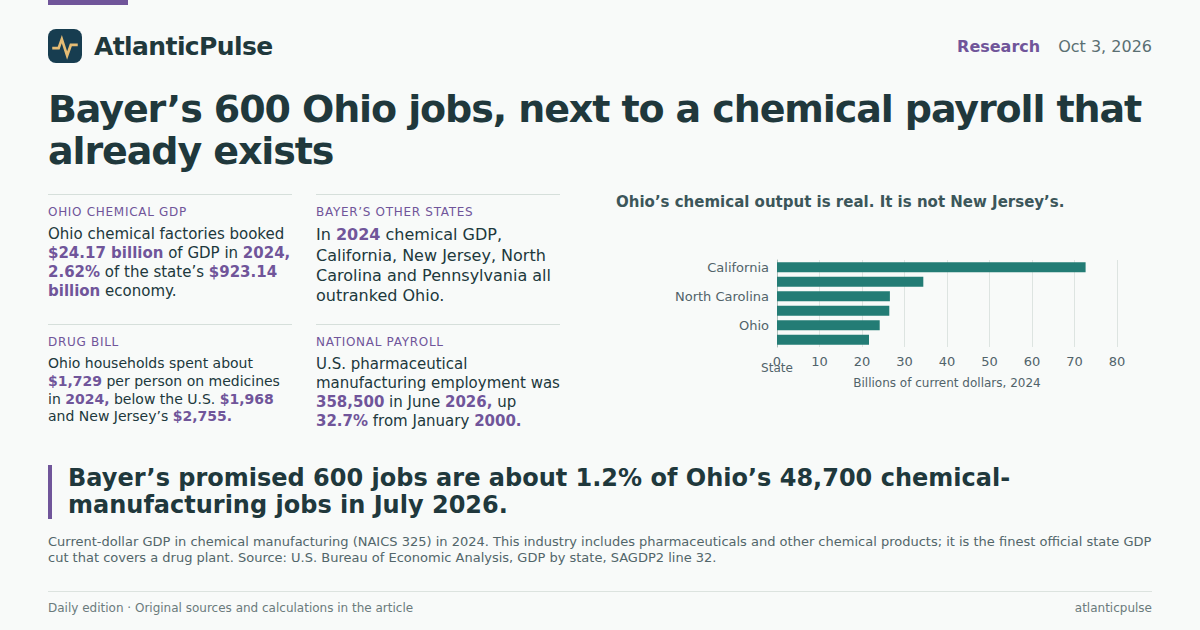
Among the states Bayer named as existing U.S. bases, Ohio is not the chemical champion. In 2024, California booked $72.6 billion in chemical manufacturing GDP, New Jersey $34.4 billion, North Carolina $26.6 billion, Pennsylvania $26.4 billion and Massachusetts $21.6 billion. Ohio sat fifth in that group. The United States as a whole booked $554.0 billion; Ohio’s share was 4.4 percent.
The volume of work has grown even as the payroll has not fully come back. Ohio’s real chemical GDP, in chained 2017 dollars, rose from $13.7 billion in 1997 to $20.8 billion in 2024, a 52 percent increase. Compensation of employees in the industry was $7.0 billion in 2024, or about $143,000 per Ohio chemical job using that year’s average payroll. New Jersey’s chemical compensation was $10.3 billion the same year. None of that proves Bayer will, or will not, raise those totals. It does show Ohio already has a chemical wage bill measured in billions, not hundreds of millions.
Ohio’s chemical output is real. It is not New Jersey’s.

View exact chart values
| state | chem_gdp_millions | chem_gdp_billions | year |
|---|---|---|---|
| California | 72613 | 72.61 | 2024 |
| New Jersey | 34422.7 | 34.42 | 2024 |
| North Carolina | 26569 | 26.57 | 2024 |
| Pennsylvania | 26428.1 | 26.43 | 2024 |
| Ohio | 24169.2 | 24.17 | 2024 |
| Massachusetts | 21645.8 | 21.65 | 2024 |
More chemical jobs do not always mean more chemical GDP

View exact chart values
| state | chem_jobs_thousands | chem_gdp_billions |
|---|---|---|
| Ohio | 48.6 | 24.17 |
| New Jersey | 50.4 | 34.42 |
| Pennsylvania | 43.5 | 26.43 |
| California | 77.7 | 72.61 |
| North Carolina | 47.4 | 26.57 |
The drug factories that Ohio will not count
Where states do publish the finer pharmaceutical-and-medicine cut, the picture is even less of a greenfield. New Jersey, Bayer’s U.S. pharmaceutical headquarters state, employed 29,000 people in pharmaceutical and medicine manufacturing in July 2026. California’s annual average was 42,700 in 2025, North Carolina’s 26,500 and Pennsylvania’s 20,300. Those figures are not all the same vintage or frequency, and they should not be stacked into a fake national total. They are enough to show that 600 jobs would be a rounding error in New Jersey and a noticeable, not transformative, add-on in Pennsylvania.
Nationally, the drug factories kept hiring. U.S. pharmaceutical and medicine manufacturing employment, seasonally adjusted, was 358,500 in June 2026, up 33 percent from 270,200 in January 2000, according to the Current Employment Statistics. Average hourly earnings in that industry were $44.73 in June 2026, up from $30.41 when the all-employee earnings series begins in March 2006. Ohio’s missing state series is the hole in that story, not evidence that Ohio has no drug plants.
In July 2026, among the Bayer-named states that publish monthly chemical payrolls, California had 74,200 chemical jobs, Ohio 48,700, New Jersey 46,400 and Pennsylvania 41,800. Massachusetts does not publish the series. A 2024 snapshot of jobs against GDP shows California’s chemical economy is much larger in output than in headcount relative to Ohio. New Jersey, with a similar-sized chemical payroll, booked substantially more chemical GDP.
America’s drug factories kept hiring. Ohio still will not publish the series.

View exact chart values
| period | jobs_thousands |
|---|---|
| 2000-07 | 275.4 |
| 2001-07 | 283.1 |
| 2002-07 | 291 |
| 2003-07 | 292.1 |
| 2004-07 | 290.8 |
| 2005-07 | 289.3 |
| 2006-07 | 292.2 |
| 2007-07 | 293.4 |
| 2008-07 | 291.7 |
| 2009-07 | 283.4 |
| 2010-07 | 276.5 |
| 2011-07 | 269.1 |
| 2012-07 | 270.3 |
| 2013-07 | 275.9 |
| 2014-07 | 278.4 |
| 2015-07 | 283.3 |
| 2016-07 | 286.2 |
| 2017-07 | 293.9 |
| 2018-07 | 297.2 |
| 2019-07 | 306.4 |
| 2020-07 | 313.2 |
| 2021-07 | 335.5 |
| 2022-07 | 347.8 |
| 2023-07 | 349.2 |
| 2024-07 | 351.7 |
| 2025-07 | 356.3 |
In July 2026, Ohio’s chemical payroll was still smaller than California’s

View exact chart values
| state | chem_jobs_thousands | month |
|---|---|---|
| California | 74.2 | 2026-07 |
| Ohio | 48.7 | 2026-07 |
| New Jersey | 46.4 | 2026-07 |
| Pennsylvania | 41.8 | 2026-07 |
The household drug bill is already the bigger number
The plant is supposed to make medicines for cancer, heart and kidney disease. Ohioans already buy a lot of those, wherever they are made. Household spending on pharmaceutical products in Ohio was $20.5 billion in 2024, or about $1,729 per resident, using BEA consumption accounts and the same year’s population. That is below the U.S. figure of $1,968 per person and well below New Jersey’s $2,755. The Ohio per-person bill has been climbing: $1,174 in 2015, $1,393 in 2020, $1,729 in 2024.
Those dollars are consumption, not factory shipments. A pill made in New Albany for export does not show up in Ohio’s household drug bill, and a pill imported into a Cleveland pharmacy does. The comparison still matters for the politics of the announcement. DeWine is selling jobs and a life-sciences brand. The official books say Ohio already spends more on medicines in a year than Bayer plans to invest over the life of the plant.
The payoff is unglamorous, which is the point. Six hundred jobs would be a 1 percent-class addition to a chemical payroll that has been stuck in the mid-to-high 40,000s for years. $2.2 billion would be a large check next to one year of chemical GDP and a small one next to Ohio’s $923 billion economy. If the plant is built on schedule, it will thicken an industry Ohio already has. It will not invent one.
Ohio households already spend about $1,700 a year on medicines

View exact chart values
| year | pce_millions | per_person_dollars |
|---|---|---|
| 2015 | 13705.4 | 1174 |
| 2016 | 13856.4 | 1184 |
| 2017 | 14133.6 | 1204 |
| 2018 | 14266.4 | 1213 |
| 2019 | 15117.7 | 1282 |
| 2020 | 16435 | 1393 |
| 2021 | 16221.9 | 1379 |
| 2022 | 17812.2 | 1514 |
| 2023 | 19293 | 1634 |
| 2024 | 20510.2 | 1729 |
Sources and methods
Payrolls are from BLS State and Area Employment and Current Employment Statistics snapshots dated 24 August 2026. Ohio, New Jersey, Pennsylvania and California chemical-manufacturing jobs are not seasonally adjusted monthly series; July 2026 is used for same-month comparisons. Ohio manufacturing totals are seasonally adjusted. National pharmaceutical-and-medicine manufacturing employment and hourly earnings are seasonally adjusted; the latest national employment observation in this extract is June 2026. Annual averages of monthly state series use all available months in the calendar year; 2026 Ohio chemical averages cover January–July only and are not treated as a full year.
Ohio does not publish statewide pharmaceutical-and-medicine manufacturing employment. Chemical manufacturing (NAICS 325) is used instead and includes pharmaceuticals plus other chemical products. That is a coarser industry than Bayer’s plant. New Jersey publishes both cuts; California, North Carolina and Pennsylvania publish pharmaceutical employment as annual series, which are not mixed with monthly figures in totals.
GDP, compensation and population are from BEA’s annual state accounts in the 9 April 2026 regional release. Chemical GDP and compensation end in 2024; Ohio all-industry GDP is available through 2025 and is used only as a 2025 total, not as a denominator for 2024 chemical GDP. Real GDP is millions of chained 2017 dollars. Compensation per Ohio chemical job divides 2024 compensation by the 2024 annual-average chemical payroll; it is not a household wage and is not hourly earnings.
Household pharmaceutical spending is BEA PCE by state, through 2024, divided by BEA population for the same year. It measures consumption of drugs, not Ohio factory output. Bayer’s $2.2 billion and 600 jobs are company and gubernatorial announcements about a future plant, not observed payrolls or GDP. No causal effect is inferred. These are retrospective official series, not current-day observations.
Research completed 2026-10-04, for the October 3, 2026 news edition. The available source data may cover earlier periods; see the observation periods and source vintages above.