Research
Atlantic City already lost the casino-hotel payroll New York is being asked to spare
The warning is about a remnant
Atlantic City’s casino operators spent Labor Day weekend asking Trenton not to license more gambling somewhere else. A new analysis for the Atlantic County Economic Alliance, reported by WHYY, said competition from New York City’s first full-scale casino, plus possible new licenses at the Meadowlands and Monmouth Park, could cost the region 5,100 jobs by 2035 — more than 8,000 if those New Jersey rivals open. Brick-and-mortar profits are already falling even as statewide gaming taxes hit records, because the growth is online. The report put casino-and-hotel employment at 21,172 earlier this year, the lowest in at least nine years.
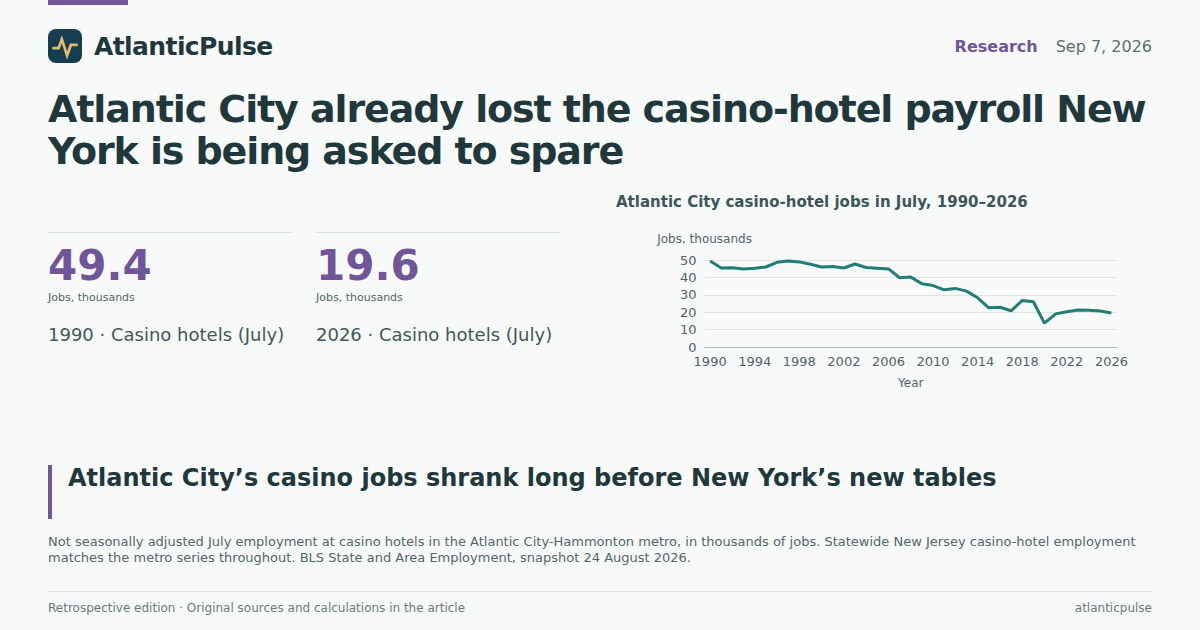
That is a real number of dealers, housekeepers and cooks. It is also a much smaller industry than the one that used to define the Boardwalk. The Bureau of Labor Statistics keeps a separate series for casino hotels in the Atlantic City-Hammonton metro. In July 2026 that series stood at 19,600 jobs, not seasonally adjusted. The same figure appears in the statewide New Jersey casino-hotel series: every casino-hotel job the BLS counts in New Jersey is still on the shore.
A further 5,100 jobs would be 26 percent of that remaining casino-hotel payroll. Eight thousand would be 41 percent. Those are arithmetic comparisons, not forecasts. They do show why the operators sound urgent. They also show that most of the disappearance already happened.
Atlantic City casino-hotel jobs in July, 1990–2026

View exact chart values
| year | ac_casino_july_thousands | ac_casino_july_jobs | casino_index_1990 | nj_casino_july_thousands | ac_leisure_july_thousands | casino_share_of_leisure_pct | ac_nonfarm_july_thousands | casino_share_of_metro_pct | nonfarm_index_1990 |
|---|---|---|---|---|---|---|---|---|---|
| 1990 | 49.4 | 49400 | 100 | 49.4 | 79.6 | 62.1 | 191.4 | 25.8 | 100 |
| 1991 | 45.4 | 45400 | 91.9 | 45.4 | 75.4 | 60.2 | 181.8 | 25 | 95 |
| 1992 | 45.5 | 45500 | 92.1 | 45.5 | 75.5 | 60.3 | 182.9 | 24.9 | 95.6 |
| 1993 | 44.8 | 44800 | 90.7 | 44.8 | 75.3 | 59.5 | 183.5 | 24.4 | 95.9 |
| 1994 | 45.3 | 45300 | 91.7 | 45.3 | 76.3 | 59.4 | 187.6 | 24.1 | 98 |
| 1995 | 46 | 46000 | 93.1 | 46 | 77.5 | 59.4 | 190.2 | 24.2 | 99.4 |
| 1996 | 48.7 | 48700 | 98.6 | 48.7 | 79.8 | 61 | 194.1 | 25.1 | 101.4 |
| 1997 | 49.4 | 49400 | 100 | 49.4 | 81.5 | 60.6 | 197.1 | 25.1 | 103 |
| 1998 | 48.9 | 48900 | 99 | 48.9 | 80.5 | 60.7 | 195.9 | 25 | 102.4 |
| 1999 | 47.5 | 47500 | 96.2 | 47.5 | 81.2 | 58.5 | 201.3 | 23.6 | 105.2 |
| 2000 | 46 | 46000 | 93.1 | 46 | 80.1 | 57.4 | 201.8 | 22.8 | 105.4 |
| 2001 | 46.3 | 46300 | 93.7 | 46.3 | 81.9 | 56.5 | 204.3 | 22.7 | 106.7 |
| 2002 | 45.4 | 45400 | 91.9 | 45.4 | 80.2 | 56.6 | 204.6 | 22.2 | 106.9 |
| 2003 | 47.7 | 47700 | 96.6 | 47.7 | 82.8 | 57.6 | 209.9 | 22.7 | 109.7 |
| 2004 | 45.7 | 45700 | 92.5 | 45.7 | 82.2 | 55.6 | 211.9 | 21.6 | 110.7 |
| 2005 | 45.3 | 45300 | 91.7 | 45.3 | 82.2 | 55.1 | 213.3 | 21.2 | 111.4 |
| 2006 | 44.9 | 44900 | 90.9 | 44.9 | 82.7 | 54.3 | 215.4 | 20.8 | 112.5 |
| 2007 | 39.8 | 39800 | 80.6 | 39.8 | 77.4 | 51.4 | 209.3 | 19 | 109.4 |
| 2008 | 40.2 | 40200 | 81.4 | 40.2 | 77.5 | 51.9 | 207.2 | 19.4 | 108.3 |
| 2009 | 36.4 | 36400 | 73.7 | 36.4 | 72.9 | 49.9 | 195.9 | 18.6 | 102.4 |
| 2010 | 35.3 | 35300 | 71.5 | 35.3 | 72.2 | 48.9 | 195.7 | 18 | 102.2 |
| 2011 | 32.9 | 32900 | 66.6 | 32.9 | 69.9 | 47.1 | 191.3 | 17.2 | 99.9 |
| 2012 | 33.7 | 33700 | 68.2 | 33.7 | 72.3 | 46.6 | 193.6 | 17.4 | 101.1 |
| 2013 | 32.1 | 32100 | 65 | 32.1 | 71.2 | 45.1 | 194 | 16.5 | 101.4 |
| 2014 | 28.3 | 28300 | 57.3 | 28.3 | 68.3 | 41.4 | 192.4 | 14.7 | 100.5 |
| 2015 | 22.5 | 22500 | 45.5 | 22.5 | 62.2 | 36.2 | 187.3 | 12 | 97.9 |
| 2016 | 22.8 | 22800 | 46.2 | 22.8 | 63 | 36.2 | 188 | 12.1 | 98.2 |
| 2017 | 20.8 | 20800 | 42.1 | 20.8 | 61.8 | 33.7 | 187.4 | 11.1 | 97.9 |
| 2018 | 26.8 | 26800 | 54.3 | 26.8 | 68.8 | 39 | 194.5 | 13.8 | 101.6 |
| 2019 | 26 | 26000 | 52.6 | 26 | 68.6 | 37.9 | 194.4 | 13.4 | 101.6 |
| 2020 | 13.7 | 13700 | 27.7 | 13.7 | 43.5 | 31.5 | 156.1 | 8.8 | 81.6 |
| 2021 | 19 | 19000 | 38.5 | 19 | 59.8 | 31.8 | 180.7 | 10.5 | 94.4 |
| 2022 | 20.3 | 20300 | 41.1 | 20.3 | 64.1 | 31.7 | 188.8 | 10.8 | 98.6 |
| 2023 | 21.3 | 21300 | 43.1 | 21.3 | 66.2 | 32.2 | 191.3 | 11.1 | 99.9 |
| 2024 | 21.1 | 21100 | 42.7 | 21.1 | 66.7 | 31.6 | 191.7 | 11 | 100.2 |
| 2025 | 20.7 | 20700 | 41.9 | 20.7 | 66.3 | 31.2 | 192.5 | 10.8 | 100.6 |
| 2026 | 19.6 | 19600 | 39.7 | 19.6 | 61.1 | 32.1 | 184.7 | 10.6 | 96.5 |
The jobs left before New York dealt a card
July is the honest month for a beach town: the summer peak, comparable across decades. In July 1990, Atlantic City casino hotels employed 49,400 people. By July 2006, just before Pennsylvania’s casino wave matured, the count was still 44,900. Then it fell in steps — 39,800 in 2007, 32,100 in 2013, 22,500 in 2015 after several properties closed — and never returned to the old plateau. July 2019, the last full summer before the pandemic, was 26,000. July 2026 was 19,600, down 25 percent from 2019 and 60 percent from 1990.
The pandemic was a hole, not the whole story. Casino-hotel employment collapsed to 1,500 in May 2020, recovered to about 21,000 by the summers of 2023 and 2024, and then slipped again. January 2026, the winter trough, was 18,300. That is in the same neighborhood as the Alliance’s 21,172 “casinos and hotels” figure, which covers a slightly wider set of properties. Either way, the Boardwalk is no longer employing anything like the 40,000-plus casino-hotel workforce of the 1990s and early 2000s.
New York’s new tables may yet take more. The official payroll cannot say that they already did. Resorts World’s live games in Queens opened in April 2026. The July 2026 count is one summer later. A one-year dip from 20,700 in July 2025 to 19,600 is real, and it is also smaller than the losses of 2007, 2014–15 or 2020. What the series does establish is that Atlantic City spent two decades shrinking its casino-hotel payroll while New Jersey as a whole kept adding leisure-and-hospitality jobs.
Casino hotels shrank. The rest of the metro mostly did not.

View exact chart values
| year | casino_hotels_index_1990 | metro_nonfarm_index_1990 |
|---|---|---|
| 1990 | 100 | 100 |
| 1991 | 91.9 | 95 |
| 1992 | 92.1 | 95.6 |
| 1993 | 90.7 | 95.9 |
| 1994 | 91.7 | 98 |
| 1995 | 93.1 | 99.4 |
| 1996 | 98.6 | 101.4 |
| 1997 | 100 | 103 |
| 1998 | 99 | 102.4 |
| 1999 | 96.2 | 105.2 |
| 2000 | 93.1 | 105.4 |
| 2001 | 93.7 | 106.7 |
| 2002 | 91.9 | 106.9 |
| 2003 | 96.6 | 109.7 |
| 2004 | 92.5 | 110.7 |
| 2005 | 91.7 | 111.4 |
| 2006 | 90.9 | 112.5 |
| 2007 | 80.6 | 109.4 |
| 2008 | 81.4 | 108.3 |
| 2009 | 73.7 | 102.4 |
| 2010 | 71.5 | 102.2 |
| 2011 | 66.6 | 99.9 |
| 2012 | 68.2 | 101.1 |
| 2013 | 65 | 101.4 |
| 2014 | 57.3 | 100.5 |
| 2015 | 45.5 | 97.9 |
| 2016 | 46.2 | 98.2 |
| 2017 | 42.1 | 97.9 |
| 2018 | 54.3 | 101.6 |
| 2019 | 52.6 | 101.6 |
| 2020 | 27.7 | 81.6 |
| 2021 | 38.5 | 94.4 |
| 2022 | 41.1 | 98.6 |
| 2023 | 43.1 | 99.9 |
| 2024 | 42.7 | 100.2 |
| 2025 | 41.9 | 100.6 |
| 2026 | 39.7 | 96.5 |
The metro found other work. The casino floor did not.
If casino hotels were still a quarter of the local economy, another 5,100 jobs would be a municipal emergency. They used to be. In July 1990, casino hotels were 26 percent of Atlantic City-Hammonton’s nonfarm payroll and 62 percent of its leisure-and-hospitality jobs. In July 2026 they were 11 percent of the metro and 32 percent of leisure. The rest of the local job market did not vanish with them.
Index both series to July 1990 and the split is stark. Casino-hotel employment is at 40. Metro nonfarm employment is at 97 — almost back to where it started, after a 2020 collapse and a recovery that restaurants, hospitals, logistics and government did more of the lifting for. Seasonally adjusted, the metro’s total payroll in July 2026 was 171,000. That is not a boomtown. It is also not a one-industry ruin.
Statewide, New Jersey’s leisure-and-hospitality sector is much larger than Atlantic City’s casino hotels, and it is not especially unusual. In July 2026, seasonally adjusted, New Jersey had 396,000 leisure-and-hospitality jobs, 9.1 percent of a 4.36 million payroll. New York State had 920,000, 9.2 percent of 9.96 million. Those shares have been in a tight band for a decade, pandemic aside. The political fight in Trenton is over a specialized slice of one metro, not over whether New Jersey still has a visitor economy.
Casino hotels as a share of Atlantic City’s July payroll

View exact chart values
| year | ac_casino_july_thousands | ac_casino_july_jobs | casino_index_1990 | nj_casino_july_thousands | ac_leisure_july_thousands | casino_share_of_leisure_pct | ac_nonfarm_july_thousands | casino_share_of_metro_pct | nonfarm_index_1990 |
|---|---|---|---|---|---|---|---|---|---|
| 1990 | 49.4 | 49400 | 100 | 49.4 | 79.6 | 62.1 | 191.4 | 25.8 | 100 |
| 1991 | 45.4 | 45400 | 91.9 | 45.4 | 75.4 | 60.2 | 181.8 | 25 | 95 |
| 1992 | 45.5 | 45500 | 92.1 | 45.5 | 75.5 | 60.3 | 182.9 | 24.9 | 95.6 |
| 1993 | 44.8 | 44800 | 90.7 | 44.8 | 75.3 | 59.5 | 183.5 | 24.4 | 95.9 |
| 1994 | 45.3 | 45300 | 91.7 | 45.3 | 76.3 | 59.4 | 187.6 | 24.1 | 98 |
| 1995 | 46 | 46000 | 93.1 | 46 | 77.5 | 59.4 | 190.2 | 24.2 | 99.4 |
| 1996 | 48.7 | 48700 | 98.6 | 48.7 | 79.8 | 61 | 194.1 | 25.1 | 101.4 |
| 1997 | 49.4 | 49400 | 100 | 49.4 | 81.5 | 60.6 | 197.1 | 25.1 | 103 |
| 1998 | 48.9 | 48900 | 99 | 48.9 | 80.5 | 60.7 | 195.9 | 25 | 102.4 |
| 1999 | 47.5 | 47500 | 96.2 | 47.5 | 81.2 | 58.5 | 201.3 | 23.6 | 105.2 |
| 2000 | 46 | 46000 | 93.1 | 46 | 80.1 | 57.4 | 201.8 | 22.8 | 105.4 |
| 2001 | 46.3 | 46300 | 93.7 | 46.3 | 81.9 | 56.5 | 204.3 | 22.7 | 106.7 |
| 2002 | 45.4 | 45400 | 91.9 | 45.4 | 80.2 | 56.6 | 204.6 | 22.2 | 106.9 |
| 2003 | 47.7 | 47700 | 96.6 | 47.7 | 82.8 | 57.6 | 209.9 | 22.7 | 109.7 |
| 2004 | 45.7 | 45700 | 92.5 | 45.7 | 82.2 | 55.6 | 211.9 | 21.6 | 110.7 |
| 2005 | 45.3 | 45300 | 91.7 | 45.3 | 82.2 | 55.1 | 213.3 | 21.2 | 111.4 |
| 2006 | 44.9 | 44900 | 90.9 | 44.9 | 82.7 | 54.3 | 215.4 | 20.8 | 112.5 |
| 2007 | 39.8 | 39800 | 80.6 | 39.8 | 77.4 | 51.4 | 209.3 | 19 | 109.4 |
| 2008 | 40.2 | 40200 | 81.4 | 40.2 | 77.5 | 51.9 | 207.2 | 19.4 | 108.3 |
| 2009 | 36.4 | 36400 | 73.7 | 36.4 | 72.9 | 49.9 | 195.9 | 18.6 | 102.4 |
| 2010 | 35.3 | 35300 | 71.5 | 35.3 | 72.2 | 48.9 | 195.7 | 18 | 102.2 |
| 2011 | 32.9 | 32900 | 66.6 | 32.9 | 69.9 | 47.1 | 191.3 | 17.2 | 99.9 |
| 2012 | 33.7 | 33700 | 68.2 | 33.7 | 72.3 | 46.6 | 193.6 | 17.4 | 101.1 |
| 2013 | 32.1 | 32100 | 65 | 32.1 | 71.2 | 45.1 | 194 | 16.5 | 101.4 |
| 2014 | 28.3 | 28300 | 57.3 | 28.3 | 68.3 | 41.4 | 192.4 | 14.7 | 100.5 |
| 2015 | 22.5 | 22500 | 45.5 | 22.5 | 62.2 | 36.2 | 187.3 | 12 | 97.9 |
| 2016 | 22.8 | 22800 | 46.2 | 22.8 | 63 | 36.2 | 188 | 12.1 | 98.2 |
| 2017 | 20.8 | 20800 | 42.1 | 20.8 | 61.8 | 33.7 | 187.4 | 11.1 | 97.9 |
| 2018 | 26.8 | 26800 | 54.3 | 26.8 | 68.8 | 39 | 194.5 | 13.8 | 101.6 |
| 2019 | 26 | 26000 | 52.6 | 26 | 68.6 | 37.9 | 194.4 | 13.4 | 101.6 |
| 2020 | 13.7 | 13700 | 27.7 | 13.7 | 43.5 | 31.5 | 156.1 | 8.8 | 81.6 |
| 2021 | 19 | 19000 | 38.5 | 19 | 59.8 | 31.8 | 180.7 | 10.5 | 94.4 |
| 2022 | 20.3 | 20300 | 41.1 | 20.3 | 64.1 | 31.7 | 188.8 | 10.8 | 98.6 |
| 2023 | 21.3 | 21300 | 43.1 | 21.3 | 66.2 | 32.2 | 191.3 | 11.1 | 99.9 |
| 2024 | 21.1 | 21100 | 42.7 | 21.1 | 66.7 | 31.6 | 191.7 | 11 | 100.2 |
| 2025 | 20.7 | 20700 | 41.9 | 20.7 | 66.3 | 31.2 | 192.5 | 10.8 | 100.6 |
| 2026 | 19.6 | 19600 | 39.7 | 19.6 | 61.1 | 32.1 | 184.7 | 10.6 | 96.5 |
Households did not stop betting. They stopped needing the Boardwalk to do it.
The Bureau of Economic Analysis tracks what households spend on gambling, by the state where they live, not by the casino they visit. That is a different question from how many dealers Atlantic City employs, and it is the one that explains the operators’ other complaint: statewide gaming revenue is fine; the rooms and tables are not.
In 2024, New Jersey residents spent $7.59 billion on gambling, 1.21 percent of all personal consumption in the state. New York residents spent $10.03 billion, a smaller 0.76 percent of a much larger spending pie. Pennsylvania, whose casinos were supposed to have already stolen Atlantic City’s lunch, spent $7.50 billion. Nevada residents spent only $2.67 billion — a reminder that Las Vegas lives on other people’s trips, which do not show up in Nevada’s household accounts. The United States as a whole spent $207 billion.
New Jersey’s gambling bill has more than tripled since 1997, when it was $2.19 billion. The rise continued through the years when casino-hotel jobs were collapsing, and it accelerated after 2020, when sportsbooks and online games filled the hole the closed floors left. That is not proof that internet betting caused the Boardwalk’s job loss. It is proof that “New Jersey still gambles” and “Atlantic City still employs dealers” are no longer the same sentence.
Household gambling spending, 2024

View exact chart values
| state | gambling_pce_2024_millions |
|---|---|
| Nevada | 2674.8 |
| Pennsylvania | 7501.1 |
| New Jersey | 7587.7 |
| New York | 10032.2 |
New Jersey households kept spending more on gambling

View exact chart values
| year | nj_gambling_pce_millions | ny_gambling_pce_millions | pa_gambling_pce_millions | nv_gambling_pce_millions | us_gambling_pce_millions |
|---|---|---|---|---|---|
| 1997 | 2191.3 | 3717.1 | 1958.7 | 510.4 | 54513.3 |
| 1998 | 2217.6 | 3714.2 | 1990 | 574.3 | 55880.7 |
| 1999 | 2507 | 4021.4 | 2166.5 | 718.5 | 62340.8 |
| 2000 | 2608.4 | 4263.2 | 2312.1 | 851.6 | 67555.9 |
| 2001 | 2941.2 | 4283.8 | 2434.1 | 924.6 | 69989.7 |
| 2002 | 3404.2 | 4360.3 | 2605.8 | 1057.1 | 74057.2 |
| 2003 | 3657.8 | 4773 | 2948.6 | 1132.2 | 81133.7 |
| 2004 | 3950.8 | 5186.2 | 3224.2 | 1203.8 | 89865.5 |
| 2005 | 4204.2 | 5673.6 | 3344.5 | 1293.6 | 96091 |
| 2006 | 4606 | 6212.2 | 3598.3 | 1307.5 | 104111.2 |
| 2007 | 4915.6 | 6520.3 | 3779.9 | 1335.4 | 109259.6 |
| 2008 | 4974 | 6546.9 | 3902.8 | 1331.9 | 110722.7 |
| 2009 | 4807.8 | 6434.2 | 3892.9 | 1280.6 | 107215.1 |
| 2010 | 4855 | 6640.3 | 3901.9 | 1325.6 | 109368.2 |
| 2011 | 4902.7 | 6797.4 | 3880 | 1358.5 | 111455.1 |
| 2012 | 5070.5 | 7060 | 4064.6 | 1451.2 | 115467.3 |
| 2013 | 5123.5 | 7365.5 | 4255.9 | 1428.5 | 120262 |
| 2014 | 5154.4 | 7692 | 4195.2 | 1470.1 | 124574 |
| 2015 | 5212.2 | 8039.2 | 4468.2 | 1573 | 129812.8 |
| 2016 | 5266.3 | 8437.1 | 4611.3 | 1644.6 | 135163.9 |
| 2017 | 5362 | 8737.8 | 4830.1 | 1745.9 | 142270 |
| 2018 | 5571.6 | 8601.8 | 5231 | 1858 | 147315.3 |
| 2019 | 5541.1 | 8318.7 | 5619.4 | 1875.8 | 147833.9 |
| 2020 | 4723.3 | 6662.9 | 4750.8 | 1527.2 | 125218 |
| 2021 | 6089 | 8332.3 | 6003.3 | 1946.3 | 161190.6 |
| 2022 | 6647.1 | 8838.2 | 6657.4 | 2279.4 | 177281.6 |
| 2023 | 7157.4 | 9499.6 | 6908.4 | 2467.8 | 190809 |
| 2024 | 7587.7 | 10032.2 | 7501.1 | 2674.8 | 206949.2 |
What the next 5,100 would actually be
The Alliance’s 5,100-job scenario is a projection through 2035, not a measurement. Official payrolls cannot validate it. They can put it in scale. Against 19,600 casino-hotel jobs in July 2026, 5,100 is a quarter of the remaining specialized workforce and about 3 percent of the metro’s 185,000 July jobs. Against the 49,400 casino-hotel jobs of July 1990, it is a rounding error on a loss already booked.
The output numbers tell the same story from a different door. New Jersey’s accommodation-and-food-services industry, which does include casino hotels, produced $15.8 billion of real GDP in 2025, 2.3 percent of a $688 billion state economy, according to the BEA’s regional accounts. The narrower “amusement, gambling, and recreation” industry — which the BEA warns does not include casino hotels, because those sit in accommodation — was $3.1 billion of real output in 2024. Neither is a pillar of New Jersey’s GDP. Both can still be the difference between a shift and a layoff for the people who have the jobs.
The useful question for readers is not whether New York competition is “real.” It is whether Atlantic City is still waiting to become a smaller casino town, or whether it already is one, with a visitor economy that has diversified just enough that the next loss will hurt the floor more than the metro. The official books say the second thing. They also say New Jersey households never lost the habit the Boardwalk used to monopolize. The argument in Trenton is over who gets to sell it to them next.
Sources and methods
This is retrospective enrichment using pinned catalogue snapshots, not an as-known-on-the-edition-date reconstruction. The research date is 11 September 2026. The historical edition date is 7 September 2026. Later releases and revisions may be present in the snapshots.
Employment is from BLS State and Area Employment (product bls_sae), snapshot created 24 August 2026, series history through July 2026. Casino-hotel and Atlantic City leisure and nonfarm counts used here are not seasonally adjusted; July of each year is compared with July to avoid mixing summer peaks with winter troughs. Statewide New Jersey and New York leisure-and-hospitality and total nonfarm counts are seasonally adjusted. Units are thousands of jobs; job counts in the text multiply by 1,000 and round. Null values were skipped, not treated as zero. Where duplicate observations shared a period, the first was kept.
The BLS casino-hotels series is narrower than the Atlantic County Economic Alliance’s casinos-and-hotels employment figure of 21,172 cited in contemporaneous reporting. The two should not be forced to match. Statewide New Jersey casino-hotel employment equals the Atlantic City-Hammonton series in every overlapping month in this extract, so the state’s casino-hotel payroll is the metro’s.
Household gambling spending is BEA state personal consumption expenditures on gambling (product bea_state_pce), 2025-09-26 release, annual 1997–2024, millions of current dollars, residence-based. It includes lotteries, sports betting and other gambling, not only casino floors, and it does not measure visitor spending in Atlantic City or Las Vegas. Shares of total PCE use the matching state totals. Nevada’s low resident figure is not a measure of the Las Vegas industry.
State GDP is BEA annual real GDP in millions of chained 2017 dollars (product bea_regional_state_annual), 2026-04-09 release, through 2025. Accommodation and food services (NAICS 72) includes casino hotels. Amusement, gambling, and recreation (NAICS 713) does not; the BEA documentation states that casino hotels are classified in accommodation. Those series are not added together as the gambling economy.
The 5,100- and 8,000-job figures are projections from contemporaneous reporting, not official observations. Dividing them by July 2026 casino-hotel employment is a scale comparison only. This article does not infer that New York casinos caused Atlantic City’s job loss, or that online betting did. Descriptive comparisons of levels, shares and index changes are not causal estimates.
Research completed 2026-09-11, for the September 7, 2026 news edition. This is retrospective analysis, not a reconstruction of information available that day.