Research
Anduril's 3,100 jobs, next to the shipyard payroll America already has
The promise is large. The national shipyard payroll is not what it was.
Anduril's Sparrows Point plan is being sold as a return of heavy industry to a place that used to make ships for the Navy. The company says it will invest $3.7 billion, hire from 2029, and eventually employ more than 3,100 people on a permanent basis, with a much larger construction-and-indirect count around 14,000. The Navy's contract is up to $2.9 billion for components, not the building. Those are promises with a start date three years out. The question for Maryland, and for anyone who has watched shipyard announcements come and go, is what payroll is actually on the books now.
The official national count is smaller than the rhetoric. Seasonally adjusted U.S. ship and boat building employment stood at 149,200 in June 2026, the last month in this extract. That is the entire country's NAICS 3366 payroll: nuclear yards, repair docks, and recreational-boat shops lumped together. The same series averaged 173,700 jobs in 1990. A narrower cousin, ship building and repairing, was 107,800 in June 2026. Anduril's 3,100 permanent jobs, if they arrive on schedule, would equal about 2 percent of today's national ship-and-boat-building workforce. That is not nothing. It is also not a new Electric Boat.
U.S. ship and boat building never got back to the 1990 payroll

View exact chart values
| year | jobs_thousands | jobs |
|---|---|---|
| 1990 | 173.7 | 173708 |
| 1991 | 164.8 | 164842 |
| 1992 | 157.8 | 157792 |
| 1993 | 147.7 | 147717 |
| 1994 | 146.5 | 146550 |
| 1995 | 147.7 | 147667 |
| 1996 | 146.7 | 146717 |
| 1997 | 146.2 | 146217 |
| 1998 | 153.8 | 153767 |
| 1999 | 153.9 | 153867 |
| 2000 | 154.1 | 154108 |
| 2001 | 148.2 | 148158 |
| 2002 | 147.3 | 147325 |
| 2003 | 147.1 | 147092 |
| 2004 | 149.3 | 149325 |
| 2005 | 154.5 | 154500 |
| 2006 | 157.3 | 157350 |
| 2007 | 160 | 160017 |
| 2008 | 155.8 | 155800 |
| 2009 | 130.6 | 130600 |
| 2010 | 124.6 | 124642 |
| 2011 | 122.5 | 122550 |
| 2012 | 128.9 | 128925 |
| 2013 | 131.8 | 131775 |
| 2014 | 137.1 | 137125 |
| 2015 | 138.3 | 138300 |
| 2016 | 135.5 | 135483 |
| 2017 | 134.5 | 134467 |
| 2018 | 138.7 | 138650 |
| 2019 | 142.5 | 142458 |
| 2020 | 139.8 | 139783 |
| 2021 | 147.5 | 147517 |
| 2022 | 150.5 | 150467 |
| 2023 | 153.8 | 153800 |
| 2024 | 151.6 | 151575 |
| 2025 | 149.5 | 149483 |
| 2026 | 148.7 | 148700 |
Maryland already replaced the mill with something else
Sparrows Point's last mill closed in 2012. The state's factory payroll did most of its shrinking before that, then stopped. Maryland manufacturing employment was 111,700 in July 2026, seasonally adjusted, down 45 percent from 202,400 in July 1990 and essentially unchanged from 112,100 in July 2012. Factories now account for about 4 percent of Maryland's 2.82 million nonfarm jobs. Construction, the industry that would pour Anduril's slabs, employed 165,700 in July 2026 — more people than manufacturing, and a bit above its 1990 level.
Inside the metro that would actually host the yard, the factory story is bleaker. Baltimore-Columbia-Towson manufacturing employment was 59,000 in July 2026, not seasonally adjusted, against 128,800 in January 1990. That series is not seasonally adjusted, so month-to-month wiggles are not the point; the long decline is. Anduril's 3,100 permanent jobs would be about 3 percent of Maryland's remaining factory payroll and about 5 percent of the Baltimore metro's. Gov. Wes Moore is right that 3,100 jobs would be a lot for one site. They would not reverse a 35-year slide.
The construction number is the tell. Maryland has kept a large building trades workforce even as factories left. A 2-million-square-foot shipyard is, first, a construction project. Treating the 14,000-job headline as if it were a new manufacturing base mixes temporary site work, suppliers, and a much smaller permanent shop floor. The state employment survey cannot see Anduril's future. It can see that Maryland already has more construction jobs than factory jobs, and that the factory number stopped falling around the time the mill went dark.
Maryland’s factory payroll shrank. Construction did not.

View exact chart values
| year | manufacturing_thousands | manufacturing_jobs | construction_thousands | construction_jobs |
|---|---|---|---|---|
| 1990 | 201.4 | 201425 | 157.9 | 157917 |
| 1991 | 188.6 | 188600 | 131.2 | 131158 |
| 1992 | 180.6 | 180567 | 122.1 | 122075 |
| 1993 | 176.8 | 176842 | 122.1 | 122058 |
| 1994 | 176.9 | 176867 | 128.1 | 128075 |
| 1995 | 176.5 | 176500 | 131.6 | 131633 |
| 1996 | 173.7 | 173742 | 136.1 | 136083 |
| 1997 | 175.1 | 175142 | 140.9 | 140867 |
| 1998 | 175.3 | 175275 | 143.8 | 143783 |
| 1999 | 173.7 | 173675 | 151.2 | 151233 |
| 2000 | 174.1 | 174083 | 159 | 158967 |
| 2001 | 168.4 | 168375 | 164.7 | 164725 |
| 2002 | 156.7 | 156692 | 165.8 | 165783 |
| 2003 | 147.2 | 147200 | 167.8 | 167817 |
| 2004 | 143 | 143008 | 176.1 | 176142 |
| 2005 | 141 | 140950 | 183.6 | 183617 |
| 2006 | 136.9 | 136942 | 189 | 189017 |
| 2007 | 134 | 133950 | 188.5 | 188450 |
| 2008 | 130.2 | 130208 | 178.8 | 178767 |
| 2009 | 121.3 | 121292 | 153.7 | 153733 |
| 2010 | 116.9 | 116883 | 143.4 | 143375 |
| 2011 | 115.2 | 115200 | 143.4 | 143417 |
| 2012 | 111.6 | 111600 | 143.7 | 143708 |
| 2013 | 108.5 | 108492 | 146.2 | 146167 |
| 2014 | 105.8 | 105825 | 149.5 | 149525 |
| 2015 | 106.3 | 106300 | 154.3 | 154333 |
| 2016 | 106.3 | 106283 | 161 | 161025 |
| 2017 | 107.9 | 107883 | 162.4 | 162433 |
| 2018 | 110.1 | 110058 | 163.4 | 163375 |
| 2019 | 112.7 | 112700 | 166.4 | 166417 |
| 2020 | 108.6 | 108650 | 160.1 | 160142 |
| 2021 | 108.8 | 108800 | 160.5 | 160533 |
| 2022 | 110.8 | 110750 | 161 | 161050 |
| 2023 | 111.4 | 111417 | 161 | 160992 |
| 2024 | 111 | 111017 | 164.3 | 164267 |
| 2025 | 110.6 | 110608 | 164.9 | 164858 |
| 2026 | 111.2 | 111200 | 166.7 | 166714 |
The boats would still be finished somewhere else
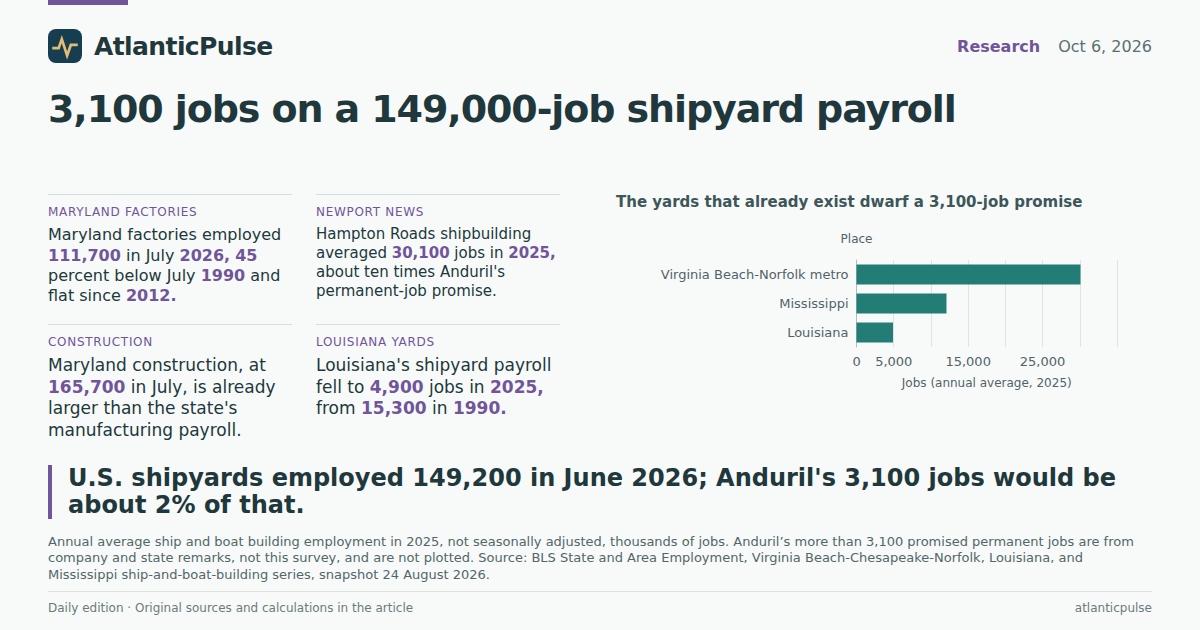
Anduril would not deliver a submarine. Super-modules would move by water to General Dynamics Electric Boat in Connecticut and HII's Newport News Shipbuilding in Virginia. Those two yards are not a rounding error. The Virginia Beach-Chesapeake-Norfolk metro, which includes Newport News, employed 30,100 people in ship and boat building in 2025, on an annual, not-seasonally-adjusted basis. That single metro payroll is about ten times Anduril's permanent-job promise. It is also larger than it was in 1990, when the same series stood at 26,400.
Other published shipyard states tell a less comforting story. Mississippi, home to Ingalls, averaged 12,100 ship-and-boat-building jobs in 2025. Louisiana, which used to have a substantial yard economy, averaged 4,900 — down from 15,300 in 1990. Maryland does not even publish a ship-and-boat-building series in this survey, which is itself a finding: the state's remaining factories are not, on the official books, a shipyard industry waiting to be scaled. Connecticut publishes transportation-equipment manufacturing, a much broader bucket that includes aircraft engines as well as Electric Boat. That series averaged 45,600 jobs in 2025, down from 82,900 in 1990. It is not a clean shipyard count, and it should not be treated as one.
Put the existing yards on a bar chart and Anduril's 3,100 jobs would sit below Mississippi and far below Hampton Roads. That is the industrial geography the Navy is trying to unstick. Completing 1.1 to 1.2 Virginia-class boats a year against a two-a-year target is a bottleneck story. Adding a module shop in Baltimore could matter at the margin. It does not, on these figures, recreate the mid-Atlantic as a third nuclear shipyard.
The yards that already exist dwarf a 3,100-job promise

View exact chart values
| place | jobs | year | thousands |
|---|---|---|---|
| Louisiana | 4900 | 2025 | 4.9 |
| Mississippi | 12100 | 2025 | 12.1 |
| Virginia Beach-Norfolk metro | 30100 | 2025 | 30.1 |
Hampton Roads held on. Louisiana’s yards did not.

View exact chart values
| year | virginia_beach_jobs | louisiana_jobs | mississippi_jobs | us_ship_boat_jobs |
|---|---|---|---|---|
| 1990 | 26400 | 15300 | 14900 | 173708 |
| 1991 | 27000 | 16000 | 17600 | 164842 |
| 1992 | 24900 | 14500 | 18700 | 157792 |
| 1993 | 23300 | 13800 | 16200 | 147717 |
| 1994 | 22100 | 14800 | 15400 | 146550 |
| 1995 | 22200 | 14000 | 14200 | 147667 |
| 1996 | 21200 | 14600 | 13300 | 146717 |
| 1997 | 20400 | 16300 | 12700 | 146217 |
| 1998 | 19800 | 16700 | 16400 | 153767 |
| 1999 | 17200 | 16200 | 17600 | 153867 |
| 2000 | 19400 | 15500 | 14900 | 154108 |
| 2001 | 19300 | 15200 | 13400 | 148158 |
| 2002 | 20100 | 14900 | 13700 | 147325 |
| 2003 | 20800 | 15400 | 13600 | 147092 |
| 2004 | 21600 | 15300 | 14400 | 149325 |
| 2005 | 21800 | 14600 | 14200 | 154500 |
| 2006 | 22200 | 14600 | 13900 | 157350 |
| 2007 | 22700 | 15400 | 14400 | 160017 |
| 2008 | 22800 | 14600 | 15200 | 155800 |
| 2009 | 23100 | 13100 | 15000 | 130600 |
| 2010 | 23700 | 11900 | 14800 | 124642 |
| 2011 | 24400 | 11500 | 13200 | 122550 |
| 2012 | 25900 | 10900 | 12600 | 128925 |
| 2013 | 27100 | 10200 | 12700 | 131775 |
| 2014 | 27800 | 10000 | 13800 | 137125 |
| 2015 | 26100 | 8100 | 13300 | 138300 |
| 2016 | 23400 | 6100 | 12800 | 135483 |
| 2017 | 24100 | 5500 | 12300 | 134467 |
| 2018 | 27500 | 5000 | 11900 | 138650 |
| 2019 | 29800 | 5300 | 11700 | 142458 |
| 2020 | 29900 | 5300 | 12100 | 139783 |
| 2021 | 30100 | 5200 | 12500 | 147517 |
| 2022 | 29400 | 5000 | 12400 | 150467 |
| 2023 | 30100 | 5100 | 12200 | 153800 |
| 2024 | 30900 | 5000 | 12400 | 151575 |
| 2025 | 30100 | 4900 | 12100 | 149483 |
| 2026 | — | — | — | 148700 |
The factory states in this deal are still running at half speed
Index July 1990 manufacturing employment to 100 and the three states named in the announcement look alike. By July 2026 Maryland was at 55, Virginia at 59, Connecticut at 52. U.S. ship and boat building, on the same July index, was at 85 in 2025 — hurt, but less than the broader factory payrolls around it. Virginia still has 229,000 manufacturing jobs, more than twice Maryland's, which is what you would expect in a state that kept Newport News. Maryland did not keep Sparrows Point.
None of this says the yard should not be built. The Navy needs torpedo tubes, and Anduril is betting it can break the work into simpler jobs. The payroll record says something narrower and more useful: America already has a shipbuilding workforce of about 149,000, it is smaller than it was a generation ago, Maryland's factories did not come back after the mill closed, and the yards that still finish nuclear boats employ tens of thousands of people in Virginia. Three thousand permanent jobs in 2030 would be a real shop. They would not be a renaissance, and they should not be mistaken for one on a campaign stage.
Factory payrolls in the submarine states are still about half of 1990

View exact chart values
| year | md_index | md_thousands | va_index | va_thousands | ct_index | ct_thousands | us_ship_index | us_ship_thousands |
|---|---|---|---|---|---|---|---|---|
| 1990 | 100 | 202.4 | 100 | 388.9 | 100 | 301.5 | 100 | 176.5 |
| 1991 | 91.4 | 185 | 96.4 | 374.8 | 93.3 | 281.2 | 92.6 | 163.4 |
| 1992 | 89 | 180.1 | 95.6 | 371.9 | 90.6 | 273.2 | 89.4 | 157.8 |
| 1993 | 87.2 | 176.4 | 95.2 | 370.4 | 86.4 | 260.4 | 82.8 | 146.2 |
| 1994 | 88 | 178.2 | 95.5 | 371.3 | 83.9 | 253 | 84 | 148.2 |
| 1995 | 87.2 | 176.5 | 96.6 | 375.5 | 81.6 | 245.9 | 83.3 | 147.1 |
| 1996 | 85.8 | 173.6 | 95.6 | 371.6 | 80.4 | 242.3 | 83.6 | 147.5 |
| 1997 | 86.5 | 175 | 96.7 | 376.1 | 80.6 | 243 | 82.3 | 145.2 |
| 1998 | 85 | 172.1 | 96.8 | 376.5 | 82.5 | 248.6 | 88 | 155.3 |
| 1999 | 85.8 | 173.7 | 94.1 | 365.9 | 79.2 | 238.7 | 84.5 | 149.2 |
| 2000 | 86.2 | 174.4 | 93.2 | 362.6 | 78.3 | 236 | 88.4 | 156.1 |
| 2001 | 83.2 | 168.3 | 87.5 | 340.4 | 74.6 | 225 | 83.3 | 147.1 |
| 2002 | 76.9 | 155.7 | 82.1 | 319.1 | 69.1 | 208.3 | 83.9 | 148 |
| 2003 | 72.2 | 146.1 | 77.8 | 302.6 | 65.2 | 196.6 | 82.6 | 145.8 |
| 2004 | 70.8 | 143.3 | 77 | 299.4 | 64.8 | 195.4 | 84.5 | 149.1 |
| 2005 | 69.3 | 140.3 | 76 | 295.7 | 63.9 | 192.6 | 88.8 | 156.7 |
| 2006 | 67.7 | 137.1 | 74.4 | 289.4 | 63.5 | 191.6 | 89.9 | 158.6 |
| 2007 | 66.2 | 134 | 71.6 | 278.5 | 62.3 | 187.8 | 90 | 158.8 |
| 2008 | 64.4 | 130.3 | 68.2 | 265.4 | 61.3 | 184.8 | 88.7 | 156.5 |
| 2009 | 59.2 | 119.9 | 61 | 237.2 | 55.1 | 166.1 | 73.1 | 129 |
| 2010 | 57.9 | 117.1 | 59.3 | 230.5 | 54.1 | 163.2 | 71.4 | 126.1 |
| 2011 | 56.9 | 115.1 | 59.8 | 232.5 | 54.3 | 163.6 | 68 | 120.1 |
| 2012 | 55.4 | 112.1 | 59.6 | 231.8 | 53.6 | 161.6 | 72.7 | 128.4 |
| 2013 | 53.5 | 108.2 | 59.4 | 231.1 | 53.2 | 160.4 | 75 | 132.4 |
| 2014 | 52 | 105.2 | 59.7 | 232.2 | 51.9 | 156.6 | 78.5 | 138.5 |
| 2015 | 52.7 | 106.6 | 60.3 | 234.4 | 52.1 | 157.1 | 78.1 | 137.8 |
| 2016 | 52.4 | 106 | 59.9 | 232.9 | 51.9 | 156.4 | 76.5 | 135 |
| 2017 | 53.2 | 107.6 | 60.4 | 234.8 | 52.7 | 159 | 76.1 | 134.3 |
| 2018 | 54.6 | 110.5 | 62.1 | 241.7 | 53.4 | 160.9 | 78.8 | 139.1 |
| 2019 | 56 | 113.3 | 62.6 | 243.5 | 53.8 | 162.2 | 80.8 | 142.7 |
| 2020 | 53 | 107.2 | 59.1 | 229.9 | 50.3 | 151.7 | 77 | 135.9 |
| 2021 | 53.4 | 108 | 60.9 | 236.8 | 50.7 | 152.9 | 83.7 | 147.8 |
| 2022 | 54.9 | 111.1 | 63.1 | 245.5 | 52.2 | 157.5 | 83.6 | 147.6 |
| 2023 | 55.3 | 111.9 | 63.1 | 245.4 | 52.4 | 157.9 | 87.5 | 154.5 |
| 2024 | 54.8 | 110.9 | 62.6 | 243.5 | 51.6 | 155.6 | 85.9 | 151.6 |
| 2025 | 54.4 | 110.1 | 61 | 237.2 | 50.4 | 152.1 | 84.7 | 149.5 |
| 2026 | 55.2 | 111.7 | 58.9 | 229 | 52 | 156.8 | — | — |
Sources and methods
Payroll figures are from the U.S. Bureau of Labor Statistics Current Employment Statistics (national) and State and Area Employment (state and metro) snapshots dated 24 August 2026. They are not 6 October 2026 observations; the latest national ship-and-boat-building month in the extract is June 2026, and the latest Maryland manufacturing month is July 2026.
Ship and boat building is NAICS 3366. Ship building and repairing is the narrower 336611 series. Maryland has no published SAE ship-and-boat-building series in this catalogue; that absence is treated as missing, not zero.
National CES series used here are seasonally adjusted monthly. Maryland manufacturing, construction and nonfarm series are seasonally adjusted monthly. Baltimore manufacturing is not seasonally adjusted. Virginia Beach, Louisiana and Mississippi ship series are annual, not seasonally adjusted, through 2025. Connecticut transportation-equipment manufacturing (NAICS 336) includes aircraft and other transport equipment, not just shipyards.
Annual averages for 2026 are year-to-date (six months for the national ship series, seven for Maryland). Jobs counts are thousands-of-jobs figures multiplied by 1,000 and rounded. Null observations were not treated as zero.
Anduril's more than 3,100 permanent jobs, 14,000 total-jobs figure, $3.7 billion investment and 2029 hiring date come from 6 October 2026 reporting of company and official remarks, not from BLS. Ratios of that promise to BLS payrolls are descriptive. They are not a forecast of hiring, local multipliers, or submarine output, and they do not imply that the yard will raise Maryland manufacturing employment.
Research completed 2026-10-07, for the October 6, 2026 news edition. The available source data may cover earlier periods; see the observation periods and source vintages above.