Research
America's Poorest State Is Also One of Its Cheapest. The Math Still Doesn't Work.
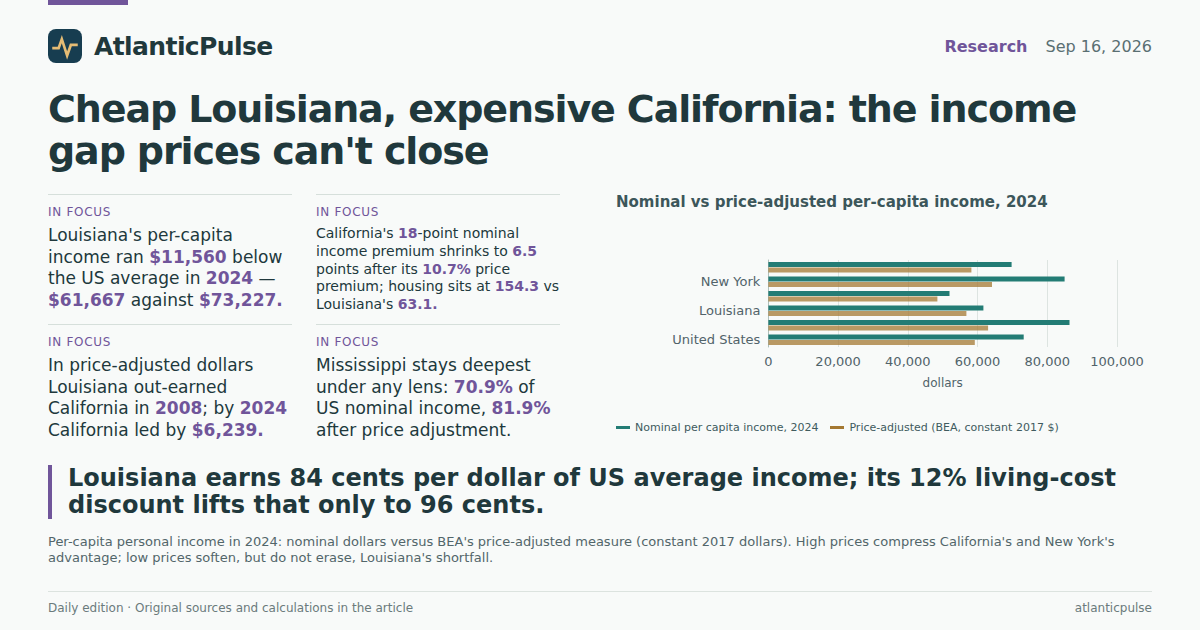
Census week handed us a two-state puzzle
Tuesday's Census release made Louisiana the poverty story of the year: one in five residents below the poverty line, the nation's worst rate, with a median household income around $60,000 against $87,000 nationally (WBRZ). California got the uncomfortable silver medal — its supplemental poverty rate, the one that accounts for living costs, is far above the national figure not because pay is low but because everything costs more, housing most of all (CalMatters). Two states, two very different poverty engines: Louisiana's is an income problem; California's is a price problem.
That distinction invites an obvious question the poverty tables can't answer on their own: when you actually adjust incomes for what things cost in each place, how much does Louisiana's cheapness rescue it — and how much of California's wealth survives its own price tags? The Bureau of Economic Analysis maintains exactly the machinery for this: annual per-capita personal income for every state going back to 1929 (BEA regional data), and regional price parities — a state-by-state price index pinned to a US average of 100 — paired with an official price-adjusted income series (BEA RPP). So we pulled both books for the US, Louisiana, California, Mississippi, New York and Texas and ran the numbers.
The income side: poor, and drifting further from the boom
Start with cash. Louisiana's per-capita personal income was $61,667 in 2024 — $11,560 below the national average of $73,227, or 84.2 cents on the average American dollar. Mississippi sits far deeper at 70.9 percent; Texas runs just under parity at 95.3 percent; California and New York take 118 and 116 percent respectively. In the current-year figures, Louisiana is at 83.7 percent of the national average for 2025 ($63,940 against $76,393), so the gap has not closed.
The longer history is the part locals will recognize. Louisiana spent most of a century between 55 and 85 percent of the national average, then rode the 2006–2013 energy boom and post-storm reconstruction closer to the mainstream than it had ever been — peaking at 93.9 percent of the US average in 2010. What followed was not a catastrophe but a slow decoupling: oil prices slid, and the national economy — powered by exactly the coastal, tech-and-finance growth Louisiana lacks — accelerated away. By 2024 the state was back at 84.2 percent, roughly where it sat in the mid-1990s.
Set the states side by side since 1998 and the divergence is stark. California has climbed from about 105 percent of the national average to 119 percent; New York holds far above; Louisiana and Mississippi drift sideways in the 70s and 80s. This is the nominal picture — the one that shows up in poverty statistics and 'poorest state' headlines.
Louisiana's per-capita income as a share of the US average, 1929–2025

View exact chart values
| year | la_pct_of_us |
|---|---|
| 1929 | 58.5 |
| 1930 | 56.8 |
| 1931 | 59.7 |
| 1932 | 59.2 |
| 1933 | 60.3 |
| 1934 | 61.6 |
| 1935 | 60.6 |
| 1936 | 60.9 |
| 1937 | 60.8 |
| 1938 | 65.3 |
| 1939 | 64 |
| 1940 | 60.8 |
| 1941 | 63.7 |
| 1942 | 66.3 |
| 1943 | 71.6 |
| 1944 | 73.6 |
| 1945 | 72 |
| 1946 | 66.1 |
| 1947 | 66.4 |
| 1948 | 70.6 |
| 1949 | 77 |
| 1950 | 73.8 |
| 1951 | 72.4 |
| 1952 | 73 |
| 1953 | 73.5 |
| 1954 | 73.5 |
| 1955 | 72.7 |
| 1956 | 74.4 |
| 1957 | 77.2 |
| 1958 | 77.3 |
| 1959 | 75.9 |
| 1960 | 73.9 |
| 1961 | 74.3 |
| 1962 | 73.7 |
| 1963 | 75.1 |
| 1964 | 74.4 |
| 1965 | 74.5 |
| 1966 | 75.6 |
| 1967 | 77.4 |
| 1968 | 77.6 |
| 1969 | 75.7 |
| 1970 | 76.1 |
| 1971 | 76.6 |
| 1972 | 76.1 |
| 1973 | 76.4 |
| 1974 | 79.2 |
| 1975 | 80.9 |
| 1976 | 82.5 |
| 1977 | 82.9 |
| 1978 | 84.1 |
| 1979 | 85 |
| 1980 | 86.9 |
| 1981 | 89 |
| 1982 | 88.8 |
| 1983 | 86.7 |
| 1984 | 84.2 |
| 1985 | 82.5 |
| 1986 | 78.7 |
| 1987 | 76.3 |
| 1988 | 76 |
| 1989 | 75.9 |
| 1990 | 78.3 |
| 1991 | 80.3 |
| 1992 | 80.9 |
| 1993 | 81.9 |
| 1994 | 83.4 |
| 1995 | 83.1 |
| 1996 | 82.4 |
| 1997 | 82.2 |
| 1998 | 81 |
| 1999 | 79.3 |
| 2000 | 78.3 |
| 2001 | 81.2 |
| 2002 | 82.6 |
| 2003 | 82.6 |
| 2004 | 81.9 |
| 2005 | 84 |
| 2006 | 88.9 |
| 2007 | 91.5 |
| 2008 | 93.8 |
| 2009 | 93.6 |
| 2010 | 93.9 |
| 2011 | 91.4 |
| 2012 | 91.9 |
| 2013 | 92.3 |
| 2014 | 91.9 |
| 2015 | 88.4 |
| 2016 | 86 |
| 2017 | 85.3 |
| 2018 | 85.3 |
| 2019 | 84.6 |
| 2020 | 84.8 |
| 2021 | 85.2 |
| 2022 | 83.4 |
| 2023 | 84.1 |
| 2024 | 84.2 |
| 2025 | 83.7 |
State per-capita income as a share of the US average, 1998–2025

View exact chart values
| year | california | new_york | texas | louisiana | mississippi |
|---|---|---|---|---|---|
| 1998 | 105.1 | 116.4 | 92.9 | 81 | 73.4 |
| 1999 | 106.8 | 117.7 | 92.5 | 79.3 | 72.3 |
| 2000 | 108.6 | 117.7 | 92.5 | 78.3 | 70.8 |
| 2001 | 107.5 | 117.8 | 93.8 | 81.2 | 72.3 |
| 2002 | 107.1 | 116.3 | 92.7 | 82.6 | 73 |
| 2003 | 107.8 | 114.6 | 92.4 | 82.6 | 73.7 |
| 2004 | 108.2 | 114.4 | 91 | 81.9 | 74 |
| 2005 | 108.6 | 114 | 92.9 | 84 | 74.9 |
| 2006 | 109.5 | 115.6 | 93.6 | 88.9 | 73.5 |
| 2007 | 108.8 | 118.8 | 93.2 | 91.5 | 74.3 |
| 2008 | 106.2 | 117.3 | 97.5 | 93.8 | 75.2 |
| 2009 | 106 | 119.4 | 94.7 | 93.6 | 76.9 |
| 2010 | 106.4 | 119.8 | 95.9 | 93.9 | 77 |
| 2011 | 106.7 | 119 | 98.3 | 91.4 | 76.1 |
| 2012 | 108 | 119 | 99.2 | 91.9 | 75.6 |
| 2013 | 108.3 | 119.1 | 100 | 92.3 | 76.5 |
| 2014 | 109.3 | 117.7 | 101 | 91.9 | 74.8 |
| 2015 | 112 | 117.8 | 97.3 | 88.4 | 73 |
| 2016 | 114.1 | 119.2 | 93.7 | 86 | 72.8 |
| 2017 | 114.1 | 122 | 95.1 | 85.3 | 71.7 |
| 2018 | 114.4 | 120.5 | 96.3 | 85.3 | 70.6 |
| 2019 | 115.6 | 119.6 | 95.9 | 84.6 | 70.4 |
| 2020 | 118.5 | 118.9 | 92.7 | 84.8 | 71.8 |
| 2021 | 119.2 | 118.1 | 93.4 | 85.2 | 72.7 |
| 2022 | 116.5 | 116.8 | 96.2 | 83.4 | 70.9 |
| 2023 | 116 | 116.7 | 96.4 | 84.1 | 70.9 |
| 2024 | 118 | 116 | 95.3 | 84.2 | 70.9 |
| 2025 | 119.3 | 116.3 | 94.7 | 83.7 | 71.4 |
The price side: cheap, but not cheap enough
Now bring prices in. Louisiana's all-items price level in 2024 was 88.2 on the US = 100 scale — living there costs about 11.8 percent less than the national norm, one of the deepest discounts in the country. Mississippi's is similar at 87.0. California's is 110.7, New York's 107.9, Texas's 97.1.
Run the arithmetic and Louisiana's real position improves meaningfully: BEA's own price-adjusted series puts the state at 95.9 percent of the US average — much closer, but still below. The cheapness recovers roughly a quarter of the percentage-point gap (prices give back 11.8 of the 15.8 points), not all of it, and nowhere near enough to reach parity. Mississippi is the sharper lesson: an 87.0 price level lifts its real income only to 81.9 percent of the US average, still the deepest shortfall in the panel. Low prices are a cushion, not a ladder.
There's an even more pointed way to see it. Take the average Californian's 2024 income — $86,378 — and reprice that consumption bundle at Louisiana's price levels, and it comes to $68,815. That is still $7,148 more than the average Louisianan actually earns. In other words, even after you strip out California's entire cost premium, the typical Californian's income buys a bigger basket than the typical Louisianan's. Cheap living helps; it does not equalize.
Nominal vs price-adjusted per-capita income, 2024

View exact chart values
| state | pcpi_2024 | rpp_all_items | implied_real | bea_real_pcpi | pct_of_us_nominal | pct_of_us_bea_real |
|---|---|---|---|---|---|---|
| United States | 73227 | 100 | 73227 | 59195 | 100 | 100 |
| California | 86378 | 110.7 | 78015 | 63028 | 118 | 106.5 |
| Louisiana | 61667 | 88.2 | 69912 | 56789 | 84.2 | 95.9 |
| Mississippi | 51948 | 87 | 59743 | 48465 | 70.9 | 81.9 |
| New York | 84978 | 107.9 | 78741 | 64153 | 116 | 108.4 |
| Texas | 69762 | 97.1 | 71877 | 58219 | 95.3 | 98.4 |
The price lens: where states land after adjustment, 2024

View exact chart values
| state | pcpi_2024 | rpp_all_items | implied_real | bea_real_pcpi | pct_of_us_nominal | pct_of_us_bea_real |
|---|---|---|---|---|---|---|
| United States | 73227 | 100 | 73227 | 59195 | 100 | 100 |
| California | 86378 | 110.7 | 78015 | 63028 | 118 | 106.5 |
| Louisiana | 61667 | 88.2 | 69912 | 56789 | 84.2 | 95.9 |
| Mississippi | 51948 | 87 | 59743 | 48465 | 70.9 | 81.9 |
| New York | 84978 | 107.9 | 78741 | 64153 | 116 | 108.4 |
| Texas | 69762 | 97.1 | 71877 | 58219 | 95.3 | 98.4 |
California in the funhouse mirror
The same lens that flatters Louisiana humbles California. Nominally, the Golden State's per-capita income runs 18 points above the national average — a proud margin that headlines love to quote. After its 10.7 percent price premium, that advantage shrinks to 6.5 points. New York's 16-point premium holds up better at 8.4 real. Texas, which markets itself on cheapness, is almost exactly what it appears: 95.3 percent nominal, 98.4 percent real.
Where does California's premium live? Overwhelmingly in housing. The state's housing price parity for 2024 is 154.3 on the US all-items = 100 scale, against Louisiana's 63.1 — the single largest price gap in the panel, and the mechanism behind the CalMatters observation that California's poverty is driven by housing, utilities and transport costs rather than low pay. California's housing costs are more than half again the national norm; Louisiana's are about 37 percent under it.
And the trend matters as much as the level. In price-adjusted terms, Louisiana actually out-earned California in 2008 — $47,032 versus $43,788 in constant 2017 dollars — and the two lines ran close for years. Then California's tech-era income surge, worth little in nominal terms once Silicon Valley rents are counted, still opened a $6,239 real gap by 2024 ($63,028 versus $56,789). California got richer in a way that is easy to mock at the grocery store and hard to argue with at the cash register.
Price-adjusted per-capita income, 2008–2024

View exact chart values
| year | united_states | california | louisiana | mississippi | new_york | texas |
|---|---|---|---|---|---|---|
| 2008 | 45816 | 43788 | 47032 | 39167 | 48288 | 46068 |
| 2009 | 44204 | 42377 | 45953 | 39734 | 47614 | 43349 |
| 2010 | 44808 | 43503 | 45679 | 39105 | 48971 | 44078 |
| 2011 | 45957 | 44844 | 45344 | 39395 | 49428 | 46663 |
| 2012 | 46796 | 46162 | 46358 | 39992 | 50848 | 47554 |
| 2013 | 46358 | 45826 | 46119 | 39951 | 50375 | 47301 |
| 2014 | 47661 | 47472 | 46949 | 40125 | 51614 | 48959 |
| 2015 | 49396 | 50054 | 47113 | 40939 | 53180 | 48983 |
| 2016 | 49828 | 51802 | 45897 | 41065 | 54091 | 47686 |
| 2017 | 51006 | 52569 | 47192 | 41790 | 56690 | 49918 |
| 2018 | 52242 | 53523 | 49191 | 42881 | 57594 | 51551 |
| 2019 | 53683 | 55931 | 49920 | 43785 | 58786 | 52343 |
| 2020 | 56514 | 59993 | 52747 | 47533 | 61253 | 53181 |
| 2021 | 59365 | 63373 | 55469 | 50167 | 64085 | 56442 |
| 2022 | 57104 | 59126 | 52781 | 46392 | 62106 | 56452 |
| 2023 | 58088 | 60100 | 55235 | 47517 | 63093 | 57708 |
| 2024 | 59195 | 63028 | 56789 | 48465 | 64153 | 58219 |
The payoff: read the poverty tables with a price dictionary
Why does this matter beyond the stat-nerd satisfaction? Because the two poverty stories in this week's news demand opposite policy toolkits, and the BEA arithmetic shows why. Louisiana's 19.8 percent supplemental poverty rate is anchored in incomes that no local discount can fix — the price lens recovers just part of a 16-point income gap. California's 17.8 percent rate is anchored in costs, above all rents, which means the state's wage strength is genuinely real but gets consumed at the door. Same headline number, different disease.
The second payoff is rhetorical hygiene. 'Poorest state' claims and 'we're actually cheaper' rebuttals are both half-right, and the official data let readers hold both truths at once: Louisiana's incomes are far below average even after the discount (95.9 percent of the US in BEA's price-adjusted series), and California's affluence is far smaller than its paychecks suggest. When the next Census release lands, the useful question isn't just where each state ranks — it's what the dollar in each state is actually worth.
Sources and methods
Data: BEA Annual State GDP and Income (SAINC1 per-capita personal income; annual, nominal dollars; release bea-regional-state-annual-2026-04-09, covering 1929–2025) and BEA Regional Price Parities and Real Income (all-items RPP index, US=100; real per-capita personal income in constant 2017 dollars; housing RPP; release bea-rpp-2026-02-19, covering 2008–2024). Both are local sealed snapshots; RPP/real series end in 2024 while nominal PCPI runs through 2025 — years are kept distinct in every comparison.
PCPI is personal income divided by total resident population — a mean, not a household median; the $60,000 Louisiana household median in this week's Census coverage is a different measure and is cited only as news framing. Supplemental poverty rates (Louisiana 19.8%, California 17.8%) come from the same day's reporting and were not recomputed here.
BEA real per-capita income already embeds the price adjustment; the 'implied real' cross-check (PCPI ÷ RPP×100) is shown for transparency only. Housing RPP measures tenant rents and imputed rents, not purchase prices. RPP covers consumption prices, not taxes.
The comparison panel covers six geographies (US, CA, LA, MS, NY, TX) — no claims are made about all-50-state rankings. All figures derive from saved reproducible calculations over the full extracts; no causal effects are inferred from these descriptive comparisons.
Research completed 2026-09-17, for the September 16, 2026 news edition. The available source data may cover earlier periods; see the observation periods and source vintages above.