Research
Alaska’s fishing economy is real. Most of it never shows up as a wage.
A family skiff, and a very small wage line
Derek Parker Aghnaanga was 15 when a family halibut trip off St. Lawrence Island turned into three days on an overturned hull. His brother died in the lines; his cousin drowned a few feet from the boat; the Coast Guard and a survey vessel pulled the teenager aboard on September 7 with mild hypothermia, according to reporting that named the family. Savoonga is a fishing village. The official economic accounts are not written for villages, but they do record, in their blunt way, what kind of industry sends people onto the Bering Sea in small boats.
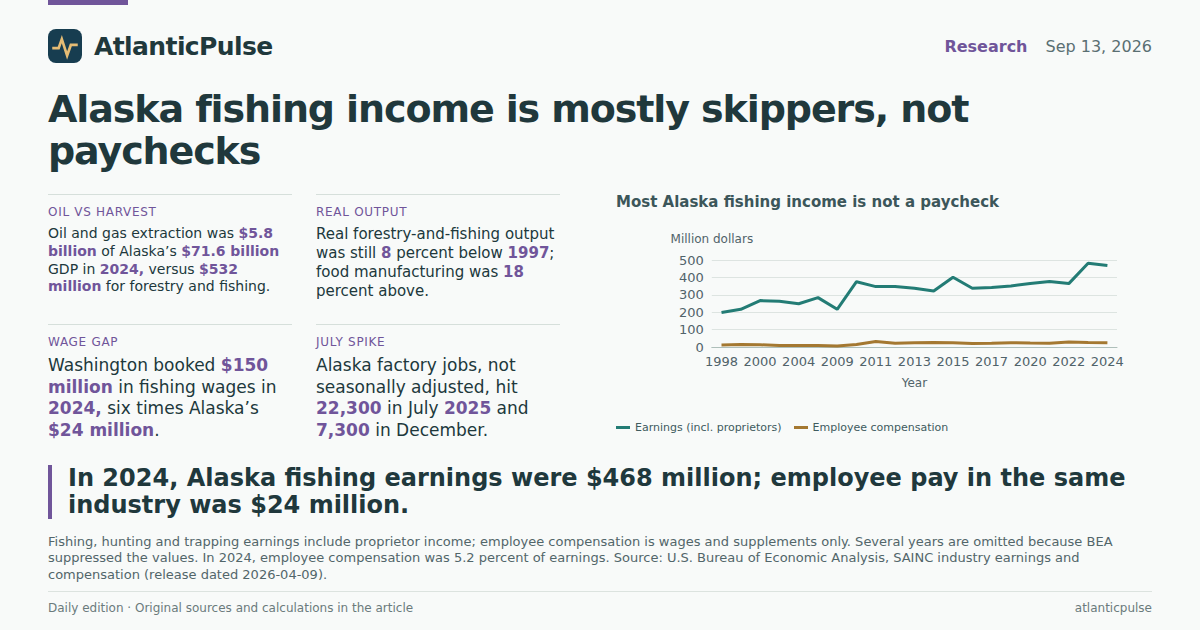
They record something easy to miss if you only look at payrolls. In 2024, Alaska’s fishing, hunting and trapping earnings — a Bureau of Economic Analysis line that includes proprietor income — were $467.7 million. Employee compensation in the same industry was $24.1 million. Put differently, about 95 percent of the income BEA assigns to Alaska fishing did not arrive as a wage or a benefit. That is the Savoonga story in a spreadsheet: the people on the skiff are often the firm.
On the GDP books, fishing is a rounding error next to oil
Alaska’s all-industry GDP was $71.6 billion in 2024, the last year BEA has published a full industry split in this snapshot. Oil and gas extraction alone was $5.8 billion, 8.1 percent of the state. Food and beverage manufacturing — the bucket that includes seafood plants, plus other food — was $1.03 billion, 1.4 percent. Forestry, fishing and related activities, a broader harvest-and-logging group than commercial fishing by itself, was $532 million, 0.74 percent. Oil’s GDP that year was about eleven times the forestry-and-fishing line.
None of that makes the harvest small in the places that live on it. It does mean that a deadly season, a closed fishery, or a processing-plant shutdown can wreck a coast without moving the statewide total much. The same 2024 accounts put combined food-plant and forestry-fishing output at about 2.2 percent of Alaska GDP. That is not a rounding error in Unalaska or Naknek. It is one in Juneau’s aggregate.
Alaska’s 2024 GDP: oil still dwarfs fishing and food plants

View exact chart values
| industry | gdp_million_usd | share_pct |
|---|---|---|
| Oil and gas extraction | 5784.4 | 8.08 |
| Food and beverage manufacturing | 1025.4 | 1.43 |
| Forestry, fishing and related | 532.1 | 0.74 |
The paycheck is in the plant, not on the boat
Follow the compensation instead of the catch and the map flips. Alaska food-manufacturing employee compensation was $711.5 million in 2024, about 30 times the $24.1 million BEA books as fishing wages and supplements. The harvest still matters — earnings of $468 million are not a hobby — but the hired workforce is in the canneries and freezer plants.
Compare that with Washington, where the same fishing industry looks more like a conventional employer. Washington’s 2024 fishing earnings were $547 million, a bit above Alaska’s. Its fishing employee compensation was $149.5 million, six times Alaska’s. Maine, with a lobster fleet that is also heavy on owner-operators, still booked $71.3 million in fishing employee compensation, more than Alaska. On the wage books, Alaska is not America’s fishing capital. It is a state where the skipper and the crew are often the same people, and BEA’s compensation table politely looks away.
Nationally, fishing, hunting and trapping earnings were $2.86 billion in 2024. Alaska’s $468 million was 16 percent of that total; Washington’s $547 million was 19 percent. Those are earnings, not landings, and they still include hunting. They are enough to say the Bering Sea is not a sideshow in the country’s fishing accounts, even if it barely registers in Alaska’s oil-heavy GDP.
Most Alaska fishing income is not a paycheck

View exact chart values
| year | earnings_mil | employee_comp_mil |
|---|---|---|
| 1998 | 198.6 | 11.9 |
| 1999 | 216.9 | 14.1 |
| 2000 | 266.4 | 13.5 |
| 2003 | 263.3 | 7.8 |
| 2004 | 248.7 | 8.4 |
| 2005 | 283.8 | 9.2 |
| 2009 | 216.7 | 6.6 |
| 2010 | 375.4 | 14.9 |
| 2011 | 347.1 | 32.2 |
| 2012 | 347.9 | 21.2 |
| 2013 | 337.5 | 24.1 |
| 2014 | 321.6 | 25.2 |
| 2015 | 401 | 24.4 |
| 2016 | 337.2 | 20.9 |
| 2017 | 341.4 | 21.6 |
| 2019 | 350.3 | 24.5 |
| 2020 | 365.7 | 23.1 |
| 2021 | 377 | 22 |
| 2022 | 364.1 | 28.5 |
| 2023 | 481.4 | 25.6 |
| 2024 | 467.7 | 24.1 |
On the wage books, Washington’s fishing payroll is six times Alaska’s

View exact chart values
| state | year | comp_million_usd |
|---|---|---|
| Alaska | 2024 | 24.1 |
| California | 2024 | 51.8 |
| Oregon | 2024 | 56.1 |
| Louisiana | 2024 | 58.1 |
| Maine | 2024 | 71.3 |
| Washington | 2024 | 149.5 |
The harvest has not been growing. The plants have, with a wobble.
Real output, in chained 2017 dollars, is the cleaner test of whether the industry is shrinking. Alaska’s forestry, fishing and related real GDP in 2024 was 7.8 percent below 1997. It peaked around 2011, sagged through the late 2010s, and in 2021 sat 30 percent under the 1997 baseline before a partial rebound. That line is not a pure fishing series — logging and agricultural support sit in the same bucket — so it cannot tell you what happened to pollock or salmon alone. It can tell you the combined harvest-and-woods sector is not a growth engine.
Food and beverage manufacturing is the other half of the seafood story, and it has been the stronger one. Real output in 2024 was 18 percent above 1997, after a sharp 2023 high (42 percent above 1997) and a pullback the next year. Nominal food-plant GDP more than doubled from $408 million in 1997 to $1.03 billion in 2024. Read together, the accounts say Alaska still turns fish into product, but the volume of harvest-side activity, at least as BEA can see it, has not been climbing for a generation.
Real output: the harvest line slipped; the processing line did not

View exact chart values
| year | forest_fish_index | food_index |
|---|---|---|
| 1997 | 100 | 100 |
| 1998 | 78.8 | 99.5 |
| 1999 | 84.5 | 88 |
| 2000 | 96.6 | 68.3 |
| 2001 | 91.9 | 68.8 |
| 2002 | 83.1 | 61.3 |
| 2003 | 97.2 | 67.3 |
| 2004 | 83.7 | 80.7 |
| 2005 | 93.1 | 88.1 |
| 2006 | 98.3 | 111.8 |
| 2007 | 87 | 121.1 |
| 2008 | 107 | 103.7 |
| 2009 | 100.9 | 117 |
| 2010 | 119.1 | 89.7 |
| 2011 | 136.9 | 80.1 |
| 2012 | 119.2 | 80.4 |
| 2013 | 119.4 | 102.8 |
| 2014 | 107.8 | 101 |
| 2015 | 101.4 | 131.6 |
| 2016 | 84.9 | 114.6 |
| 2017 | 84.8 | 120.9 |
| 2018 | 83.7 | 108.1 |
| 2019 | 87.2 | 101.2 |
| 2020 | 75.2 | 93.6 |
| 2021 | 69.5 | 112.3 |
| 2022 | 90.5 | 130.9 |
| 2023 | 92.1 | 141.6 |
| 2024 | 92.2 | 117.8 |
Then July happens, and then it unhappens
The payroll that does exist is violently seasonal. Not-seasonally-adjusted manufacturing employment — the BLS statewide factory count, which in Alaska is mostly seafood — hit 22,300 in July 2025 and 7,300 in December. July 2019, before the pandemic scramble, was 24,500. The summer peak is smaller than it was, but the shape is the same: the plants hire a town, then send it home.
Seasonally adjusted, the factory line is a much quieter 12,200 jobs in July 2026, against 339,700 total nonfarm jobs. That is about 3.6 percent of the state’s payroll, which is why a Bering Sea accident can be the biggest story in Savoonga and a footnote in Anchorage. Average weekly hours in the not-adjusted factory series still jump in summer (28.6 in January 2025, 32.8 in July). Average hourly earnings do the opposite, sliding from $32.58 in January 2025 to $30.10 in July as the seasonal workforce comes in. The people on the boats are not in that wage survey. The people on the slime line are.
Alaska factory jobs still spike in July — then almost vanish

View exact chart values
| month | jobs_2019 | jobs_2024 | jobs_2025 |
|---|---|---|---|
| 1 | 9.1 | 9.4 | 10 |
| 2 | 12.2 | 11.3 | 11.9 |
| 3 | 11.7 | 11.7 | 11.9 |
| 4 | 11.6 | 11 | 11.4 |
| 5 | 10.2 | 9.5 | 10 |
| 6 | 16.3 | 16.1 | 16.2 |
| 7 | 24.5 | 21.3 | 22.3 |
| 8 | 20.1 | 15.7 | 17.3 |
| 9 | 15.8 | 13.2 | 13.1 |
| 10 | 10.8 | 9.8 | 10.7 |
| 11 | 7.8 | 7.5 | 8.1 |
| 12 | 6.8 | 6.7 | 7.3 |
What the accounts will not tell you
These numbers cannot price a life, and they cannot see a 15-year-old on a hull. They also cannot separate commercial salmon from a trapping line, or a pollock plant from a soda bottler, and several fishing years are simply blank because BEA suppressed them. 2025 industry GDP is not in this snapshot even though the state’s all-industry total has already been published at $75.0 billion. Treat 2024 as the last comparable industry year, not as this week’s observation.
What they can tell a reader of the Savoonga rescue is narrower, and useful. Alaska still has a fishing economy large enough to be 16 percent of U.S. fishing earnings. Most of that money does not show up as a job. The jobs that do show up are in the plants, they still arrive in July, and they still leave. Oil remains an order of magnitude larger on the GDP books. The skiff is not in any of those tables. The reason the skiff went out is.
Sources and methods
Industry GDP, real GDP, earnings and compensation are annual BEA state series from the April 9, 2026 regional release, stored in a snapshot built August 31, 2026. Calendar 2024 is the last year with a full industry split used here. Alaska’s all-industry GDP for 2025 ($75.0 billion) is published in the same file but is not mixed with 2024 industry shares.
Fishing, hunting and trapping (NAICS 114) includes hunting. Forestry, fishing and related activities also includes logging and support services, so it is not a pure commercial-fishing GDP line. Food and beverage manufacturing includes seafood processing and other food and beverage plants; it is not a seafood-only series.
Earnings include proprietor income; employee compensation does not. Several Alaska fishing years are BEA-suppressed (including 2001–2002, 2006–2008, 2018 and 2025 in this extract) and are omitted, not treated as zero. Washington, Maine, Oregon, California and Louisiana comparisons use the same 2024 compensation concept.
Payroll figures are BLS State and Area Employment, snapshot August 24, 2026. Seasonally adjusted manufacturing and total nonfarm run through July 2026. The monthly factory pattern uses not-seasonally-adjusted data for 2019, 2024 and 2025; 2026 is incomplete and is not used for a full-year seasonal swing. Alaska manufacturing is statewide and is not a seafood-processing microdata file.
No causal claim is made about the Savoonga capsize, fishery management, or oil prices. Dollar figures are nominal unless labeled chained 2017 dollars. Provider lag is normal; these are not current-week observations.
Research completed 2026-09-14, for the September 13, 2026 news edition. The available source data may cover earlier periods; see the observation periods and source vintages above.