Research
A $40 billion privacy fine, in a $153 billion state
A penalty that would move a small state’s books
New Mexico asked a Santa Fe judge on Thursday to order Meta Platforms to pay $35 billion to $40 billion after a jury found the company had misled consumers about Facebook privacy in a case that grew out of the Cambridge Analytica scandal. The state’s lawyer said a sum in that range, about 20 percent of the possible statutory penalties from the verdict, would be large enough to matter to Meta’s stock price without blowing through constitutional due-process limits. Meta called the request an astronomical penalty and asked the court to cap it at $3.45 billion. The judge said parties who go to trial roll the dice, and he expected to rule later this month.
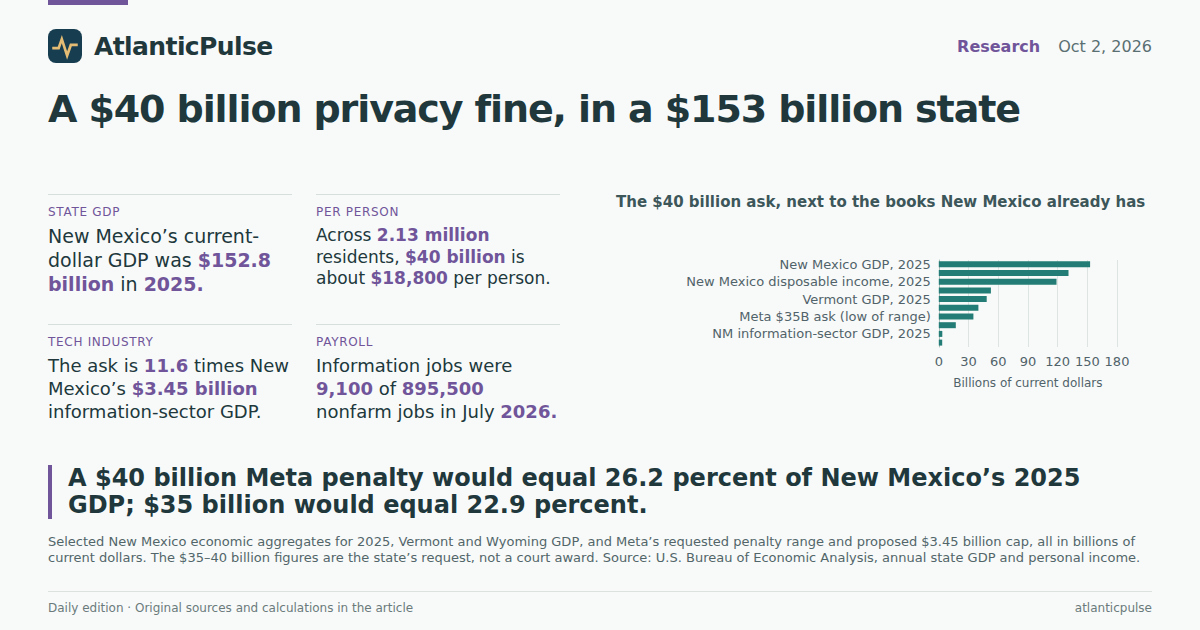
Those numbers are easy to treat as Silicon Valley theater. They are not, if you live in New Mexico. The Bureau of Economic Analysis puts the state’s entire current-dollar GDP at $152.8 billion in 2025. A $40 billion payment would equal 26.2 percent of that output; $35 billion would equal 22.9 percent. Spread across 2.13 million residents, $40 billion is about $18,800 a person — not a tax anyone would actually write, but a useful way to see the scale. Meta’s proposed $3.45 billion cap is 2.3 percent of the same GDP, which is still a large civil penalty and a very different conversation.
None of this says the judge should award $40 billion, or that Meta could or would pay it from New Mexico’s economy. A penalty is a transfer from a company whose business is national and global. The point is simpler: when a state the size of New Mexico talks about tens of billions, it is talking about a share of itself, not a rounding error on someone else’s spreadsheet.
New Mexico’s economy grew. A $40 billion penalty would still be a quarter of it.

View exact chart values
| year | nm_gdp_billions | ask40_billions | ask_as_pct_of_gdp |
|---|---|---|---|
| 2005 | 74.13 | 40 | 54 |
| 2006 | 78.01 | 40 | 51.3 |
| 2007 | 81.1 | 40 | 49.3 |
| 2008 | 84.34 | 40 | 47.4 |
| 2009 | 82.64 | 40 | 48.4 |
| 2010 | 84.86 | 40 | 47.1 |
| 2011 | 87.06 | 40 | 45.9 |
| 2012 | 87.68 | 40 | 45.6 |
| 2013 | 88.77 | 40 | 45.1 |
| 2014 | 92.52 | 40 | 43.2 |
| 2015 | 90.78 | 40 | 44.1 |
| 2016 | 90.48 | 40 | 44.2 |
| 2017 | 93.21 | 40 | 42.9 |
| 2018 | 98.84 | 40 | 40.5 |
| 2019 | 103.82 | 40 | 38.5 |
| 2020 | 101.04 | 40 | 39.6 |
| 2021 | 113.78 | 40 | 35.2 |
| 2022 | 129.47 | 40 | 30.9 |
| 2023 | 138.53 | 40 | 28.9 |
| 2024 | 147.08 | 40 | 27.2 |
| 2025 | 152.78 | 40 | 26.2 |
Larger than Vermont. Larger than the state’s own government.
Put the ask next to the other official totals for 2025 and the strangeness sharpens. New Mexico personal income was $131.0 billion; disposable personal income, after personal current taxes, was $118.9 billion. Forty billion dollars is 30.5 percent of personal income and 33.7 percent of disposable income. State and local government GDP — the value added by the public sector New Mexico actually runs — was $17.2 billion. The $40 billion request is 2.3 times that entire government output.
The information sector that Meta inhabits on the industrial map is smaller still. BEA’s information GDP for New Mexico was $3.45 billion in 2025, almost the same number as Meta’s proposed cap. The $40 billion ask is 11.6 times the state’s whole information industry. That industry is not “Meta in New Mexico”; it is publishing, telecom, data processing and the rest of NAICS 51. It is still the right drawer in the filing cabinet, and it is a thin drawer.
Other small states make the same point without any metaphor. Vermont’s 2025 GDP was $48.4 billion. Wyoming’s was $52.6 billion. Rhode Island’s was $84.0 billion, North Dakota’s $81.9 billion. Forty billion dollars is not “bigger than New Mexico.” It is, however, in the same neighborhood as entire peer states, and it is not a neighborhood Meta occupies by accident. California, where much of the company actually sits, produced $4.25 trillion of GDP in 2025; $40 billion is 0.94 percent of that. Against U.S. GDP of $30.8 trillion it is 0.13 percent. Geography is doing a lot of the work in this argument.
The $40 billion ask, next to the books New Mexico already has

View exact chart values
| item | billions |
|---|---|
| New Mexico GDP, 2025 | 152.8 |
| New Mexico personal income, 2025 | 131 |
| New Mexico disposable income, 2025 | 118.9 |
| Wyoming GDP, 2025 | 52.6 |
| Vermont GDP, 2025 | 48.4 |
| Meta $40B ask (top of range) | 40 |
| Meta $35B ask (low of range) | 35 |
| NM state and local government GDP, 2025 | 17.2 |
| NM information-sector GDP, 2025 | 3.5 |
| Meta $3.45B proposed cap | 3.45 |
$40 billion is smaller than New Mexico — and almost as large as Vermont

View exact chart values
| state | gdp_billions |
|---|---|
| New Mexico | 152.8 |
| Rhode Island | 84 |
| North Dakota | 81.9 |
| Wyoming | 52.6 |
| Vermont | 48.4 |
| Meta $40B ask | 40 |
The payroll is not a tech payroll
If the fine is supposed to speak to Meta in the language of money, New Mexico’s labor market speaks a different dialect. Seasonally adjusted nonfarm employment was 895,500 in July 2026, according to the Bureau of Labor Statistics. Information employment was 9,100 — 1.0 percent of the payroll. The annual averages tell the same story: information jobs have hovered around 9,000 to 11,000 since 2019, while the broader payroll climbed back from the 2020 drop and has been a little above 890,000.
That is not a finding that New Mexico lacks an economy. It is a finding that the economy it has is not the one a $40 billion social-media privacy case is usually litigated against. Government, health care, energy, hospitality and the rest of the goods-and-services mix do the hiring. A privacy verdict aimed at a platform used by millions of New Mexicans is being sized as if it were an industry event in a place where the industry is a rounding error on the job count.
Incomes sit in the same gap. Per capita personal income in New Mexico was $61,645 in 2025, 80.7 percent of the U.S. figure of $76,393. That ratio has been stuck near four-fifths for two decades; it was 80.6 percent in 2005. Per capita consumer spending, which BEA publishes with a longer lag, was $48,119 in New Mexico in 2024 against $58,499 nationally. A penalty that is a quarter of state GDP would, if it were ever collected and spent inside the state, be enormous relative to those household books. There is no evidence in these tables that it would be collected that way, and no warrant for pretending a court order is a stimulus check.
Information is a sliver of New Mexico’s payroll

View exact chart values
| year | nonfarm_thousands | information_thousands |
|---|---|---|
| 2019 | 855.2 | 11.2 |
| 2020 | 799.6 | 9.1 |
| 2021 | 815 | 10.4 |
| 2022 | 850.5 | 10.7 |
| 2023 | 875.8 | 10.3 |
| 2024 | 889.1 | 10.8 |
| 2025 | 892.4 | 9.4 |
| 2026 | 894.3 | 9 |
New Mexico incomes remain about four-fifths of the U.S. average

View exact chart values
| year | nm_pcpi | us_pcpi | nm_as_pct_of_us |
|---|---|---|---|
| 2005 | 28744 | 35669 | 80.6 |
| 2006 | 30433 | 37843 | 80.4 |
| 2007 | 31780 | 39588 | 80.3 |
| 2008 | 33552 | 40854 | 82.1 |
| 2009 | 32901 | 39307 | 83.7 |
| 2010 | 33658 | 40557 | 83 |
| 2011 | 35069 | 42650 | 82.2 |
| 2012 | 35694 | 44238 | 80.7 |
| 2013 | 34857 | 44402 | 78.5 |
| 2014 | 36880 | 46289 | 79.7 |
| 2015 | 37752 | 48062 | 78.5 |
| 2016 | 38474 | 48974 | 78.6 |
| 2017 | 39196 | 51006 | 76.8 |
| 2018 | 40976 | 53311 | 76.9 |
| 2019 | 43223 | 55567 | 77.8 |
| 2020 | 46560 | 59151 | 78.7 |
| 2021 | 50855 | 64692 | 78.6 |
| 2022 | 53141 | 66303 | 80.1 |
| 2023 | 55505 | 70013 | 79.3 |
| 2024 | 58345 | 73227 | 79.7 |
| 2025 | 61645 | 76393 | 80.7 |
What the latest quarter does not change
The newest GDP print is a quarterly one. New Mexico’s seasonally adjusted annual rate of current-dollar GDP was $160.3 billion in the first quarter of 2026, up from $154.7 billion in the fourth quarter of 2025. Even on that faster run-rate, $40 billion is 25 percent of output. Annual 2025 GDP of $152.8 billion remains the cleaner comparison for a one-time civil penalty, because a quarterly annualized rate is not a pile of cash sitting in Santa Fe.
The vintage matters too. The annual GDP and income figures come from BEA’s April 9, 2026 regional release, pinned in a snapshot built in August 2026. The quarterly series run through 2026 Q1 in a June 2025–dated quarterly release family. None of these are October 2 observations. They are the official books available for a state that is asking a court, this week, to move a sum of money that would have been a historic share of those books in every year of the series.
The jury found 26 of 29 company statements misleading and more than 43 million consumer-protection violations. State law allows up to $5,000 per violation; New Mexico’s own lawyer said applying that full statutory math would create too large a penalty under the Constitution, which is why the state walked the figure down to $35–40 billion — about a fifth of the theoretical maximum. Meta says the evidence did not show that consumers were actually misled, and that it does not sell user data. Those are arguments for a judge. The economic question is narrower, and the official record answers it without much drama: in New Mexico, $40 billion is not a message. It is a sizable piece of the state.
Sources and methods
This package sizes New Mexico’s requested $35–40 billion Meta penalty against official economic aggregates. It does not estimate what a court will award, whether Meta could pay, or any causal effect of a penalty on New Mexico output, jobs or prices.
State GDP, personal income, disposable personal income, population, per capita personal income, information GDP (NAICS 51) and state-and-local government GDP are from the U.S. Bureau of Economic Analysis annual regional accounts (SAGDP2, SAGDP9, SAINC1, SAINC51) in the April 9, 2026 release, pinned in an August 31, 2026 snapshot. Units are millions of current dollars except real GDP (millions of chained 2017 dollars) and per capita income (dollars). Annual 2025 values are the latest full calendar year in that vintage; they are not October 2026 observations.
Quarterly current-dollar GDP is the seasonally adjusted annual rate from BEA SQGDP2 through 2026 Q1 (June 25, 2026 quarterly release family). A quarterly annualized rate is not mixed with annual GDP except as a separate, labelled comparison.
Per capita personal consumption expenditures are from BEA SAPCE2 through 2024 (September 26, 2025 SAPCE release). Employment is BLS State and Area Employment, seasonally adjusted, statewide New Mexico, through July 2026 (August 24, 2026 snapshot). Information employment is the information supersector, not Meta-specific jobs. Annual job figures in the jobs chart are averages of monthly observations; 2026 is January–July.
Penalty amounts ($35 billion, $40 billion, $3.45 billion cap) are taken from contemporaneous reporting of the state’s request and Meta’s proposed cap. They are not BEA series. Per-person scaling divides $40 billion by BEA population; that is a size illustration, not a household average, a tax, or a transfer New Mexicans would receive. Missing observations were not treated as zero. California, Vermont, Wyoming, North Dakota and Rhode Island GDP figures are the same SAGDP2 series for 2025, used only as scale comparisons.
Research completed 2026-10-03, for the October 2, 2026 news edition. The available source data may cover earlier periods; see the observation periods and source vintages above.