Research
A 100,000-worker strike, in a 570,000-job state payroll
The 100,000 and the 570,000
California’s largest public-sector union has scheduled a walkout for 21 October. SEIU Local 1000 says it represents about 100,000 state employees — office workers, cooks, custodians, nurses, Caltrans crews, DMV staff — and that members voted to strike after talks stalled on a 20 percent raise over three years, cheaper health coverage, and Gov. Gavin Newsom’s four-day in-office order. The union’s president put it as a bid “to live in the communities that we work in.” That is a labour story. It is also a size story.
On the official payroll, California state government is much larger than one bargaining unit. Bureau of Labor Statistics State and Area Employment figures, seasonally adjusted, put state-government jobs at 570,200 in August 2026. That is 5.3 percent above February 2020, 7.3 percent above August 2019, and 11.5 percent above August 2015. It is also off a recent peak: 585,200 in August 2024. Against California’s 18.18 million total nonfarm jobs that month, state government is 3.1 percent of the payroll. Local government, mostly cities, counties and K-12, is 1.87 million — more than three times the state workforce. A 100,000-person strike would be roughly one in six of the seasonally adjusted state jobs, and a rounding error on the state’s entire job market. It would not be a rounding error at the DMV.
California’s state-government payroll, each August

View exact chart values
| year | state_gov_sa_thousands |
|---|---|
| 2015 | 511.3 |
| 2016 | 520 |
| 2017 | 528 |
| 2018 | 532.1 |
| 2019 | 531.3 |
| 2020 | 526.8 |
| 2021 | 545.4 |
| 2022 | 537.7 |
| 2023 | 556.7 |
| 2024 | 585.2 |
| 2025 | 575.2 |
| 2026 | 570.2 |
Universities still move the count
Those seasonally adjusted totals mix two very different employers. Public colleges and universities sit inside “state government.” Civil-service agencies sit there too. In August, when campuses are quieter, the not-seasonally-adjusted books make the split visible. California’s unadjusted state-government payroll in August 2026 was 550,000. Subtracting state-government educational services (233,500) leaves 316,500 jobs outside education. Education was still 42.5 percent of the August unadjusted total. The union’s 100,000 members, if they are mostly non-education civil servants, would be about 32 percent of that smaller slice — a serious share of the agencies that actually keep counters open, not a majority of the state’s public payroll.
The education line is also why a raw monthly print can look like a collapse every summer. Unadjusted state-government employment dropped from 513,400 in March 2015 to 487,800 in August 2015; the seasonally adjusted series barely moved. The same pattern held in 2026. Anyone scoring a strike’s “size” off a single unadjusted month is measuring the academic calendar. The fairer civil-service yardstick is the excluding-education remainder, which has grown from 265,300 in August 2015 to 316,500 in August 2026. That is a larger workforce than the union, and a smaller one than the 570,200 headline.
Universities still move California’s state payroll

View exact chart values
| year | excluding_education_thousands | education_thousands |
|---|---|---|
| 2015 | 265.3 | 222.5 |
| 2016 | 266.9 | 228 |
| 2017 | 269 | 233.5 |
| 2018 | 272.1 | 237.2 |
| 2019 | 278 | 229.9 |
| 2020 | 281.8 | 222.3 |
| 2021 | 294 | 228.2 |
| 2022 | 296.2 | 217.6 |
| 2023 | 305 | 225.8 |
| 2024 | 318.3 | 238.9 |
| 2025 | 318 | 229.4 |
| 2026 | 316.5 | 233.5 |
August’s state payroll, split

View exact chart values
| category | thousands |
|---|---|
| State government excluding education | 316.5 |
| State government educational services | 233.5 |
Big, but not uniquely Californian
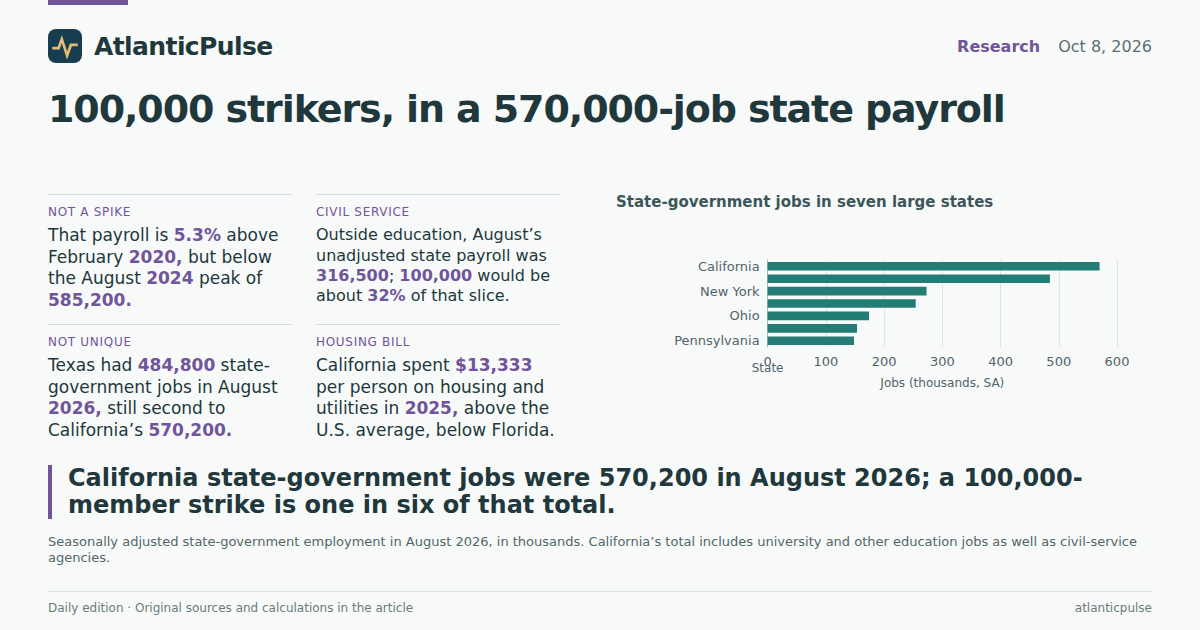
Among large states, California still has the biggest state-government payroll. In August 2026, Texas had 484,800 seasonally adjusted state-government jobs, New York 272,900, Florida 254,400, Ohio 174,100, Illinois 153,500 and Pennsylvania 148,300. California’s lead is real. It is also the arithmetic of being the most populous state with a large public university system, not proof that Sacramento is uniquely swollen. Texas, which runs a very different politics of government, is not far behind.
The dollar books tell a similar story at a coarser grain. BEA compensation of employees in California state government — wages plus employer-paid benefits — was $88.7 billion in 2025, 15.2 percent of the U.S. state-government compensation total of $584.5 billion. That compensation line is up 68.7 percent from 2015 in current dollars, which is not the same as a 69 percent raise; it mixes headcount, pay, and benefit costs, and it includes universities. Wage-and-salary payments alone were $64.5 billion in 2025. None of those aggregates is an SEIU pay scale. They do show why a 20 percent across-the-board demand is not a rounding error in the state budget, even if the union is not the whole payroll.
State-government jobs in seven large states

View exact chart values
| state | latest_start | state_gov_sa_thousands |
|---|---|---|
| California | 2026-08-01 | 570.2 |
| Texas | 2026-08-01 | 484.8 |
| New York | 2026-08-01 | 272.9 |
| Florida | 2026-08-01 | 254.4 |
| Ohio | 2026-08-01 | 174.1 |
| Illinois | 2026-08-01 | 153.5 |
| Pennsylvania | 2026-08-01 | 148.3 |
The housing argument, without the unique-victim ending
The union’s living-in-the-community line is easier to test than a raise percentage. BEA state PCE puts California’s per capita spending on housing and utilities at $13,333 in 2025, $2,174 above the U.S. average of $11,159. That gap has been wide for a decade: $7,836 versus $6,824 in 2015. It is not, however, the nation’s peak among the states in this comparison. Florida spent $14,278 per person on housing and utilities in 2025; New York $12,214; Texas $10,353. California is expensive. It is not uniquely so, and the Florida figure is a reminder that “no state income tax” and “cheap housing” have not been the same sentence for some time.
Price levels, as opposed to spending, still mark California as an outlier on shelter. Regional price parities for 2024 put California’s all-items index at 110.7 (United States = 100) and its housing-services index at 154.3. Texas housing was 96.5. Those 2024 parities are the latest in this snapshot; they are not 2026 rents. They do help explain why a four-day office mandate and a raise fight landed in the same sentence. They do not, by themselves, say whether 20 percent over three years is “fair.” The official books can size the payroll. They cannot bargain it.
Housing and utilities, per person

View exact chart values
| year | california | united_states |
|---|---|---|
| 2015 | 7836 | 6824 |
| 2016 | 8123 | 6996 |
| 2017 | 8490 | 7196 |
| 2018 | 8878 | 7486 |
| 2019 | 9306 | 7758 |
| 2020 | 9836 | 8106 |
| 2021 | 10482 | 8560 |
| 2022 | 11308 | 9325 |
| 2023 | 12195 | 10017 |
| 2024 | 12760 | 10585 |
| 2025 | 13333 | 11159 |
Sources and methods
This is not a same-day reading of 8 October 2026. BLS State and Area Employment observations run through August 2026 in a snapshot created 7 October 2026 (release identifier bls-sm-snapshot-2026-08-24). BEA personal consumption expenditures by state run through calendar 2025 in a 7 October 2026 snapshot (bea-sapce-2026-09-30). BEA annual compensation and wages run through 2025 in a snapshot created 8 October 2026 (bea-regional-state-annual-2026-09-30). Regional price parities and real per capita personal income run through 2024 (bea-rpp-2026-02-19).
Seasonally adjusted state-government employment is the headline payroll. Not-seasonally-adjusted educational services were subtracted from not-seasonally-adjusted total state government to approximate non-education state jobs; the residual is not identical to SEIU Local 1000’s bargaining unit. The union’s “about 100,000” figure is from 8 October 2026 reporting, not from BLS.
Compensation includes employer-paid benefits; wages and salaries do not. Neither series is an hourly rate for civil-service titles. Per capita housing-and-utilities PCE is current-dollar spending, including imputed rent on owner-occupied housing and utilities, not a median rent. RPPs are price levels relative to the U.S. average of 100. Missing observations were skipped, not treated as zero. No causal claim is made about the strike, the raise demand, or the return-to-office order.
Research completed 2026-10-09, for the October 8, 2026 news edition. The available source data may cover earlier periods; see the observation periods and source vintages above.
- U.S. Bureau of Labor Statistics, State and Area Employment: Source 1, Source 2
- U.S. Bureau of Economic Analysis, annual state GDP and income: Source 1, Source 2
- U.S. Bureau of Economic Analysis, personal consumption expenditures by state: Source 1, Source 2
- U.S. Bureau of Economic Analysis, regional price parities and real income: Source 1, Source 2