Research
A 10-million-ton mill, measured against a steel payroll that already shrank
The Oval Office mill, and the payroll already on the books
President Donald Trump is using an Oval Office event to announce what the White House calls a $15 billion Mesabi Metallics steel plant in Iowa, billed as the first U.S. mega-mill since the 1960s, with first steel in 2030, 10 million tons a year when fully built, 1,750 Iowa jobs and a $2.5 billion Minnesota iron-ore mine (ABC Audio). Those are announcement numbers, not production statistics. The official employment books, which run through mid-2026, describe a much smaller industry than the speech. Iron and steel mills and ferroalloy plants employed 84,800 people in the United States in June 2026, on a seasonally adjusted basis. That is the workforce the new mill would join, not a blank slate.
The mill payroll has been shrinking for a generation. The annual average was about 186,700 jobs in 1990 and about 135,000 in 2000. By 2010, after the financial crisis, it was about 86,500. It has since bounced in a narrow band: about 87,200 in 2019, 85,100 in 2024 and 84,800 in June 2026. That is a 55 percent decline from 1990. The 1,750 jobs attached to the Iowa announcement equal about 2 percent of the mill jobs that remain. If every promised job showed up tomorrow, and none of today’s mill jobs disappeared, America’s iron-and-steel mill payroll would still be closer to 1990’s remnant than to 1990 itself. The Bureau of Labor Statistics Current Employment Statistics do not measure tons of steel. They measure paychecks.
U.S. iron and steel mill jobs have been cut nearly in half since 1990

View exact chart values
| year | mill_jobs_thousands | mill_jobs | steel_products_thousands | primary_metal_thousands | metal_ore_thousands |
|---|---|---|---|---|---|
| 1990 | 186.7 | 186725 | 70.5 | 688.4 | 53.4 |
| 1991 | 177.8 | 177833 | 66.8 | 656 | 52.1 |
| 1992 | 167.6 | 167575 | 65.6 | 630.5 | 49.9 |
| 1993 | 157.6 | 157583 | 66.2 | 618.7 | 46.9 |
| 1994 | 154.8 | 154792 | 67.9 | 630.5 | 45.9 |
| 1995 | 154.2 | 154242 | 70 | 641.6 | 48.2 |
| 1996 | 152.6 | 152600 | 70.1 | 639.1 | 50.5 |
| 1997 | 147.6 | 147642 | 70.6 | 638.6 | 50.1 |
| 1998 | 143.9 | 143908 | 72.5 | 641.6 | 46.2 |
| 1999 | 137.7 | 137742 | 73.3 | 625.2 | 41.5 |
| 2000 | 135 | 134992 | 73.2 | 622 | 37.9 |
| 2001 | 121.5 | 121550 | 67.9 | 570.7 | 33.1 |
| 2002 | 107.2 | 107242 | 63.1 | 509.1 | 28.7 |
| 2003 | 102.3 | 102267 | 60.7 | 477.2 | 26.8 |
| 2004 | 95.4 | 95350 | 61.1 | 466.8 | 27.4 |
| 2005 | 95.8 | 95783 | 61.1 | 466.1 | 29 |
| 2006 | 96.6 | 96592 | 60.4 | 463.7 | 32.1 |
| 2007 | 100.2 | 100158 | 61.1 | 455.5 | 36.2 |
| 2008 | 99.1 | 99083 | 61.1 | 441.8 | 39.9 |
| 2009 | 85.4 | 85433 | 49.8 | 362 | 34.7 |
| 2010 | 86.5 | 86450 | 52.2 | 362.2 | 36.6 |
| 2011 | 92.2 | 92233 | 56.5 | 388.4 | 42 |
| 2012 | 92.6 | 92650 | 59.7 | 402.1 | 44.7 |
| 2013 | 90.8 | 90833 | 58.6 | 395.3 | 44.4 |
| 2014 | 90.9 | 90933 | 60.3 | 398.6 | 44 |
| 2015 | 88.4 | 88400 | 59.4 | 394 | 41.8 |
| 2016 | 82.6 | 82633 | 55.3 | 374.7 | 39 |
| 2017 | 81.9 | 81917 | 55.6 | 371.4 | 39.5 |
| 2018 | 83.6 | 83600 | 57.2 | 380.3 | 41.8 |
| 2019 | 87.2 | 87183 | 58.6 | 387.1 | 42.2 |
| 2020 | 81.7 | 81700 | 54.3 | 353.3 | 41.4 |
| 2021 | 79.5 | 79525 | 53.6 | 350.4 | 41.2 |
| 2022 | 82.4 | 82383 | 55.6 | 364.5 | 42.8 |
| 2023 | 84.9 | 84917 | 59.6 | 374.4 | 44.1 |
| 2024 | 85.1 | 85100 | 58.9 | 369.6 | 45.1 |
| 2025 | 84.8 | 84767 | 57.6 | 363.9 | 45.1 |
| 2026 | 84.7 | 84683 | 57 | 365.4 | 46 |
Mills are a sliver of manufacturing, and of primary metals
Zoom out from mills and the picture is less collapsed, and still not a boom. All U.S. manufacturing employed 12.6 million people in July 2026, seasonally adjusted. Iron and steel mills were 0.67 percent of that total. The broader primary-metal industry — mills plus steel products made from purchased steel, plus aluminum, other nonferrous metals and foundries — employed 367,000. That is still only about 3 percent of factory jobs. Index the three series to 1990 and mills fall to 45, primary metals to 53, and manufacturing as a whole to 71. The mill floor emptied faster than the factory floor.
Inside primary metals, mills are not even the majority. Averaging the 2026 months on the books, iron and steel mills accounted for about 23 percent of primary-metal jobs, steel products made from purchased steel another 16 percent, and the remaining 61 percent other primary metals. A mill that makes steel from iron ore sits in the first slice. It does not automatically refill the other two. Average hourly earnings in primary metals were $37.38 in July 2026, up from $21.48 in March 2006 in nominal dollars, which is a raise and not a purchasing-power statement. Metal ore mining, the industry that would include a Minnesota iron-ore pit, employed 46,200 people nationwide in July 2026, down from about 53,400 in 1990. The White House’s 350 mine jobs would be a rounding error on that national payroll, which is not an argument against them. It is a scale check.
Mill payrolls fell further than U.S. manufacturing as a whole

View exact chart values
| year | iron_steel_mills | primary_metal | manufacturing |
|---|---|---|---|
| 1990 | 100 | 100 | 100 |
| 1991 | 95.2 | 95.3 | 96.5 |
| 1992 | 89.7 | 91.6 | 94.9 |
| 1993 | 84.4 | 89.9 | 94.8 |
| 1994 | 82.9 | 91.6 | 96.2 |
| 1995 | 82.6 | 93.2 | 97.5 |
| 1996 | 81.7 | 92.8 | 97.4 |
| 1997 | 79.1 | 92.8 | 98.4 |
| 1998 | 77.1 | 93.2 | 99.2 |
| 1999 | 73.8 | 90.8 | 97.9 |
| 2000 | 72.3 | 90.4 | 97.6 |
| 2001 | 65.1 | 82.9 | 92.9 |
| 2002 | 57.4 | 74 | 86.2 |
| 2003 | 54.8 | 69.3 | 82 |
| 2004 | 51.1 | 67.8 | 80.9 |
| 2005 | 51.3 | 67.7 | 80.4 |
| 2006 | 51.7 | 67.4 | 80 |
| 2007 | 53.6 | 66.2 | 78.4 |
| 2008 | 53.1 | 64.2 | 75.7 |
| 2009 | 45.8 | 52.6 | 66.9 |
| 2010 | 46.3 | 52.6 | 65.1 |
| 2011 | 49.4 | 56.4 | 66.2 |
| 2012 | 49.6 | 58.4 | 67.3 |
| 2013 | 48.6 | 57.4 | 67.8 |
| 2014 | 48.7 | 57.9 | 68.7 |
| 2015 | 47.3 | 57.2 | 69.6 |
| 2016 | 44.3 | 54.4 | 69.6 |
| 2017 | 43.9 | 54 | 70.1 |
| 2018 | 44.8 | 55.2 | 71.5 |
| 2019 | 46.7 | 56.2 | 72.2 |
| 2020 | 43.8 | 51.3 | 68.5 |
| 2021 | 42.6 | 50.9 | 69.6 |
| 2022 | 44.1 | 53 | 72.2 |
| 2023 | 45.5 | 54.4 | 72.8 |
| 2024 | 45.6 | 53.7 | 72.3 |
| 2025 | 45.4 | 52.9 | 71.4 |
| 2026 | 45.4 | 53.1 | 71.2 |
Steel mills are about a quarter of America’s primary-metal payroll

View exact chart values
| category | jobs_thousands | jobs | share_pct |
|---|---|---|---|
| Iron and steel mills and ferroalloys | 84.7 | 84683 | 23.2 |
| Steel products from purchased steel | 57 | 57033 | 15.6 |
| Other primary metal (aluminum, nonferrous, foundries) | 223.7 | 223655 | 61.2 |
Iowa already has factories. It does not have a steel belt.
Iowa is a manufacturing state in the ordinary sense. Statewide factory payrolls were 212,900 in July 2026, seasonally adjusted, or about 13 percent of Iowa’s 1.58 million nonfarm jobs. That factory book has been remarkably stable: the 1990 average was about 219,100, a decline of only 3 percent over 36 years while the national mill payroll was cut in half. The 1,750 promised mill jobs equal about 0.8 percent of Iowa’s current manufacturing employment. They would matter in a county. They would not rewrite the state’s industrial mix.
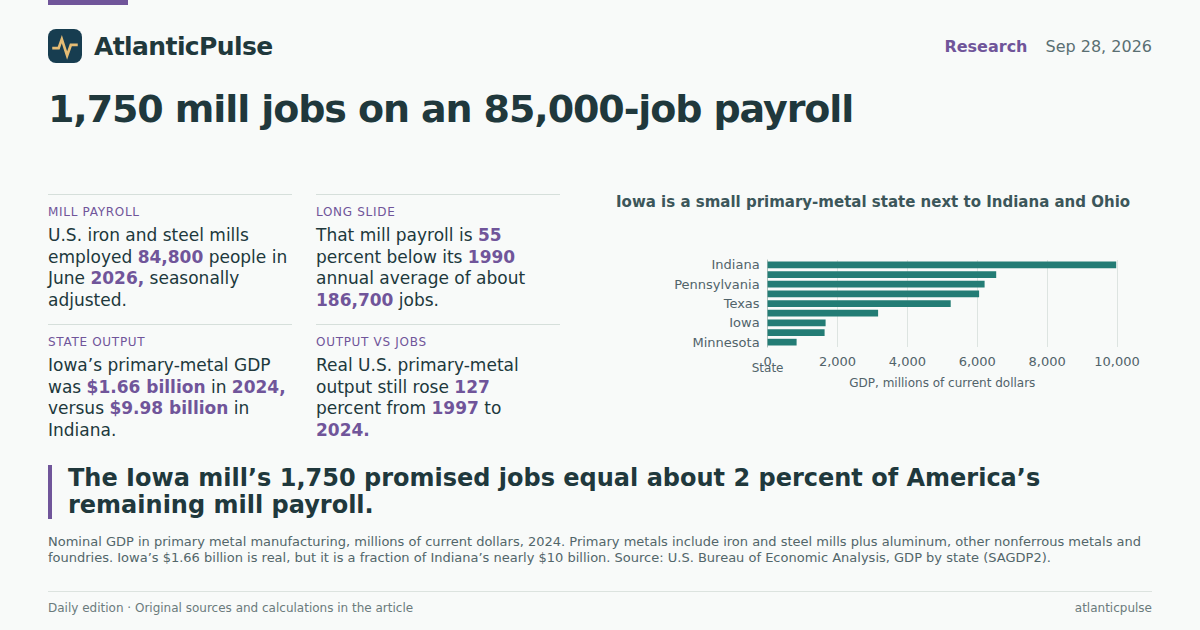
The output books say the same thing more sharply. In 2024, the latest year of industry GDP, Iowa’s primary-metal sector produced $1.66 billion of value added. Indiana produced $9.98 billion, Ohio $6.54 billion, Pennsylvania $6.21 billion and Alabama $6.05 billion. Iowa’s primary-metal GDP was 2.2 percent of the U.S. total of $76.5 billion, and 0.62 percent of Iowa’s $266 billion all-industry economy that year. Durable-goods manufacturing as a whole was $21.9 billion in Iowa; primary metals were 8 percent of that durable slice. A $15 billion construction budget is large next to a $1.66 billion annual industry. It is not large next to the state. The Bureau of Economic Analysis does not score promised tons. It scores what plants already ship.
Iowa is a small primary-metal state next to Indiana and Ohio

View exact chart values
| state | year | gdp_millions | gdp_billions |
|---|---|---|---|
| Indiana | 2024 | 9978.6 | 9.979 |
| Ohio | 2024 | 6542.2 | 6.542 |
| Pennsylvania | 2024 | 6210.4 | 6.21 |
| Alabama | 2024 | 6052.9 | 6.053 |
| Texas | 2024 | 5240.6 | 5.241 |
| Illinois | 2024 | 3163.7 | 3.164 |
| Iowa | 2024 | 1659.9 | 1.66 |
| Wisconsin | 2024 | 1632.1 | 1.632 |
| Minnesota | 2024 | 830.2 | 0.83 |
Primary metals have never been a large slice of Iowa’s economy

View exact chart values
| year | primary_metal_millions | state_gdp_millions | share_pct | durable_mfg_millions |
|---|---|---|---|---|
| 1997 | 650.7 | 82808.8 | 0.79 | 10397.1 |
| 1998 | 837.6 | 84629.7 | 0.99 | 10929.2 |
| 1999 | 1129.9 | 87774.3 | 1.29 | 11087.6 |
| 2000 | 513.6 | 93125.6 | 0.55 | 11027.5 |
| 2001 | 438.9 | 94922.6 | 0.46 | 10779.8 |
| 2002 | 632.5 | 98669.4 | 0.64 | 11189.6 |
| 2003 | 513.5 | 105329.7 | 0.49 | 11161.8 |
| 2004 | 708 | 117149.8 | 0.6 | 13429.6 |
| 2005 | 990.4 | 122866.1 | 0.81 | 14388.3 |
| 2006 | 945.7 | 127670.8 | 0.74 | 14999 |
| 2007 | 1045.8 | 137590.2 | 0.76 | 15032.3 |
| 2008 | 1054.7 | 137749.2 | 0.77 | 14278.5 |
| 2009 | 663.8 | 137094.3 | 0.48 | 12220 |
| 2010 | 757.6 | 142497.7 | 0.53 | 13878 |
| 2011 | 1031 | 149026.1 | 0.69 | 13771.5 |
| 2012 | 857 | 158553.1 | 0.54 | 17731.8 |
| 2013 | 1014.7 | 162415 | 0.62 | 15321.9 |
| 2014 | 952.1 | 173734.2 | 0.55 | 18430.5 |
| 2015 | 1086.6 | 181471.7 | 0.6 | 18109.5 |
| 2016 | 931.6 | 183834.8 | 0.51 | 15133.9 |
| 2017 | 1151.9 | 187125 | 0.62 | 16889 |
| 2018 | 1331.4 | 193155.1 | 0.69 | 17763.5 |
| 2019 | 1421.9 | 196262.5 | 0.72 | 18934.2 |
| 2020 | 1258.9 | 199449.6 | 0.63 | 18728 |
| 2021 | 1498.2 | 225055.3 | 0.67 | 18439.8 |
| 2022 | 1778.9 | 244156.8 | 0.73 | 20376.2 |
| 2023 | 1842 | 253166.5 | 0.73 | 21785.3 |
| 2024 | 1659.9 | 265794.5 | 0.62 | 21898.7 |
The jobs left. The real output did not.
If mill jobs halved, someone might expect the metal itself to have vanished. The real GDP series says otherwise. U.S. primary-metal output, measured in chained 2017 dollars, rose from $40.8 billion in 1997 to $92.6 billion in 2024, a 127 percent increase. That is the whole primary-metal subsector, not mills alone, and it is not a tons-of-steel series. It still undercuts the idea that America stopped making metal. It made metal with fewer people. Automation, mini-mills, import competition and product mix all sit behind that gap; the books do not assign blame among them, and this article will not invent a culprit.
That productivity gap is why a single greenfield mill can be both genuinely large and statistically small. Ten million tons, if it arrives in 2030, would be a lot of steel. The catalogue in front of us does not contain mill shipments, so there is no honest way to put that tonnage on a national production chart. What the books can say is that the labor attached to the announcement is modest next to the labor that remains, and that Iowa’s existing primary-metal footprint is modest next to Indiana’s. The politics of a midterm mill do not have to wait for either fact. The facts will still be there after the ribbon is cut.
What the announcement can change, and what it cannot
None of this is a forecast that the Iowa plant will fail, or that 1,750 jobs are trivial to the people who would hold them. A mill that large would be a new employer in a state whose factory payroll has been roughly flat for three decades. It would not, on the numbers now published, restore the 102,000 mill jobs lost since 1990, or move Iowa into Indiana’s primary-metal rank, or reverse the long slide in mill employment that was already visible before this White House, this war, or this election. The employment figures cited here are seasonally adjusted national and state payrolls from the Bureau of Labor Statistics, with mill data through June 2026 and most other payrolls through July. Industry GDP is annual and ends in 2024. Those vintages lag the announcement on purpose. They are the record the announcement will have to beat.
Sources and methods
Payroll figures are seasonally adjusted monthly Current Employment Statistics and State and Area Employment series from a BLS snapshot dated 24 August 2026. Iron and steel mill employment (CES3133110001) is observed through June 2026; primary metal manufacturing, total manufacturing, metal ore mining, primary-metal hourly earnings, and Iowa payrolls are observed through July 2026 where available. Annual averages for 2026 use only the months then published and are not full-year figures.
Employment values are stored in thousands of jobs and converted to headcount by multiplying by 1,000 and rounding. Null observations were not treated as zero. Seasonally adjusted series were not mixed with not-seasonally-adjusted counterparts. Iron and steel mills are a subset of primary metal manufacturing; mills and steel-products-from-purchased-steel were not added to primary metals in any total.
GDP is BEA annual GDP by state, SAGDP2 current dollars and SAGDP9 chained 2017 dollars, release dated 9 April 2026, with industry detail through 2024. Iowa all-industry GDP for 2025 exists in the extract but was not combined with 2024 primary-metal GDP. Primary metal manufacturing (NAICS 331) is broader than iron and steel mills. The $15 billion investment and 1,750 jobs are White House announcement figures, not BEA or BLS observations. The catalogue has no mill-tonnage series, so the 10-million-ton claim is not scored against production data.
Index charts use 1990 annual averages as 100. Percentage changes compare latest monthly levels with earlier annual averages and should be read as approximate. Hourly earnings are nominal. No causal effect of the announced mill is estimated.
Research completed 2026-09-29, for the September 28, 2026 news edition. The available source data may cover earlier periods; see the observation periods and source vintages above.