Research
618,000 construction jobs, and a $14,000 housing bill
The desert got a river. The payroll is already on the books.
Election Day in the Four Corners did not look like a civic brochure. Pagosa Springs, Colorado, watched the San Juan River climb toward a 1911 high-water mark. Flagstaff recorded its wettest November 1 on record. The Navajo Nation moved polling places. Tucson got two or three months of rain in a couple of days. The question for anyone who has to rebuild a washed-out highway, or staff a vote center on an island of high ground, is not poetic. It is a headcount.
The official books, which stop in August 2026, three months before the water arrived, do not describe the floods. They describe the workforce that would have to answer them. Seasonally adjusted construction employment in Arizona, New Mexico, Colorado and Utah summed to 618,200 jobs that month, according to the Bureau of Labor Statistics state payroll survey. That was 14,000 more than in August 2025, a 2.3 percent increase. The four-state total has been drifting higher for most of the past seven years. It is not a tiny industry, and it had not, as of late summer, started shrinking.
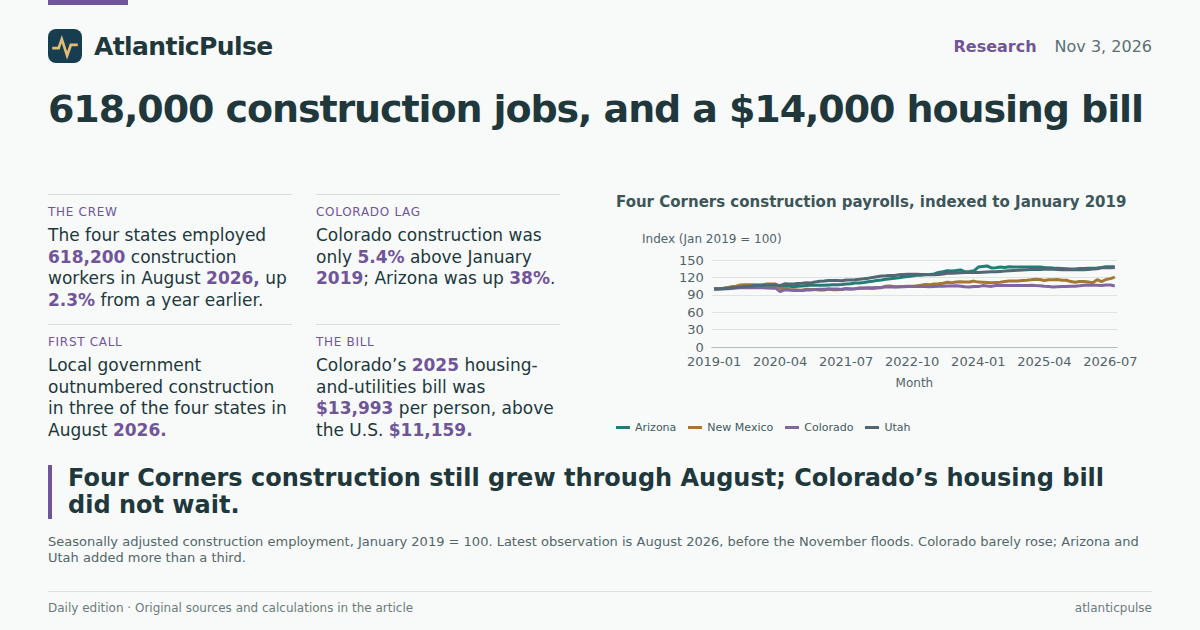
What the combined line conceals is how uneven the crew already was. Arizona had 228,200 construction jobs in August, up 38 percent from January 2019. Utah had 146,000, up 37 percent. New Mexico, far smaller, had 57,600, up 21 percent. Colorado — home to Pagosa Springs, Durango and the Animas River evacuations — had 186,400 construction jobs, only 5.4 percent above January 2019. In a region that spent the 2020s arguing about housing shortages and data-center slabs, Colorado’s building payroll barely grew.
Four Corners construction jobs combined

View exact chart values
| month | construction_thousands |
|---|---|
| 2019-01 | 496 |
| 2019-02 | 498.4 |
| 2019-03 | 498.9 |
| 2019-04 | 502.8 |
| 2019-05 | 506.5 |
| 2019-06 | 510 |
| 2019-07 | 512.7 |
| 2019-08 | 514.4 |
| 2019-09 | 516 |
| 2019-10 | 517.4 |
| 2019-11 | 518.8 |
| 2019-12 | 520 |
| 2020-01 | 521.2 |
| 2020-02 | 521.8 |
| 2020-03 | 521.2 |
| 2020-04 | 501.2 |
| 2020-05 | 510.9 |
| 2020-06 | 510.2 |
| 2020-07 | 506.5 |
| 2020-08 | 509.3 |
| 2020-09 | 510 |
| 2020-10 | 513.8 |
| 2020-11 | 514.7 |
| 2020-12 | 517.8 |
| 2021-01 | 519.2 |
| 2021-02 | 519.8 |
| 2021-03 | 522.8 |
| 2021-04 | 523 |
| 2021-05 | 522.6 |
| 2021-06 | 522.8 |
| 2021-07 | 527.9 |
| 2021-08 | 528.1 |
| 2021-09 | 531.4 |
| 2021-10 | 534.3 |
| 2021-11 | 536.5 |
| 2021-12 | 540.6 |
| 2022-01 | 543.3 |
| 2022-02 | 548.7 |
| 2022-03 | 550.6 |
| 2022-04 | 557 |
| 2022-05 | 559.2 |
| 2022-06 | 559.7 |
| 2022-07 | 562.3 |
| 2022-08 | 565.6 |
| 2022-09 | 567.7 |
| 2022-10 | 570.1 |
| 2022-11 | 572.8 |
| 2022-12 | 572.5 |
| 2023-01 | 573.7 |
| 2023-02 | 574.2 |
| 2023-03 | 576.6 |
| 2023-04 | 582.4 |
| 2023-05 | 585.3 |
| 2023-06 | 591.2 |
| 2023-07 | 589.7 |
| 2023-08 | 593.1 |
| 2023-09 | 594.6 |
| 2023-10 | 587.2 |
| 2023-11 | 588.1 |
| 2023-12 | 592.7 |
| 2024-01 | 601.6 |
| 2024-02 | 606.7 |
| 2024-03 | 606.7 |
| 2024-04 | 600.5 |
| 2024-05 | 604.2 |
| 2024-06 | 606.7 |
| 2024-07 | 606.6 |
| 2024-08 | 609.8 |
| 2024-09 | 610.2 |
| 2024-10 | 609.9 |
| 2024-11 | 611.3 |
| 2024-12 | 611.6 |
| 2025-01 | 613.2 |
| 2025-02 | 612 |
| 2025-03 | 611.6 |
| 2025-04 | 608.4 |
| 2025-05 | 608.1 |
| 2025-06 | 605.2 |
| 2025-07 | 605.4 |
| 2025-08 | 604.2 |
| 2025-09 | 603.6 |
| 2025-10 | 602.8 |
| 2025-11 | 602.2 |
| 2025-12 | 605.1 |
| 2026-01 | 607.7 |
| 2026-02 | 608.9 |
| 2026-03 | 608.5 |
| 2026-04 | 611.5 |
| 2026-05 | 612.8 |
| 2026-06 | 618.4 |
| 2026-07 | 618.5 |
| 2026-08 | 618.2 |
Four Corners construction payrolls, indexed to January 2019

View exact chart values
| month | Arizona | New_Mexico | Colorado | Utah |
|---|---|---|---|---|
| 2019-01 | 100 | 100 | 100 | 100 |
| 2019-02 | 100.7 | 100.4 | 100.5 | 100.1 |
| 2019-03 | 101 | 101 | 100 | 100.7 |
| 2019-04 | 102.2 | 102.1 | 100.5 | 101.1 |
| 2019-05 | 102.9 | 104 | 100.8 | 102.2 |
| 2019-06 | 103.4 | 104.8 | 101.8 | 102.8 |
| 2019-07 | 103.6 | 107.1 | 102 | 103.5 |
| 2019-08 | 103.9 | 107.3 | 102.1 | 104.3 |
| 2019-09 | 104.4 | 107.5 | 102.2 | 104.9 |
| 2019-10 | 105 | 107.5 | 102 | 105.7 |
| 2019-11 | 105.5 | 106.9 | 102.1 | 106.4 |
| 2019-12 | 105.9 | 107.5 | 102.1 | 106.6 |
| 2020-01 | 106.4 | 108.8 | 101.9 | 106.7 |
| 2020-02 | 107 | 108.6 | 101.4 | 107.1 |
| 2020-03 | 106.3 | 108.4 | 101.6 | 107.4 |
| 2020-04 | 103.8 | 101.3 | 95.6 | 105.7 |
| 2020-05 | 104.8 | 100.2 | 98.5 | 108.9 |
| 2020-06 | 105 | 99 | 98.4 | 108.7 |
| 2020-07 | 103.9 | 98.7 | 97.6 | 108.4 |
| 2020-08 | 104.9 | 98.1 | 97.7 | 109.5 |
| 2020-09 | 105.3 | 97.9 | 97.6 | 109.9 |
| 2020-10 | 106.1 | 99.6 | 98.1 | 110.7 |
| 2020-11 | 106.6 | 99 | 98.4 | 110.4 |
| 2020-12 | 106.6 | 99.2 | 99 | 112.2 |
| 2021-01 | 106.4 | 98.3 | 99.6 | 113.2 |
| 2021-02 | 106.4 | 98.5 | 99.6 | 113.8 |
| 2021-03 | 107 | 99.8 | 100 | 114.5 |
| 2021-04 | 107.2 | 98.7 | 99.9 | 114.9 |
| 2021-05 | 107.4 | 98.7 | 99.8 | 114.5 |
| 2021-06 | 108 | 99.4 | 99.3 | 114.2 |
| 2021-07 | 108.8 | 101 | 100.3 | 115.3 |
| 2021-08 | 109.2 | 100 | 100.2 | 115.6 |
| 2021-09 | 110.4 | 100.4 | 100.6 | 116 |
| 2021-10 | 110.5 | 101.5 | 101.4 | 116.8 |
| 2021-11 | 111.1 | 101.3 | 101.7 | 117.5 |
| 2021-12 | 112.4 | 101.3 | 102.1 | 118.6 |
| 2022-01 | 113.3 | 100.8 | 102.1 | 119.9 |
| 2022-02 | 114.8 | 101.9 | 102.8 | 121.1 |
| 2022-03 | 115.5 | 102.3 | 102.5 | 122.2 |
| 2022-04 | 116.7 | 104.8 | 103.8 | 122.8 |
| 2022-05 | 117.8 | 105 | 103.6 | 123.5 |
| 2022-06 | 118.7 | 104 | 103.6 | 123.1 |
| 2022-07 | 119.5 | 104.2 | 103.5 | 124.4 |
| 2022-08 | 120.6 | 104.4 | 103.8 | 125.2 |
| 2022-09 | 121.3 | 104.8 | 104.2 | 125.3 |
| 2022-10 | 122.5 | 104.6 | 104.3 | 125.5 |
| 2022-11 | 123.7 | 105.2 | 104.6 | 125.4 |
| 2022-12 | 123.8 | 106.5 | 104.1 | 125.2 |
| 2023-01 | 124.5 | 107.7 | 104.1 | 124.8 |
| 2023-02 | 125 | 107.5 | 104 | 124.7 |
| 2023-03 | 125.9 | 108.6 | 104.4 | 124.4 |
| 2023-04 | 128.7 | 109.2 | 104.6 | 124.8 |
| 2023-05 | 129.6 | 109.8 | 104.6 | 125.9 |
| 2023-06 | 131.4 | 111.5 | 105.1 | 127.2 |
| 2023-07 | 130.8 | 110.9 | 105 | 127.1 |
| 2023-08 | 131.7 | 112.1 | 105.6 | 127.4 |
| 2023-09 | 132.9 | 112.6 | 104.8 | 128.1 |
| 2023-10 | 129.6 | 111.9 | 103.8 | 128.2 |
| 2023-11 | 130.4 | 112.3 | 103.4 | 128.2 |
| 2023-12 | 131.4 | 113.6 | 104.4 | 128.8 |
| 2024-01 | 137.8 | 111.9 | 104.2 | 128.4 |
| 2024-02 | 138.8 | 111.7 | 105.8 | 129 |
| 2024-03 | 139.6 | 111.3 | 105 | 129.3 |
| 2024-04 | 136.4 | 110.9 | 104.4 | 129.6 |
| 2024-05 | 136.7 | 111.3 | 106 | 129.7 |
| 2024-06 | 137.7 | 111.7 | 106 | 130.3 |
| 2024-07 | 136.9 | 112.8 | 106.1 | 130.9 |
| 2024-08 | 138.3 | 113.6 | 105.9 | 131.6 |
| 2024-09 | 138.1 | 113.8 | 106.1 | 132 |
| 2024-10 | 137.8 | 114 | 105.9 | 132.3 |
| 2024-11 | 138.1 | 114.9 | 105.9 | 132.9 |
| 2024-12 | 137.8 | 115.1 | 106.1 | 133.1 |
| 2025-01 | 137.8 | 115.9 | 106.4 | 133.6 |
| 2025-02 | 137.7 | 116.9 | 105.8 | 133.4 |
| 2025-03 | 137.7 | 116.3 | 105.5 | 133.6 |
| 2025-04 | 136.9 | 114.6 | 104.7 | 134 |
| 2025-05 | 136.6 | 116.1 | 104.3 | 134.3 |
| 2025-06 | 136 | 116.1 | 103.4 | 133.9 |
| 2025-07 | 135.7 | 116.3 | 104 | 133.4 |
| 2025-08 | 135.4 | 115.1 | 104.2 | 133.1 |
| 2025-09 | 135 | 115.1 | 104.1 | 133.2 |
| 2025-10 | 134.4 | 112.8 | 104.9 | 133.1 |
| 2025-11 | 134.5 | 111.7 | 104.7 | 133.2 |
| 2025-12 | 135.1 | 112.8 | 105.5 | 133.3 |
| 2026-01 | 135.4 | 113 | 106.6 | 133.3 |
| 2026-02 | 135.7 | 112.3 | 106.9 | 133.7 |
| 2026-03 | 135.8 | 110.7 | 106.6 | 134.4 |
| 2026-04 | 136 | 116.1 | 106.3 | 135 |
| 2026-05 | 137.1 | 112.8 | 106 | 136.6 |
| 2026-06 | 138.5 | 116.3 | 106.9 | 136.5 |
| 2026-07 | 138.3 | 118 | 106.7 | 136.5 |
| 2026-08 | 138.4 | 120.5 | 105.4 | 137.1 |
The first phone call is not a contractor
Flood response does not begin with a framing crew. It begins with a county road department, a tribal election office, a sheriff’s dispatcher, a public-works yard trying to keep a bridge from becoming a boat. Local government is the payroll that closes the highway and reprints the ballot.
In August 2026, local-government employment exceeded construction in three of the four states. Arizona had 281,500 local-government jobs against 228,200 in construction. Colorado had 288,700 against 186,400. New Mexico’s local government, 109,100, was nearly twice construction. Only Utah was close to even: 147,800 in local government, 146,000 in construction. As a share of each state’s total nonfarm payroll, construction ran from 6.3 percent in New Mexico and Colorado to 8.1 percent in Utah. Local government ran from 8.3 percent in Utah to 12.0 percent in New Mexico.
Those government jobs were not racing ahead of the water. Arizona’s local-government payroll was essentially unchanged from a year earlier, up 0.1 percent, and only 2.2 percent above January 2019. Colorado’s was down 1.4 percent from August 2025. Utah’s was down 0.5 percent. New Mexico was the exception, up 3.7 percent on the year. None of this measures overtime on a sandbag line. It does measure how many people were already on the local public payroll before the storms. The people who had to improvise Election Day in Pagosa Springs and on the Navajo Nation were not drawing from a rapidly expanding roster.
Construction versus local-government jobs, August 2026

View exact chart values
| state | construction | local_government |
|---|---|---|
| Arizona | 228.2 | 281.5 |
| New Mexico | 57.6 | 109.1 |
| Colorado | 186.4 | 288.7 |
| Utah | 146 | 147.8 |
The bill the water hit was already the housing bill
The floods did not arrive in a cheap housing market. In 2025, the latest full year in the Bureau of Economic Analysis state consumption accounts, Americans spent $11,159 per person on housing and utilities. That is not a mortgage payment. It is BEA’s broader bill: tenant rent, an imputed rental value for owner-occupied homes, farm dwellings, group housing, plus water, sanitation, electricity and gas. Colorado’s figure was $13,993. Arizona’s was $12,041. Utah’s was $10,447. New Mexico’s was $9,341.
Housing and utilities already took 20.6 percent of Arizona’s per-person consumption and 20.4 percent of Colorado’s, against 18.3 percent for the United States. Over a decade the bill grew faster in the desert than in the country as a whole. Utah’s per-person housing-and-utilities spending rose 85 percent from 2015 to 2025. Arizona’s rose 81 percent. Colorado’s rose 72 percent. The U.S. average rose 64 percent. New Mexico tracked the national pace, up 63 percent, from a lower base.
A wet November does not rewrite a 2025 consumption table. It does land on a household budget that was already heavy with shelter and power. The same Four Corners states that just treated rain as an emergency have spent ten years watching that line climb. Colorado started the decade as the expensive one and remained the expensive one. Utah started cheaper and nearly doubled. If you are digging mud out of a neighbor’s yard in Durango, or building dirt berms on a ranch near Montezuma Creek, the official books say the thing you are trying to save was already taking a fifth of what people spend.
2025 housing-and-utilities bill per person

View exact chart values
| state | housing_utilities_2025 | total_pce_2025 | housing_share_pct_2025 | housing_2015 | housing_2019 | pct_vs_2015 | pct_vs_2019 |
|---|---|---|---|---|---|---|---|
| New Mexico | 9341 | 50932 | 18.3 | 5721 | 6358 | 63.3 | 46.9 |
| Utah | 10447 | 54512 | 19.2 | 5649 | 6664 | 84.9 | 56.8 |
| United States | 11159 | 61062 | 18.3 | 6824 | 7758 | 63.5 | 43.8 |
| Arizona | 12041 | 58361 | 20.6 | 6664 | 7558 | 80.7 | 59.3 |
| Colorado | 13993 | 68438 | 20.4 | 8123 | 9659 | 72.3 | 44.9 |
Housing-and-utilities spending per person, 2015–2025

View exact chart values
| year | United_States | Arizona | New_Mexico | Colorado | Utah |
|---|---|---|---|---|---|
| 2015 | 6824 | 6664 | 5721 | 8123 | 5649 |
| 2016 | 6996 | 6856 | 5840 | 8431 | 5933 |
| 2017 | 7196 | 7066 | 6018 | 8754 | 6059 |
| 2018 | 7486 | 7317 | 6182 | 9011 | 6286 |
| 2019 | 7758 | 7558 | 6358 | 9659 | 6664 |
| 2020 | 8106 | 8186 | 6636 | 9621 | 6852 |
| 2021 | 8560 | 8780 | 6972 | 10620 | 7434 |
| 2022 | 9325 | 9865 | 7637 | 11692 | 8392 |
| 2023 | 10017 | 10786 | 8345 | 12541 | 9113 |
| 2024 | 10585 | 11287 | 8774 | 13208 | 9692 |
| 2025 | 11159 | 12041 | 9341 | 13993 | 10447 |
What the books will not say
Two caveats matter more than the punchline. First, the job counts are statewide. Flagstaff is not Phoenix. Pagosa Springs is not Denver. Albuquerque is not the San Juan valley. A statewide construction boom can leave a mountain town with the same three contractors it had last year. The BLS survey does not publish a Four Corners metro that matches the flood map. Treating Arizona’s 228,200 construction jobs as a pool sitting beside the Navajo Nation would be a category error.
Second, the payrolls end in August. They cannot tell you whether November’s water created overtime, delayed a housing start, or washed out a job site. Construction in these states had been growing modestly over the prior year, not collapsing. That is useful context. It is not a damage assessment. Housing-and-utilities spending is annual, in current dollars, and includes an imputed rent for people who already own their homes. It is not a cash mortgage, and it is not a claim that floods raised rents.
The honest answer to the question is narrower than a reconstruction montage. As of late summer 2026, the Four Corners still had a substantial construction workforce — more than 600,000 jobs, slightly larger than a year earlier — but Colorado’s share of that crew had barely grown since 2019, and local government, the first responders of both storms and elections, was flat or down in three of the four states. The housing-and-utilities bill those floods rolled through was already $9,300 to $14,000 per person a year. The water was new. The ledger was not.
Sources and methods
Payroll figures are seasonally adjusted all-employees counts from the BLS Current Employment Statistics state survey, snapshot release bls-sm-snapshot-2026-08-24, observed through August 2026. Values are in thousands of jobs. Construction is NAICS supersector 20. Local government is industry 90930000. Total nonfarm is the statewide all-employees total. January 2019 is used as the pre-pandemic index base. Year-over-year comparisons use August 2025 versus August 2026. Four-state totals are sums of the four statewide series; they are not a published Four Corners region.
Housing and utilities and total PCE are BEA annual per-capita personal consumption expenditures by state (SAPCE2), current dollars, through 2025, release bea-sapce-2026-09-30. Housing and utilities include tenant rent, imputed owner-occupied rent, farm and group housing, and household utilities (water, sanitation, electricity and gas). Per-capita figures are not household averages. Shares are housing-and-utilities divided by total per-capita PCE in the same year and state.
Missing observations were not treated as zero. Duplicate period keys, if any, kept the first non-null value. The calculation does not infer that November 2026 floods changed August 2026 payrolls or 2025 consumption. Statewide series do not describe individual flood counties or tribal lands. Provider snapshot dates lag publication; these are not current-day observations.
Research completed 2026-11-04, for the November 3, 2026 news edition. The available source data may cover earlier periods; see the observation periods and source vintages above.