Research
100,000 strikers, inside a 570,000-job payroll
A one-day walkout in a half-million-job workforce
SEIU Local 1000 says it represents about 100,000 California state workers — accountants, analysts, nurses, IT staff, custodians — and that tens of thousands are expected to walk out Wednesday for the first statewide strike in the union’s 44-year history. The official payroll books put that walkout in a much larger room. In August 2026, still a preliminary CES print, California employed 570,200 people on seasonally adjusted state-government payrolls. Local 1000’s 100,000 members are about 18 percent of that statewide state-government total, and about half of one percent of California’s 18.2 million nonfarm jobs.
State government is not where most public employees in California work. Local government, including school districts, employed 1.87 million people in the same month. Federal agencies in the state employed 228,600. All government together came to 2.67 million jobs. The people who process driver’s licenses and unemployment claims are a politically loud slice of a public workforce that is, in the official count, mostly local.
Most California public jobs are local, not state

View exact chart values
| category | thousands |
|---|---|
| Local government | 1874.4 |
| State government | 570.2 |
| Federal government | 228.6 |
The jobs did not vanish. They also did not boom.
Indexed to January 2015, California’s seasonally adjusted state-government payroll is up 13 percent through August 2026. The private payroll is up 16 percent over the same span. From January 2019 — a cleaner pre-pandemic waypoint — state government is up 5.7 percent and private employment is up 5.3 percent. That is not a collapsing public sector, and it is not a runaway hiring binge either. The two lines move together more than the strike rhetoric implies.
Not-seasonally-adjusted detail for August 2026 shows why the 570,200 headline is not the same thing as “people who might be on a Local 1000 picket.” Educational services accounted for 233,500 of 550,000 not-seasonally-adjusted state-government jobs that month, or about 43 percent — mostly the university system, which is not the DMV. The remaining 316,500 non-education state jobs are the closer envelope for the union’s 100,000 members. Even there, Local 1000 is a large bargaining unit, not the entire residual payroll.
California state-government jobs have not lagged the private payroll

View exact chart values
| period | state_gov_index | private_index | state_gov_thousands | private_thousands |
|---|---|---|---|---|
| 2015-01 | 100 | 100 | 505.2 | 13374.3 |
| 2015-02 | 100.02 | 100.18 | 505.3 | 13397.9 |
| 2015-03 | 99.86 | 100.53 | 504.5 | 13445.6 |
| 2015-04 | 100.18 | 100.7 | 506.1 | 13467.7 |
| 2015-05 | 100.36 | 101.05 | 507 | 13514.6 |
| 2015-06 | 100.46 | 101.31 | 507.5 | 13549.3 |
| 2015-07 | 100.99 | 101.92 | 510.2 | 13630.5 |
| 2015-08 | 101.21 | 102.15 | 511.3 | 13662 |
| 2015-09 | 101.17 | 102.33 | 511.1 | 13685.3 |
| 2015-10 | 101.62 | 102.78 | 513.4 | 13746.3 |
| 2015-11 | 101.76 | 102.95 | 514.1 | 13769 |
| 2015-12 | 101.6 | 103.19 | 513.3 | 13801.4 |
| 2016-01 | 102.28 | 103.35 | 516.7 | 13822.7 |
| 2016-02 | 101.98 | 103.59 | 515.2 | 13855.1 |
| 2016-03 | 102.1 | 103.39 | 515.8 | 13827.6 |
| 2016-04 | 102.4 | 104.14 | 517.3 | 13928.1 |
| 2016-05 | 102.55 | 104.24 | 518.1 | 13941.9 |
| 2016-06 | 102.69 | 104.15 | 518.8 | 13930 |
| 2016-07 | 103.64 | 104.67 | 523.6 | 13998.5 |
| 2016-08 | 102.93 | 104.7 | 520 | 14003.4 |
| 2016-09 | 103.35 | 104.97 | 522.1 | 14039 |
| 2016-10 | 103.64 | 105.08 | 523.6 | 14053.1 |
| 2016-11 | 103.4 | 105.22 | 522.4 | 14072.7 |
| 2016-12 | 103.64 | 105.35 | 523.6 | 14089.3 |
| 2017-01 | 103.64 | 105.36 | 523.6 | 14091.8 |
| 2017-02 | 103.9 | 105.62 | 524.9 | 14126.2 |
| 2017-03 | 104.06 | 105.93 | 525.7 | 14167.4 |
| 2017-04 | 104.2 | 106.12 | 526.4 | 14192.9 |
| 2017-05 | 104.37 | 106.51 | 527.3 | 14244.4 |
| 2017-06 | 104.35 | 106.81 | 527.2 | 14284.8 |
| 2017-07 | 104.77 | 106.9 | 529.3 | 14296.6 |
| 2017-08 | 104.51 | 107.06 | 528 | 14318.7 |
| 2017-09 | 104.69 | 107.32 | 528.9 | 14353.7 |
| 2017-10 | 105.01 | 107.43 | 530.5 | 14367.9 |
| 2017-11 | 105.17 | 107.6 | 531.3 | 14391.4 |
| 2017-12 | 105.27 | 107.94 | 531.8 | 14436.5 |
| 2018-01 | 105.03 | 108.17 | 530.6 | 14467.4 |
| 2018-02 | 105.17 | 108.45 | 531.3 | 14505 |
| 2018-03 | 105.15 | 108.51 | 531.2 | 14511.8 |
| 2018-04 | 105.4 | 108.56 | 532.5 | 14519.2 |
| 2018-05 | 105.66 | 108.74 | 533.8 | 14542.9 |
| 2018-06 | 106.14 | 109.03 | 536.2 | 14581.7 |
| 2018-07 | 104.75 | 109.16 | 529.2 | 14599.6 |
| 2018-08 | 105.32 | 109.4 | 532.1 | 14631.2 |
| 2018-09 | 105.94 | 109.54 | 535.2 | 14649.9 |
| 2018-10 | 106.24 | 109.7 | 536.7 | 14672.2 |
| 2018-11 | 106.43 | 109.78 | 537.7 | 14682.6 |
| 2018-12 | 106.71 | 110.08 | 539.1 | 14722.1 |
| 2019-01 | 106.75 | 110.09 | 539.3 | 14723.7 |
| 2019-02 | 106.53 | 110.15 | 538.2 | 14732.1 |
| 2019-03 | 106.71 | 110.3 | 539.1 | 14751.3 |
| 2019-04 | 106.71 | 110.33 | 539.1 | 14755.4 |
| 2019-05 | 106.33 | 110.52 | 537.2 | 14780.9 |
| 2019-06 | 105.84 | 110.83 | 534.7 | 14823.1 |
| 2019-07 | 104.02 | 110.95 | 525.5 | 14838.2 |
| 2019-08 | 105.17 | 111.2 | 531.3 | 14872.7 |
| 2019-09 | 104.33 | 111.38 | 527.1 | 14896.5 |
| 2019-10 | 104.55 | 111.46 | 528.2 | 14907.5 |
| 2019-11 | 105.54 | 111.86 | 533.2 | 14960.7 |
| 2019-12 | 104.47 | 112 | 527.8 | 14978.7 |
| 2020-01 | 107.84 | 112.29 | 544.8 | 15018 |
| 2020-02 | 107.17 | 112.47 | 541.4 | 15042.1 |
| 2020-03 | 106.1 | 111.15 | 536 | 14866.1 |
| 2020-04 | 104.77 | 92.67 | 529.3 | 12393.8 |
| 2020-05 | 103.98 | 94.74 | 525.3 | 12670.3 |
| 2020-06 | 102.97 | 98.73 | 520.2 | 13205 |
| 2020-07 | 102.49 | 99.01 | 517.8 | 13242.2 |
| 2020-08 | 104.28 | 99.3 | 526.8 | 13281 |
| 2020-09 | 104.04 | 100.56 | 525.6 | 13449.2 |
| 2020-10 | 104.24 | 102.27 | 526.6 | 13677.8 |
| 2020-11 | 103.78 | 102.87 | 524.3 | 13758.4 |
| 2020-12 | 103.74 | 102.27 | 524.1 | 13678.1 |
| 2021-01 | 103.74 | 101.51 | 524.1 | 13575.6 |
| 2021-02 | 104.39 | 103.07 | 527.4 | 13785.4 |
| 2021-03 | 104.47 | 104.06 | 527.8 | 13917 |
| 2021-04 | 104.61 | 105.11 | 528.5 | 14058.1 |
| 2021-05 | 104.73 | 105.9 | 529.1 | 14163.3 |
| 2021-06 | 104.28 | 106.39 | 526.8 | 14228.5 |
| 2021-07 | 106.08 | 107.62 | 535.9 | 14393.7 |
| 2021-08 | 107.96 | 108.15 | 545.4 | 14464.1 |
| 2021-09 | 108.17 | 108.1 | 546.5 | 14457.8 |
| 2021-10 | 107.44 | 109.99 | 542.8 | 14709.9 |
| 2021-11 | 107.24 | 110.46 | 541.8 | 14773.9 |
| 2021-12 | 107.24 | 110.95 | 541.8 | 14838.8 |
| 2022-01 | 107.64 | 110.96 | 543.8 | 14840.3 |
| 2022-02 | 106.83 | 112.02 | 539.7 | 14982 |
| 2022-03 | 107.58 | 112.46 | 543.5 | 15040.3 |
| 2022-04 | 107.64 | 112.87 | 543.8 | 15095.6 |
| 2022-05 | 107.98 | 113.07 | 545.5 | 15122.8 |
| 2022-06 | 107.54 | 113.37 | 543.3 | 15162.1 |
| 2022-07 | 107.32 | 113.68 | 542.2 | 15204 |
| 2022-08 | 106.43 | 113.9 | 537.7 | 15233.2 |
| 2022-09 | 106.39 | 114.03 | 537.5 | 15250.7 |
| 2022-10 | 105.62 | 113.95 | 533.6 | 15239.5 |
| 2022-11 | 109.82 | 113.85 | 554.8 | 15226.6 |
| 2022-12 | 109.82 | 113.89 | 554.8 | 15232 |
| 2023-01 | 109.98 | 113.5 | 555.6 | 15180.4 |
| 2023-02 | 109.78 | 113.68 | 554.6 | 15203.7 |
| 2023-03 | 109.44 | 113.61 | 552.9 | 15195.1 |
| 2023-04 | 108.99 | 113.52 | 550.6 | 15182.8 |
| 2023-05 | 111.01 | 113.87 | 560.8 | 15229 |
| 2023-06 | 110.31 | 114.01 | 557.3 | 15247.8 |
| 2023-07 | 110.69 | 113.75 | 559.2 | 15212.6 |
| 2023-08 | 110.19 | 113.81 | 556.7 | 15221.7 |
| 2023-09 | 110.1 | 114.11 | 556.2 | 15261 |
| 2023-10 | 110.02 | 113.82 | 555.8 | 15222.3 |
| 2023-11 | 113.44 | 113.75 | 573.1 | 15212.7 |
| 2023-12 | 113.82 | 114.05 | 575 | 15253.5 |
| 2024-01 | 114.03 | 114.88 | 576.1 | 15365 |
| 2024-02 | 114.47 | 114.31 | 578.3 | 15287.5 |
| 2024-03 | 114.63 | 114.37 | 579.1 | 15296.1 |
| 2024-04 | 114.85 | 114.13 | 580.2 | 15263.8 |
| 2024-05 | 115.16 | 114.09 | 581.8 | 15258.4 |
| 2024-06 | 115.44 | 114.07 | 583.2 | 15256 |
| 2024-07 | 116.39 | 114.32 | 588 | 15289.5 |
| 2024-08 | 115.84 | 114.28 | 585.2 | 15283.7 |
| 2024-09 | 117.2 | 114.26 | 592.1 | 15281.2 |
| 2024-10 | 117.34 | 114.68 | 592.8 | 15337.6 |
| 2024-11 | 117.66 | 114.65 | 594.4 | 15333.6 |
| 2024-12 | 117.62 | 114.33 | 594.2 | 15291.4 |
| 2025-01 | 117.42 | 114.31 | 593.2 | 15288.6 |
| 2025-02 | 116.84 | 114.31 | 590.3 | 15288.7 |
| 2025-03 | 116.9 | 114.35 | 590.6 | 15293.4 |
| 2025-04 | 116.49 | 114.73 | 588.5 | 15344.9 |
| 2025-05 | 115.84 | 114.83 | 585.2 | 15357.1 |
| 2025-06 | 115.3 | 114.67 | 582.5 | 15336.7 |
| 2025-07 | 114.31 | 114.66 | 577.5 | 15335.6 |
| 2025-08 | 113.86 | 114.86 | 575.2 | 15361.9 |
| 2025-09 | 113.16 | 114.81 | 571.7 | 15355.7 |
| 2025-10 | 111.68 | 114.94 | 564.2 | 15372.3 |
| 2025-11 | 112.37 | 115.15 | 567.7 | 15400.9 |
| 2025-12 | 112.51 | 115.15 | 568.4 | 15400.2 |
| 2026-01 | 112.39 | 115.76 | 567.8 | 15482.2 |
| 2026-02 | 112.39 | 115.57 | 567.8 | 15456.9 |
| 2026-03 | 112.77 | 115.8 | 569.7 | 15487.4 |
| 2026-04 | 112.67 | 115.78 | 569.2 | 15485.2 |
| 2026-05 | 111.98 | 115.68 | 565.7 | 15471.3 |
| 2026-06 | 111.96 | 115.76 | 565.6 | 15482.4 |
| 2026-07 | 112.63 | 115.7 | 569 | 15474.4 |
| 2026-08 | 112.87 | 115.92 | 570.2 | 15504 |
Among the biggest states, California is not an outlier
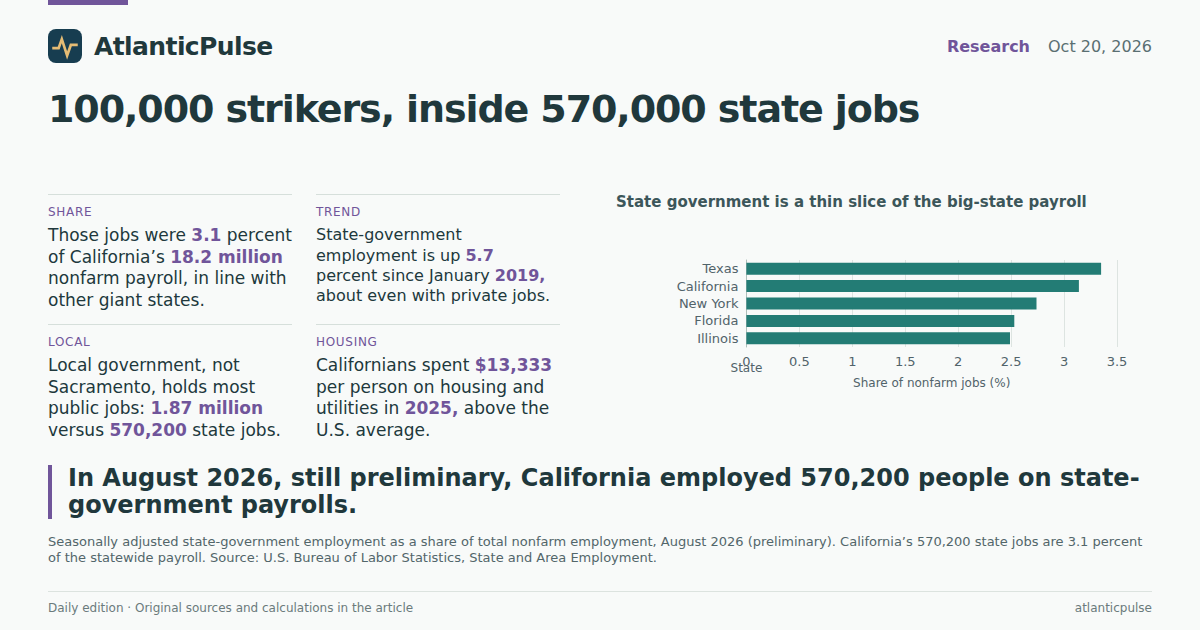
As a share of the total nonfarm payroll, California’s state-government workforce is ordinary for a giant state. In August 2026, state government was 3.1 percent of California jobs. Texas was 3.4 percent. New York was 2.7 percent, Florida 2.5 percent and Illinois 2.5 percent. California has more state-government jobs than any of those peers in raw numbers — 570,200 against Texas’s 484,800 — because California has more jobs, period. The strike is not happening in a state that employs an unusually fat share of its workers in Sacramento.
The wage bill attached to those jobs is not small. BEA state estimates put California state-government wages and salaries at $64.5 billion in 2025, 3.5 percent of the state’s $1.86 trillion in nonfarm wages. That wage pool rose 51 percent from 2019 to 2025, faster than private nonfarm wages in the state, which rose 40 percent. Dividing 2025 wages by the 2025 average CES state-government headcount produces a rough $111,000 per job-year in California, below New York’s $121,000 and well above Texas ($71,000) and Florida ($61,000). That is not take-home pay for a DMV clerk. It is an average across universities, prisons, hospitals and agencies, mixing two statistical systems, and it says nothing causal about whether Local 1000’s members are underpaid.
State government is a thin slice of the big-state payroll

View exact chart values
| state | state_gov_thousands | nonfarm_thousands | share_pct | status | period |
|---|---|---|---|---|---|
| Texas | 484.8 | 14469.3 | 3.35 | footnote:P | 2026-08 |
| California | 570.2 | 18177.2 | 3.14 | footnote:P | 2026-08 |
| New York | 272.9 | 9946 | 2.74 | footnote:P | 2026-08 |
| Florida | 254.4 | 10051.6 | 2.53 | footnote:P | 2026-08 |
| Illinois | 153.5 | 6175.6 | 2.49 | footnote:P | 2026-08 |
The living-cost argument is real. It is not a unique California tax on public workers.
The union’s public case is that state workers have not had a good living wage and that a return-to-office order landed on people who already cannot make California housing work. The consumption books partly back the cost complaint. In 2025, Californians spent $13,333 per person on housing and utilities, 19 percent above the U.S. figure of $11,159, and 70 percent above California’s own 2015 level. Regional price parities for 2024 put California housing 54 percent above the national average, with an all-items price level 11 percent above the nation. Inflation-adjusted per-capita personal income in the state did rise 13 percent from 2019 to 2024, to $63,028 in 2017 dollars — so the average income path is not a collapse either.
Florida spent even more per person on housing and utilities in 2025, $14,278, while employing a smaller share of its workforce in state government. New York’s housing-and-utilities bill sat between the two. The scatter of the five largest states is a reminder, not a morality play: a high housing bill and a large state-government share do not travel together. California’s strikers are arguing about purchasing power in an expensive state. They are not arguing from a uniquely bloated headcount.
California’s housing-and-utilities bill is high. Florida’s is higher.

View exact chart values
| state | year | dollars |
|---|---|---|
| Florida | 2025 | 14278 |
| California | 2025 | 13333 |
| New York | 2025 | 12214 |
| United States | 2025 | 11159 |
| Texas | 2025 | 10353 |
| Illinois | 2025 | 10323 |
A fatter housing bill does not mean a fatter state workforce

View exact chart values
| state | state_gov_share | housing_pce |
|---|---|---|
| California | 3.14 | 13333 |
| Texas | 3.35 | 10353 |
| Florida | 2.53 | 14278 |
| New York | 2.74 | 12214 |
| Illinois | 2.49 | 10323 |
What the walkout can and cannot tell you
Wednesday’s picket, if it happens, will be felt at counters Californians actually use. The union is not 2.7 million public employees, and it is not even most of state government. It is roughly 100,000 people inside a 570,000-job state payroll that has grown in line with the private sector since 2019, in a state where housing still costs more than the national average and where local government — not Sacramento — employs the bulk of the public workforce.
That is a less cinematic story than a historic first strike, which is why it is the useful one. The CES print through August 2026 is preliminary. The wage figures are 2025 annual totals. None of this says whether the Newsom administration bargained in good faith, whether a one-day strike changes the next contract, or whether $111,000 per job-year is “enough” for the people actually walking out. It does say the official books do not show a vanishing state workforce. They show a large, mixed public employer whose most visible union is still a minority of the payroll, striking in a housing market that has been expensive for a long time.
Sources and methods
Payroll figures are U.S. Bureau of Labor Statistics Current Employment Statistics (State and Area Employment) statewide series. August 2026 values carry the CES preliminary footnote. Seasonally adjusted series are used for levels, shares and 2015–2026 comparisons. Not-seasonally-adjusted series are used only for the August educational-services split, which is not published seasonally adjusted in this snapshot.
CES “state government” includes universities, corrections, hospitals and agencies. It is not the same population as SEIU Local 1000. The union’s published membership of about 100,000 is taken from the day’s reporting and is compared with CES totals as a size check, not as a claim that every member appears in the CES count.
Wage totals are Bureau of Economic Analysis annual wages and salaries by place of work for NAICS state government, in thousands of current dollars, converted to billions. The 2019–2025 percent change compares nominal totals and is not inflation-adjusted. Implied dollars per job-year divide 2025 BEA wages by the 2025 average of monthly CES state-government employment; the two programs differ in coverage and timing, so the result is a crosswalk, not a salary survey and not Local 1000 pay.
Housing-and-utilities spending is BEA per-capita personal consumption expenditures for 2025 and includes tenant rent, imputed owner-occupied rent and household utilities. Regional price parities are 2024 annual indexes (U.S. = 100). Real per-capita personal income is in chained 2017 dollars through 2024. Observation periods are calendar years or months as labeled; they are not the October 20, 2026 news cycle. No causal claim is made about the strike, bargaining, or housing costs.
Research completed 2026-10-21, for the October 20, 2026 news edition. The available source data may cover earlier periods; see the observation periods and source vintages above.
- U.S. Bureau of Labor Statistics, State and Area Employment: Source 1, Source 2
- U.S. Bureau of Economic Analysis, annual state wages and salaries: Source 1, Source 2
- U.S. Bureau of Economic Analysis, personal consumption expenditures by state: Source 1, Source 2
- U.S. Bureau of Economic Analysis, regional price parities and real income: Source 1, Source 2